This website works best with a newer web browser such as Chrome, Firefox, Safari or Microsoft Edge. Internet Explorer is not supported by this website.

Warm Seclusion off the US East Coast

1-minute Mesoscale Domain Sector GOES-16 (GOES-East) “Red” Visible (0.64 µm) and “Clean” Infrared Window (10.3 µm) images (above) displayed the small eye-like feature associated with a warm seclusion that developed about 200 miles southeast of the New Jersey coast on 15 January 2023. Areas of deep convection around the periphery of the seclusion occasionally... Read More

GOES-16 “Red” Visible (0.64 µm) and “Clean” Infrared Window (10.3 µm) images [click to play MP4 | animated GIF]

1-minute Mesoscale Domain Sector GOES-16 (GOES-East) “Red” Visible (0.64 µm) and “Clean” Infrared Window (10.3 µm) images (above) displayed the small eye-like feature associated with a warm seclusion that developed about 200 miles southeast of the New Jersey coast on 15 January 2023. Areas of deep convection around the periphery of the seclusion occasionally exhibited cloud-top infrared brightness temperatures around -50ºC.

During the preceding nighttime hours, a comparison of Suomi-NPP VIIRS Infrared Window (11.45 µm) and Day/Night Band (0.7 µm) images valid at 0718 UTC (below) provided a view of the cyclone as it was beginning to transition to its occluded phase — and the Sea Surface Temperature derived product indicated that water temperatures in the general vicinity were in the upper 60s to low 70s F (suggesting that the system was very near the axis of the Gulf Stream). One isolated bright lightning streak was seen in the Day/Night Band image, associated with a thunderstorm located near the warm front (which exhibited a cloud-top infrared brightness temperature of -56ºC).

Suomi-NPP VIIRS Infrared Window (11.45 µm), Day/Night Band (0.7 µm) and Sea Surface Temperature derived product, valid at 0718 UTC [click to enlarge]

View only this post Read Less

Severe thunderstorms across the Deep South and Ohio Valley

1-minute GOES-16 (GOES-East) Mesoscale Domain Sector “Red” Visible (0.64 µm) images (above) included time-matched (+/- 3 minutes) plots of SPC Storm Reports — which showed severe thunderstorms that moved east-northeastward across parts of the Deep South and Ohio Valley on 12 January 2023.1-minute GOES-16 “Clean” Infrared Window (10.3 µm) images (below) indicated that the coldest pulsing overshooting tops associated... Read More

GOES-16 “Red” Visible (0.64 µm) images, with time-matched SPC Storm Reports plotted in red [click to play animated GIF | MP4]

1-minute GOES-16 (GOES-East) Mesoscale Domain Sector “Red” Visible (0.64 µm) images (above) included time-matched (+/- 3 minutes) plots of SPC Storm Reports — which showed severe thunderstorms that moved east-northeastward across parts of the Deep South and Ohio Valley on 12 January 2023.

1-minute GOES-16 “Clean” Infrared Window (10.3 µm) images (below) indicated that the coldest pulsing overshooting tops associated many of the storms exhibited infrared brightness temperatures around -70ºC range (darker black enhancement). These thunderstorms produced numerous tornadoes (with multiple fatalities in Alabama and Georgia), hail up to 1.75 inches in diameter in Mississippi and Alabama, and damaging winds up to 67 mph in Alabama.

GOES-16 “Clean” Infrared Window (10.3 µm) images, with time-matched SPC Storm Reports plotted in blue [click to play animated GIF | MP4]

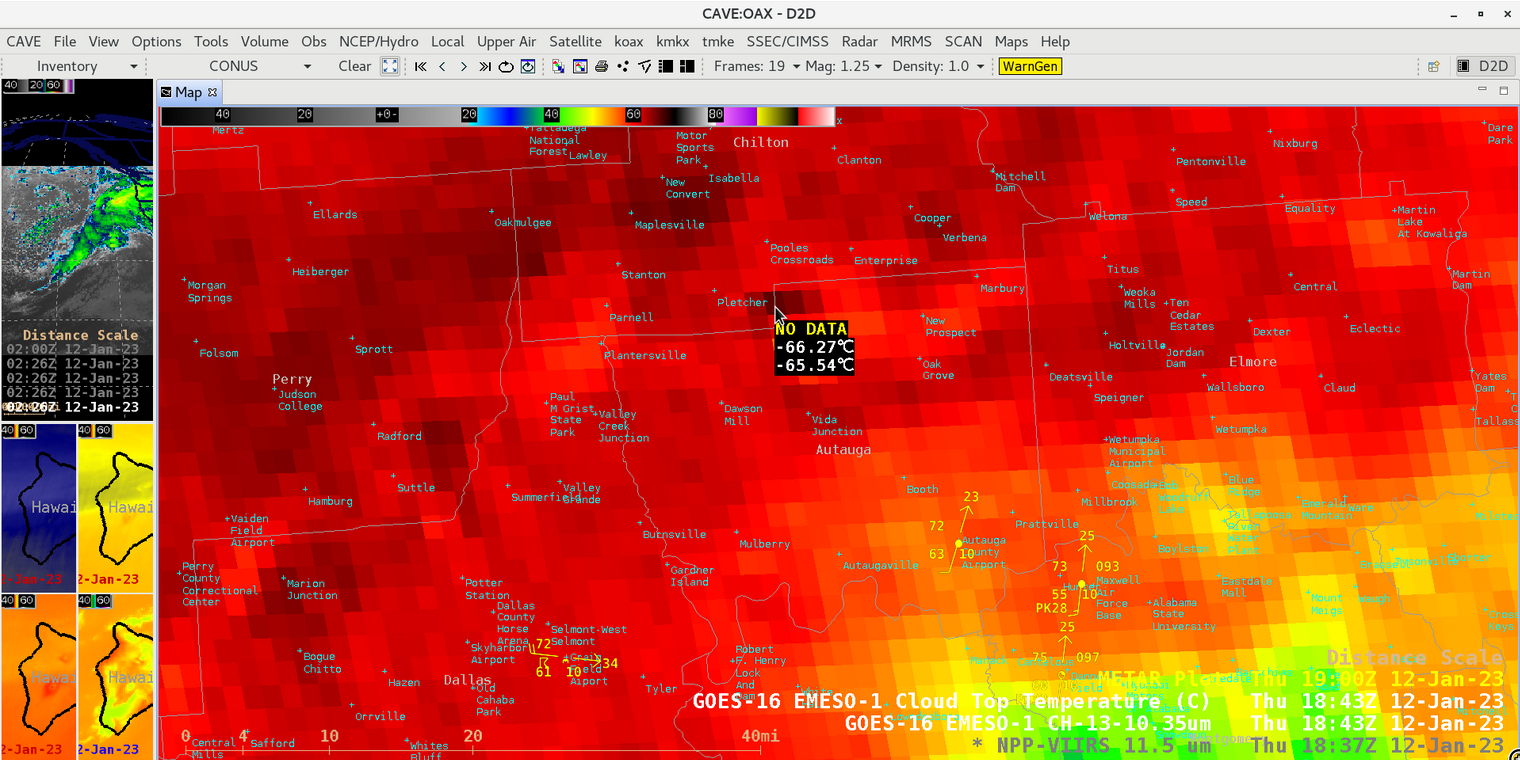
In a toggle between NOAA-20 (mislabeled as NPP) VIIRS Infrared Window (11.45 µm) and Near-Infrared (1.61 µm) images valid at 1843 UTC (below), the thunderstorm located over Autauga County, Alabama (where at least 7 fatalities occurred) appeared to exhibit a subtle Above-Anvil Cirrus Plume or AACP (reference | VISIT training) — along with a pronounced cold / warm (-71ºC / -50ºC) cloud-top infrared brightness temperature couplet. According to NWS Birmingham, this was the same tornado-producing thunderstorm that produced extensive damage in Selma (located just to the southwest, in adjacent Dallas County) about 30 minutes earlier.

NOAA-20 VIIRS Infrared Window (11.45 µm) and Near-Infrared (1.61 µm) images valid at 1843 UTC, with plots of METAR surface reports and Cites [click to enlarge]

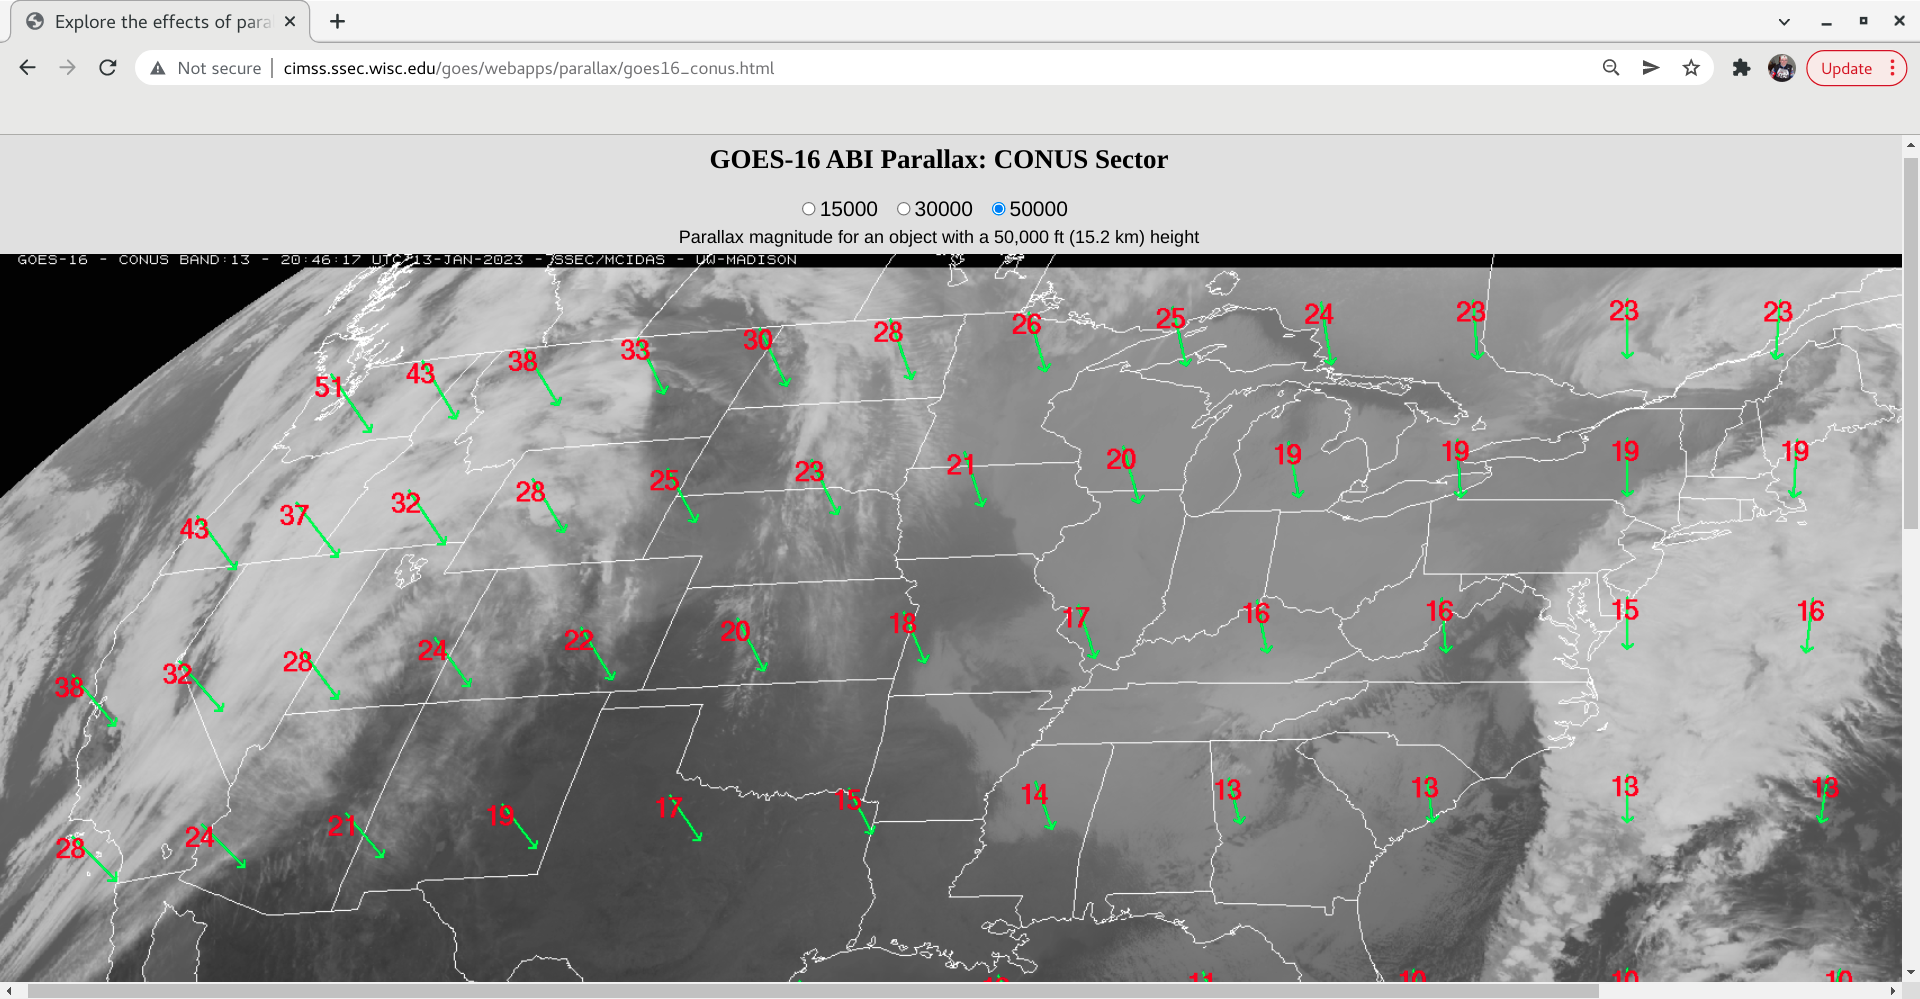
A toggle between Infrared Window images from NOAA-20 VIIRS (11.45 µm) and GOES-16 ABI (10.3 µm) valid at 1843 UTC (below) revealed the 
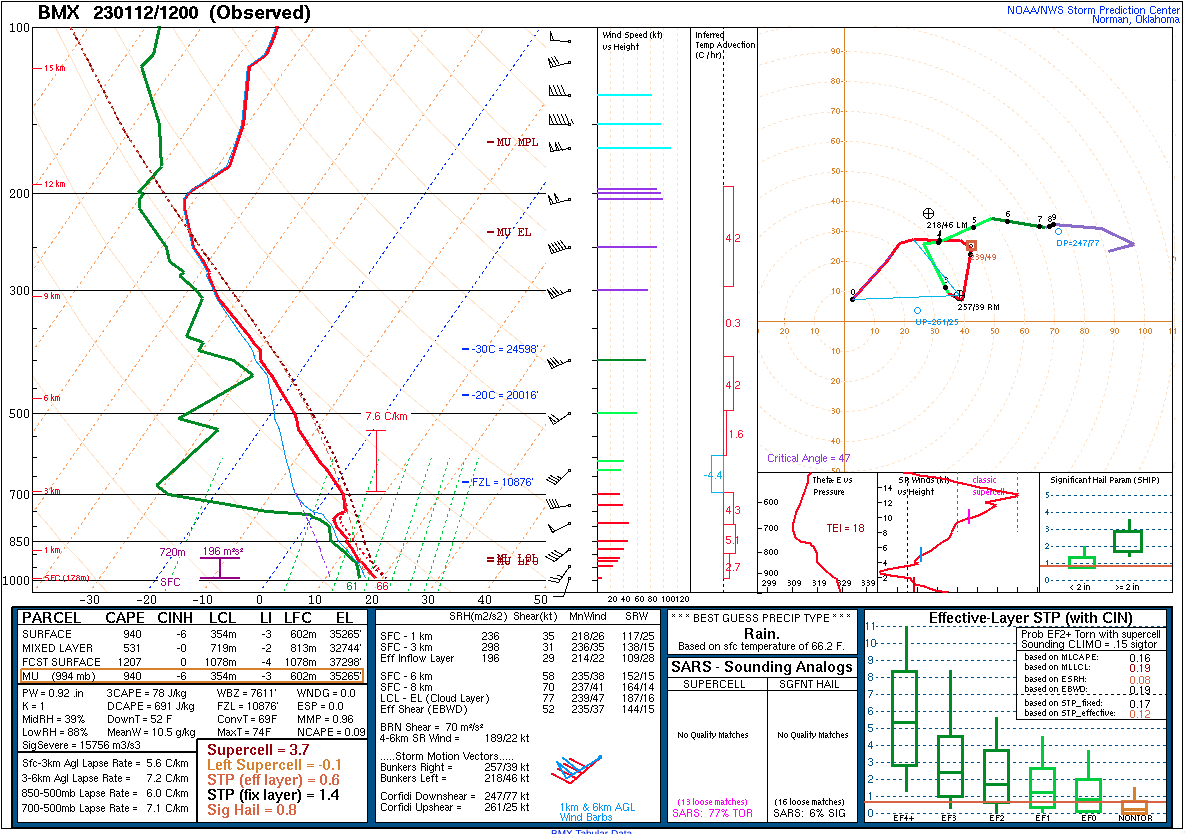
parallax displacement of thunderstorm cloud-top features that is inherent in geostationary imagery (which is dependent on latitude, storm top height and the resulting satellite viewing angle). In this case, there was a north-northwestward parallax offset of about 4 miles (6.4 km) for the Autauga County AACP feature; according to 1200 UTC Birmingham rawinsonde data (source), the -71ºC overshooting top sensed by VIIRS was roughly equivalent to a Most Unstable air parcel altitude near 12.5 km. For a higher-altitude storm top of 15.2 km over Alabama, the GOES-16 parallax offset would be around 13.5 km.

In addition, the cold / warm storm-top thermal couplet sensed by GOES-16 was -65ºC / -55ºC; the multispectral Cloud Top Temperature derived product values were only about 0.7ºC colder.

Infrared Window images from NOAA-20 VIIRS (11.45 µm) and GOES-16 ABI (10.3 µm), valid at 1843 UTC [click to enlarge]

View only this post Read Less

Water Vapor imagery sensing the surface of Hawai’i

GOES-18 (GOES-West) Upper-level Water Vapor (6.2 µm), Mid-level Water Vapor (6.9 µm), Lower-level Water Vapor (7.3 µm) and “Clean” Infrared Window (10.3 µm) images (above) revealed the diurnal cycle of nighttime cooling and daytime warming at the summits of Mauna Kea and Mauna Loa on the Big Island of Hawai’i on 10 January 2023. In addition, a hot thermal... Read More

GOES-18 Upper-level Water Vapor (6.2 µm, upper left), Mid-level Water Vapor (6.9 µm, upper right), Lower-level Water Vapor (7.3 µm, lower left) and “Clean” Infrared Window (10.3 µm, lower right) [click to play animated GIF | MP4]

GOES-18 (GOES-West) Upper-level Water Vapor (6.2 µm), Mid-level Water Vapor (6.9 µm), Lower-level Water Vapor (7.3 µm) and “Clean” Infrared Window (10.3 µm) images (above) revealed the diurnal cycle of nighttime cooling and daytime warming at the summits of Mauna Kea and Mauna Loa on the Big Island of Hawai’i on 10 January 2023. In addition, a hot thermal signature (darker red to black pixels) was evident in the 10.3 µm imagery due to ongoing volcanic activity at Kilauea. This case is another example which helps to underscore the fact that Water Vapor spectral bands are essentially Infrared bands, which — in the absence of clouds — essentially sense the mean temperature of a layer (or layers) of moisture within the troposphere.

The presence of very dry air within most of the middle/upper troposphere over Hawai’i on 10 January had the effect of shifting the water vapor weighting functions to lower altitudes, as seen on plots for the 3 ABI Water Vapor bands calculated using 12 UTC rawinsonde data from Hilo PHTO (below). This allowed thermal radiation from the higher terrain to pass upward — with minimal attenuation — through what little high-altitude moisture was present and reach the 7.3 µm / 6.9 µm / 6.2 µm detectors on GOES-18.

Plots of weighting functions for GOES-18 Water Vapor spectral bands 08 (light brown), 09 (cyan) and 10 (dark brown), calculated using Hilo (PHTO) rawnsonde data at 1200 UTC on 10 January 2023 [click to enlarge]

View only this post Read Less

Widespread fog/stratus over snow cover across the Northern Plains

A sequence of GOES-16 (GOES-East) “Red” Visible (0.64 µm), Day Cloud Phase Distinction RGB and Day Snow-Fog RGB images (above) showed widespread fog/stratus across parts of Montana, North/South Dakota and Minnesota during the day on 06 January 2023. With a quasi-stationary area of high pressure located over that area (surface analyses), winds remained light and the fog/stratus layer was slow... Read More

GOES-16 “Red” Visible (0.64 µm), Day Cloud Phase Distinction RGB and Day Snow-Fog RGB images (with and without hourly observations of Ceiling / Visibility / Surface Weather, plotted in cyan) [click to play MP4 animation | animated GIF]

A sequence of GOES-16 (GOES-East) “Red” Visible (0.64 µm), Day Cloud Phase Distinction RGB and Day Snow-Fog RGB images (above) showed widespread fog/stratus across parts of Montana, North/South Dakota and Minnesota during the day on 06 January 2023. With a quasi-stationary area of high pressure located over that area (surface analyses), winds remained light and the fog/stratus layer was slow to dissipate over much of the region (where snow cover was generally in the 10-20 inch range). The surface visibility was near zero at some sites, with scattered reports of freezing fog and/or light snow.

Plots of rawinsonde data from Bismarck ND (KBIS) and Aberdeen SD (KABR) are shown below — both sites indicated that a strong and moist boundary layer temperature inversion remained in place during the day, which also helped the fog/stratus layer to persist or dissipate rather slowly. Judging from the pressure level of sharp dew point decreases, these fog/stratus features were confined to altitudes of 1200-1400 meters (3900-5000 feet) or lower.

Plots of rawinsonde data from Bismarck, North Dakota [click to enlarge]

 Plots of rawinsonde data from Aberdeen, South Dakota [click to enlarge]

GOES-16 Day Snow-Fog RGB images at 1901 UTC, with an overlay of the corresponding CLAVRx and Operational versions of the Cloud Top Height derived product; cursor-sampled Cloud Top Height values at Bismarck ND are shown [click to enlarge]

GOES-16 Day Snow-Fog RGB images at 1901 UTC — with an overlay of the corresponding CLAVR-x and Operational versions of the Cloud Top Height (CTH) derived product — include cursor-sampled those two Cloud Top Height values at Bismarck ND (above) and Aberdeen SD (below). It would appear that the 10-km resolution Operational CTH values were unrealistically high — which can often occur over areas with snow cover — compared to the 2-km resolution CLAVR-x CTH values (the full-resolution CLAVR-x products are produced at CIMSS).

GOES-16 Day Snow-Fog RGB image at 1901 UTC, with an overlay of the corresponding CLAVRx and Operational versions of the Cloud Top Height derived product; cursor-sampled Cloud Top Height values at Aberdeen SD are shown [click to enlarge]

A comparison of GOES-16 Day Snow-Fog RGB image, CLAVRx Cloud Top Height and Operational Cloud Top Height derived products at 1901 UTC is shown below.

GOES-16 Day Snow-Fog RGB, CLAVRx Cloud Top Height and Operational Cloud Top Height at 1901 UTC [click to enlarge]

View only this post Read Less