This website works best with a newer web browser such as Chrome, Firefox, Safari or Microsoft
Edge. Internet Explorer is not supported by this website.
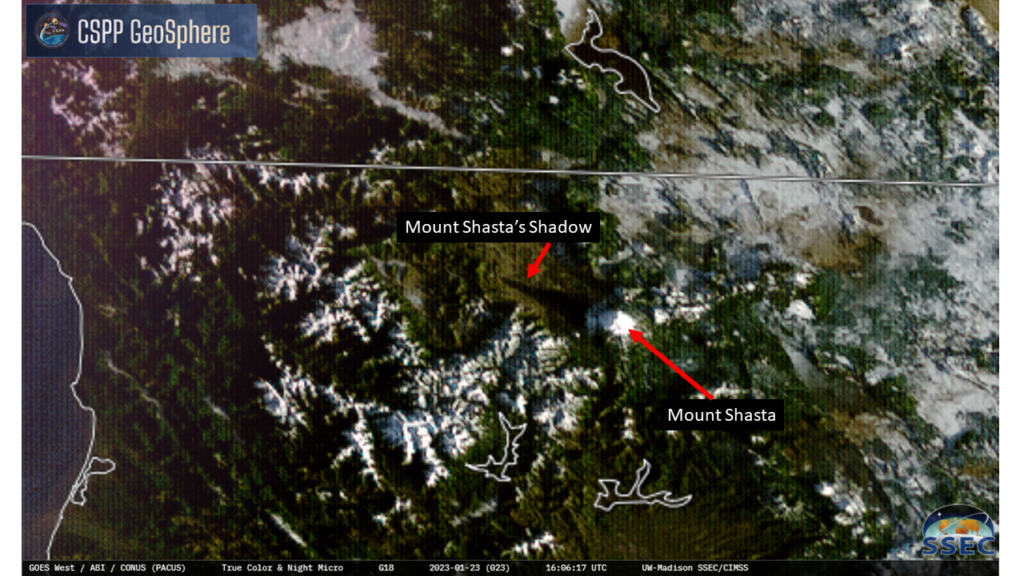
Northern California enjoyed a clear day on 23 January, and the animation above, from the CSPP Geosphere site, (click here for a direct — but not permanent — link to the animation) shows the shadow of Mount Shasta (see the still image below identifying both the mountain and the shadow) shortening over... Read More
CSPP Geosphere GOES-18 True Color Imagery, 1541 – 1946 UTC on 23 January 2023
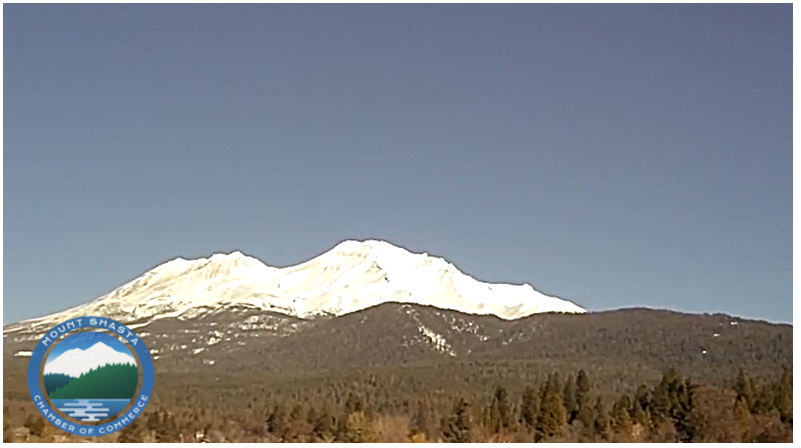
Northern California enjoyed a clear day on 23 January, and the animation above, from the CSPP Geosphere site, (click here for a direct — but not permanent — link to the animation) shows the shadow of Mount Shasta (see the still image below identifying both the mountain and the shadow) shortening over the course of the morning. Note that clouds are also present around the mountain peak as well, although this webcam screen capture from 2100 UTC (source) shows only clear skies. Also of interest in the animation above: the sloshing of the low clouds within the valleys of southern Oregon.
CSPP Geosphere GOES-18 (PACUS) imagery at 1606 UTC on 23 January 2023 (Click to enlarge)
Click here and here for similar blog posts on the shadow of Denali. Thanks to Mike Stavish, SOO at WFO MFR for drawing our attention to this event.
Monthly means of full disk GOES-17 brightness temperatures1 for Bands 8, 10, and 13 have been computed from 2019 to 2021, totaling 36 months. This is an expansion of similar work that had been done for Band 13 for a single year. Band 8, centered on... Read More
Monthly means of full disk GOES-17 brightness temperatures1 for Bands 8, 10, and 13 have been computed from 2019 to 2021, totaling 36 months. This is an expansion of similar work that had been done for Band 13 for a single year. Band 8, centered on 6.2 µn, is sensitive to upper-level water vapor. While Band 10, centered on 7.3 µn, is sensitive to low-level water vapor. Band 13 is the clean longwave infrared window channel and observes at 10.3 µn.
Brightness temperature can be thought of as the amount energy (radiance) being reflected or emitted from Earth and measured by satellite sensors. These fields of averaged brightness temperature are useful for assisting forecasters in knowing what can be expected from satellite retrievals on monthly timescales, especially in remote Pacific regions where forecasters are heavily reliant on satellite data.
Monthly averages of Band 8 ABI brightness temperature (click animation to open in new tab).
Monthly averages of Band 10 ABI brightness temperature (click animation to open in new tab).
Monthly averages of Band 13 ABI brightness temperature (click animation to open in new tab).
While a large amount of smoothing is expected for a monthly average, the resulting full disk fields are not homogenous. Certain patterns appear. The ITCZ is noticeable. Also, an area of warmer brightness temperature is visible west of Hawaii during winter months in the animations for Bands 8 and 10. This is likely associated with a synoptic high pressure for that region.
Reference to a Climatic Atlas created by Sadler et al. (1987) from the School of Ocean and Earth Science and Technology confirms potential for a synoptic high pressure region that is usual for that time of year. However, because the Sadler fields are derived surface measurements (temperature, pressure, wind, and stress), comparing them to GOES-17 ABI brightness temperatures is not exactly an “apples to apples” situation.
1 Brightness temperatures are computed from radiances.
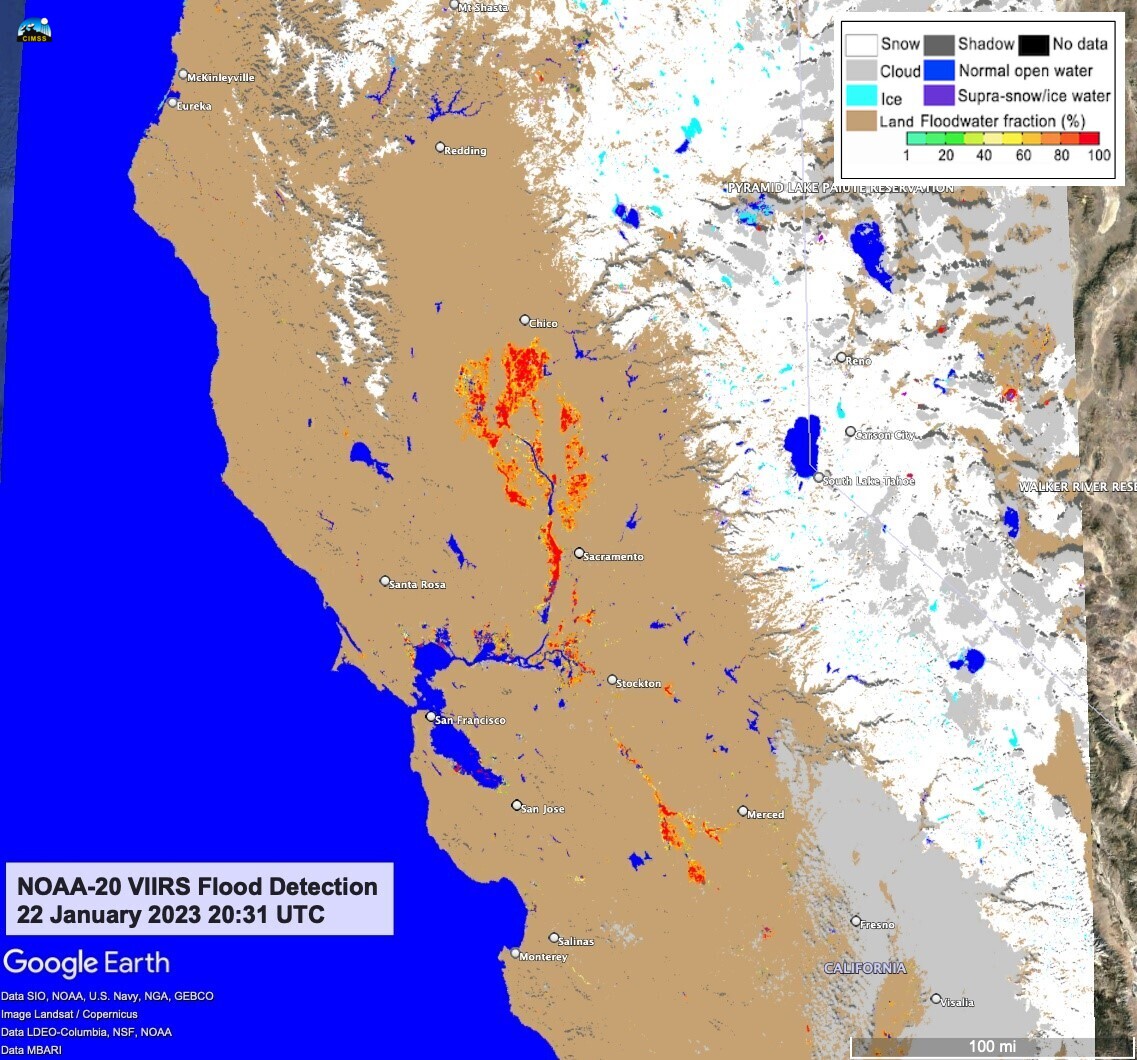
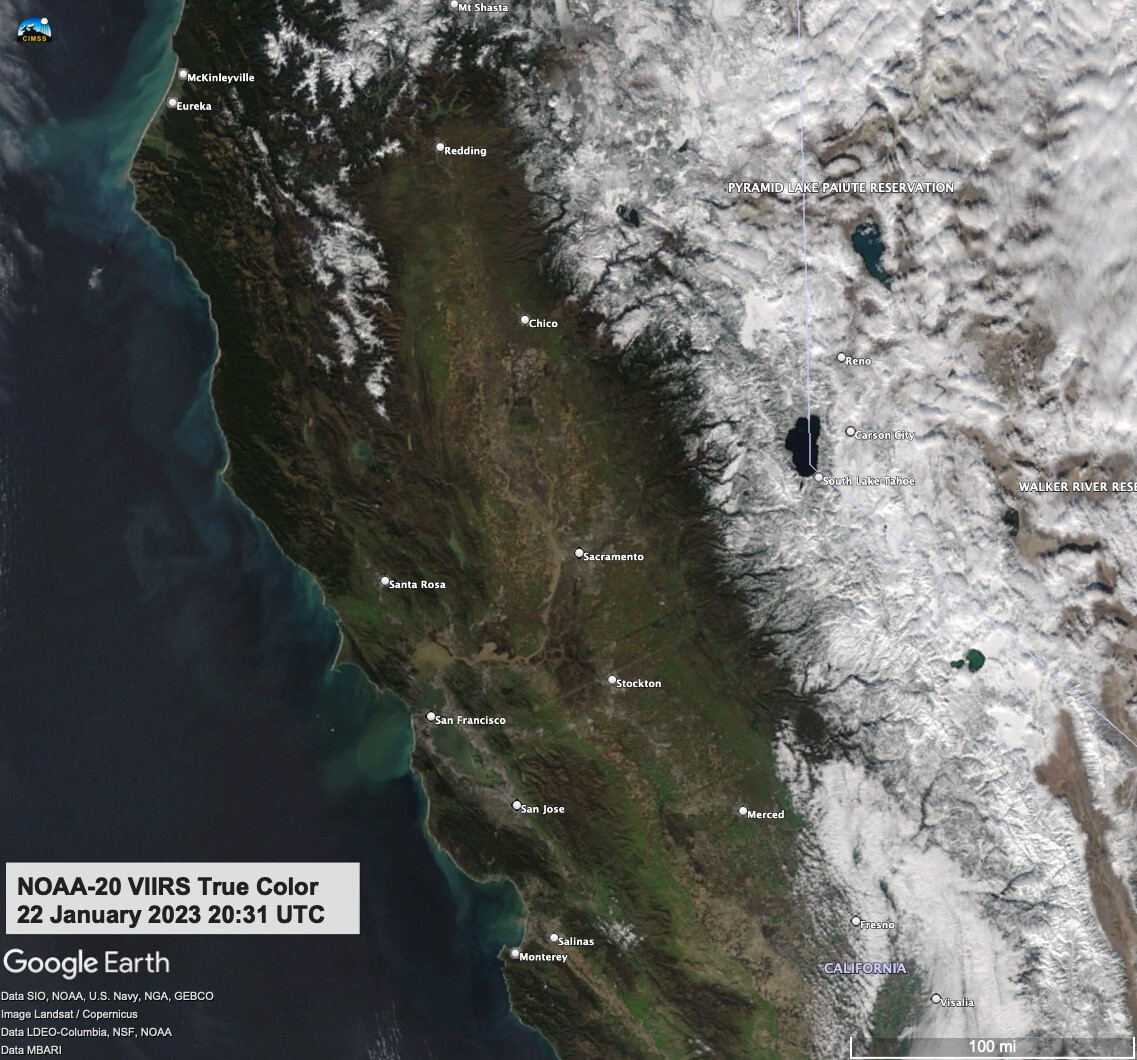
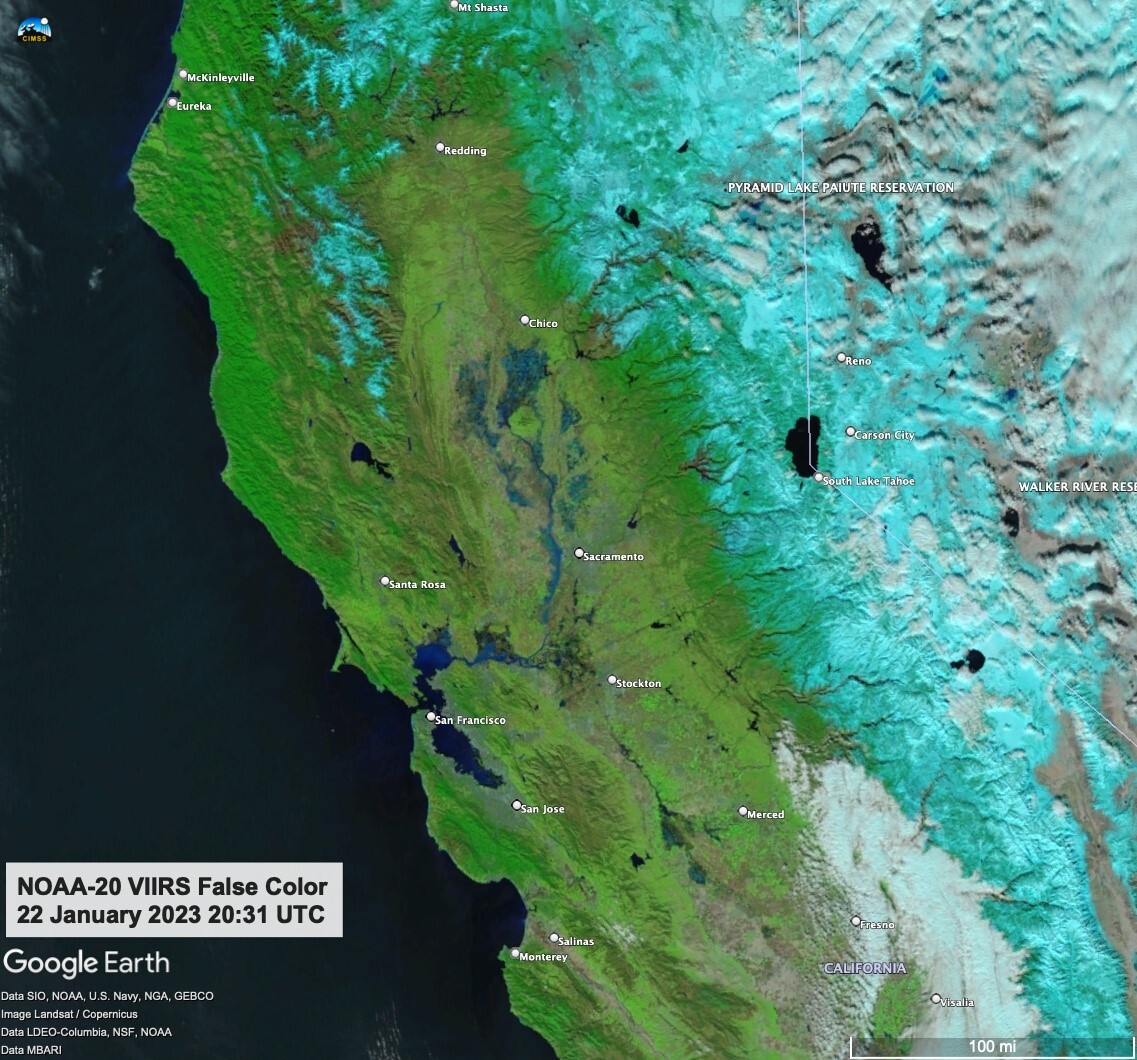
NOAA-20 VIIRS True Color, False Color, and Flood Detection, 2031 UTC on 22 January 2023 (Click to enlarge)
The Community Software Processing Package (CSPP) includes Flood Detection algorithms that can be applied to VIIRS data at Direct Broadcast sites (such as at CIMSS). The daytime NOAA-20 orbit over California on 22 January 2023 overflew mostly clear skies, resulting in the True Color and False Color imagery shown above, and the diagnosed regions of floods, mainly in the Sacramento and San Joaquin River basins. Note that flooding in these two river basins can also be a result of agricultural diversions to support rice farming. So a good question is: Was the water put there intentionally — or did it flood? The modest flood signal in the Salinas River basin (south and east of Salinas) is more likely actual flooding.
These images were created using geotiff images from CSPP that were inserted into Google Earth and are courtesy Kathy Strabala, SSEC/CIMSS. VIIRS flood imagery (including imagery displayed in concert with ABI and AHI data) are also available here.
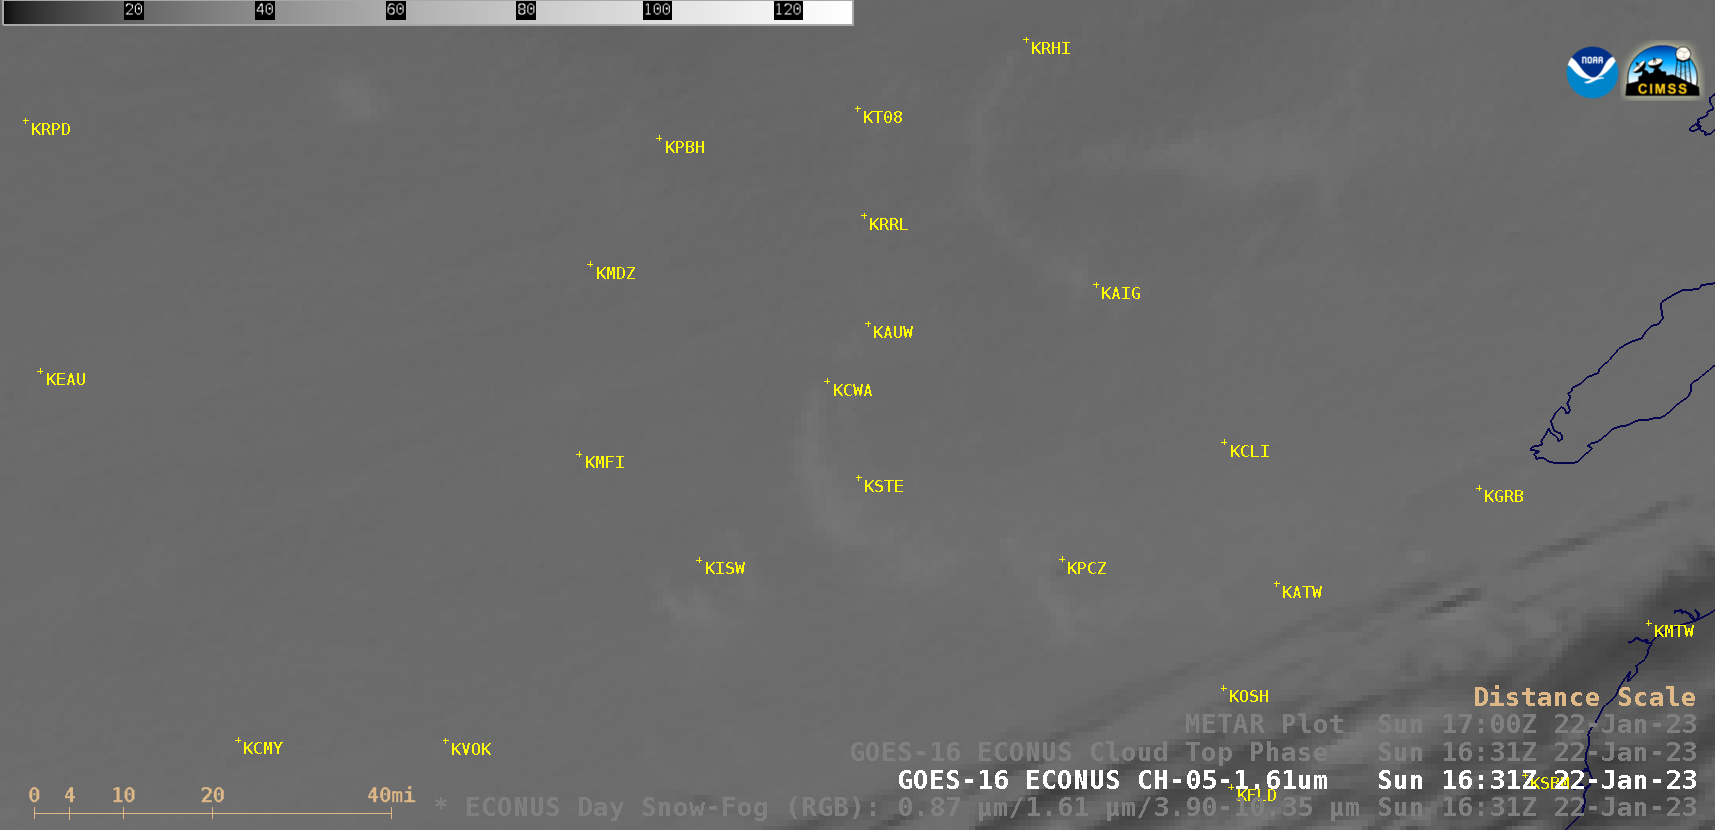
GOES-16 (GOES-East) Near-Infrared “Snow/Ice” (1.61 µm) images (above) displayed industrial plumes (from sources such as power plants) that produced brief periods of light snow as they drifted over a few sites in northern Wisconsin on 22 January 2023. Particles emitted from industrial stacks acted as cloud condensation nuclei, “seeding” the surrounding supercooled water cloud... Read More
GOES-16 Near-Infrared “Snow/Ice” (1.61 µm) images, with and without plots of hourly surface reports [click to play animated GIF | MP4]
GOES-16 (GOES-East) Near-Infrared “Snow/Ice” (1.61 µm) images (above) displayed industrial plumes (from sources such as power plants) that produced brief periods of light snow as they drifted over a few sites in northern Wisconsin on 22 January 2023. Particles emitted from industrial stacks acted as cloud condensation nuclei, “seeding” the surrounding supercooled water cloud droplets which then created a higher concentration of smaller cloud droplets — and these smaller cloud droplets were more efficient reflectors of incoming solar radiation, making the plumes appear slightly brighter than the surrounding clouds.
GOES-16 Day Snow-Fog RGB images (below) provided a bit more cloud-top contrast, helping to slightly enhance the appearance of the industrial plumes.
GOES-16 Day Snow-Fog RGB images, with and without plots of hourly surface reports [click to play animated GIF | MP4]


