This website works best with a newer web browser such as Chrome, Firefox, Safari or Microsoft
Edge. Internet Explorer is not supported by this website.
JMA’s AHI imagery, using the CIMSS Natural Color composite, for three times on August 21, 2024.
A similar mp4 animation as above, but a quicker animation speed.
JMA’s AHI imagery, using the CIMSS Natural Color composite, for 04:20 UTC August 21, 2024.JMA’s AHI full disk imagery, using the CIMSS Natural Color composite, for 04:20 UTC August 21, 2024.
Himawari-9 imaged more than just clouds over the southern Pacific Ocean when the recently full moon peeked out from behind Earth. pic.twitter.com/eXPKt4rN2I
While the GOES-R ABI series also scans the moon when it is near the Earth, only the remapped (to the Earth) pixels are distributed as part of the rebroadcast data. Special processing from Level 0 data is needed to see the off Earth edge pixels with ABI. GOES-1 through GOES-15 imagers did allow to sometimes see the moon off the Earth. Examples from GOES-8, GOES-12, and GOES-13.
H/T
Thanks to JMA for the AHI data (via NESDIS/STAR) and the UW/SSEC Data Services. McIDAS-X was used for these image combinations. T. Schmit works for NOAA/NESDIS/STAR and is stationed in Madison, WI.
GOES-18 True-Color imagery, above, from the CSPP Geosphere website (link to animation above), shows convection moving over northeastern Wyoming, leaving in its wake a series of smoke plumes: wildfires caused by lightning. The screenshots below were captured from the Real Earth instance of NGFS imagery (link), and they show LightningCast probability and Flash... Read More
GOES-18 CONUS imagery over northeastern Wyoming, 1426 UTC 21 August 2024 – 0111 UTC 22 August 2024
GOES-18 True-Color imagery, above, from the CSPP Geosphere website (link to animation above), shows convection moving over northeastern Wyoming, leaving in its wake a series of smoke plumes: wildfires caused by lightning. The screenshots below were captured from the Real Earth instance of NGFS imagery (link), and they show LightningCast probability and Flash Extent Density as well as NGFS Fire Detections.
The image below, for 1550 UTC, includes large LightningCast probabilities (and observed Flash Extent Density) from GOES-East. These features are moving northeastward through Wyoming as shown in the animation above.
RealEarth display of LightningCast, Flash Extent Density and GOES-16 shortwave infrared (Band 7, 3.9 µm) imagery, ca. 1550 UTC on 21 August 2024 (Click to enlarge)
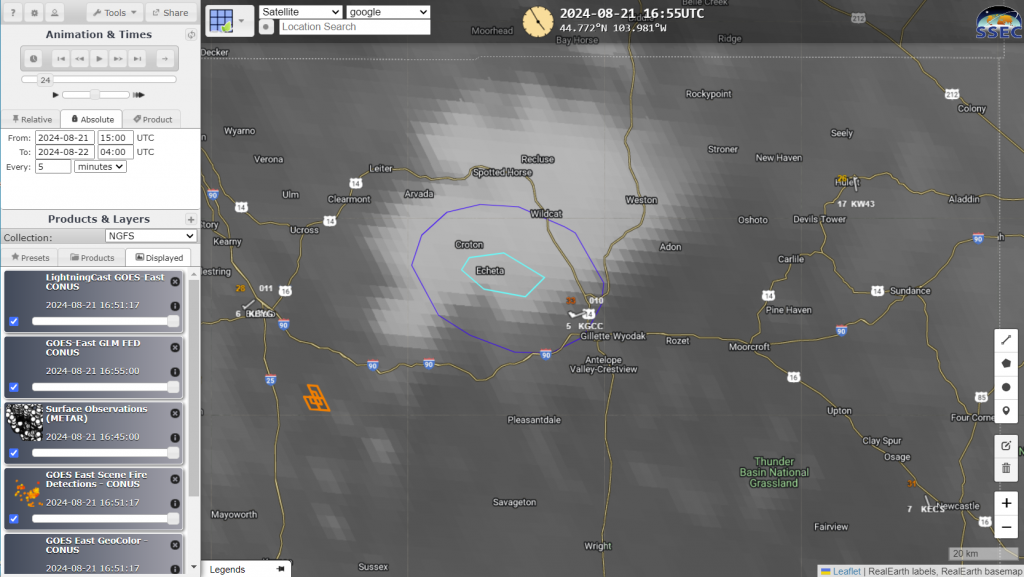
At 1655 UTC, below, the convection has moved into extreme northeast Wyoming. NGFS fire pixels are shown in the wake of the departing convection: dry thunderstorms appear to have initiated a fire (this is the House Draw fire). Lightning Probabilities continue to be enhanced with the convection.
RealEarth display of LightningCast, and GOES-16 shortwave infrared (Band 7, 3.9 µm) imagery, ca. 1655 UTC on 21 August 2024 (Click to enlarge)
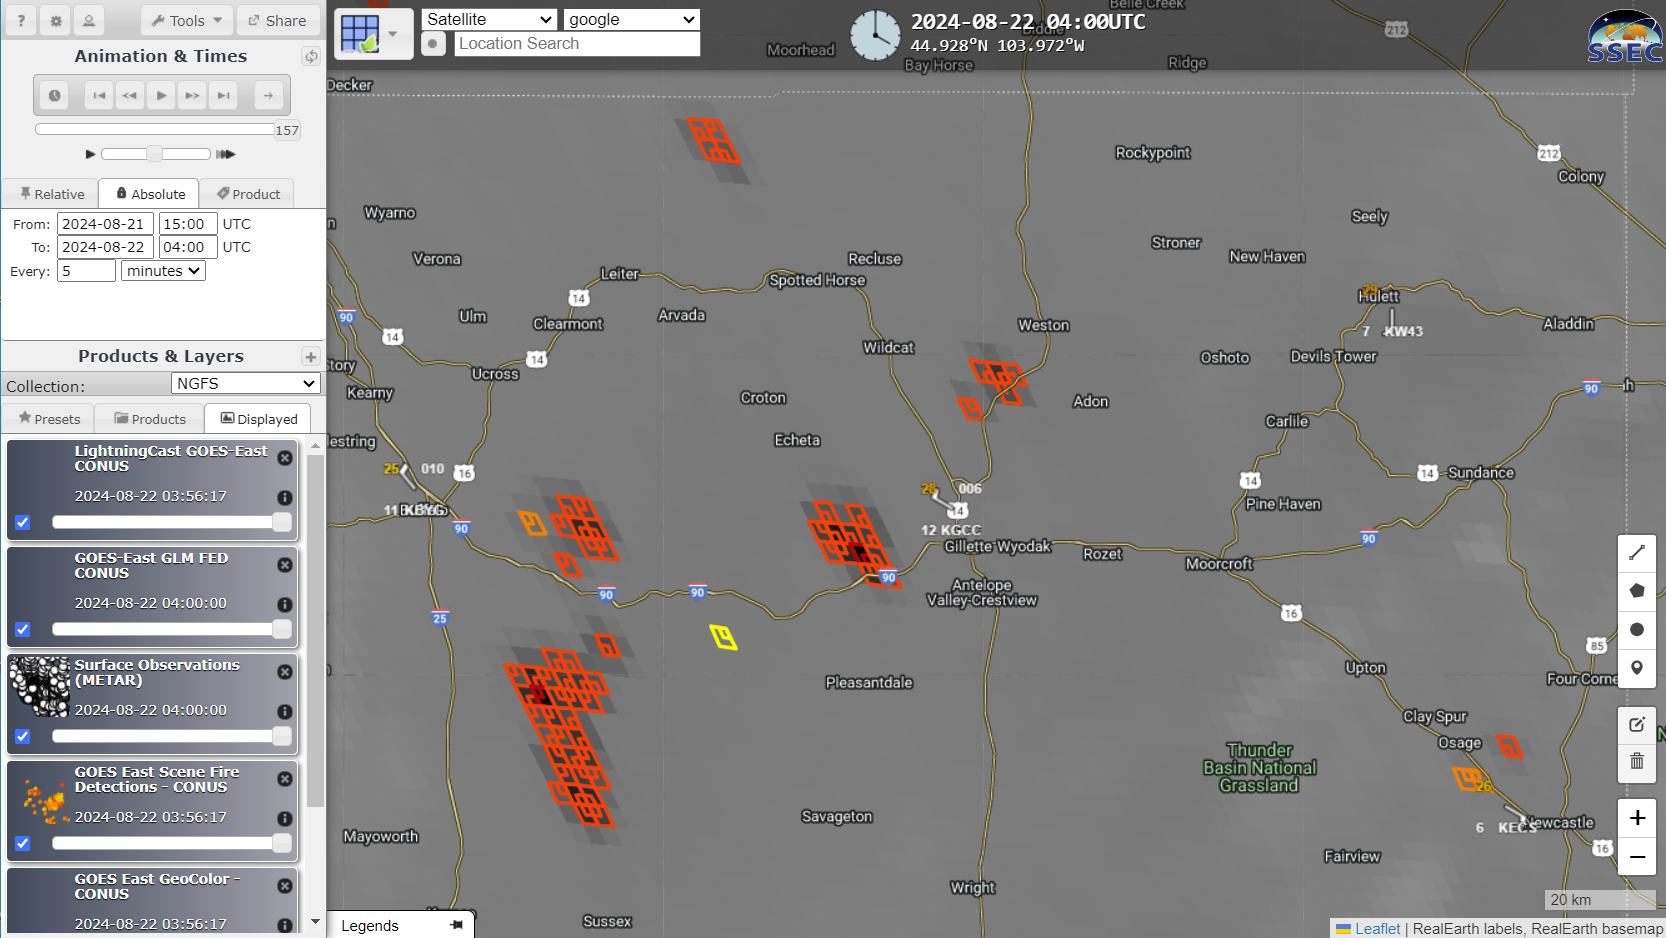
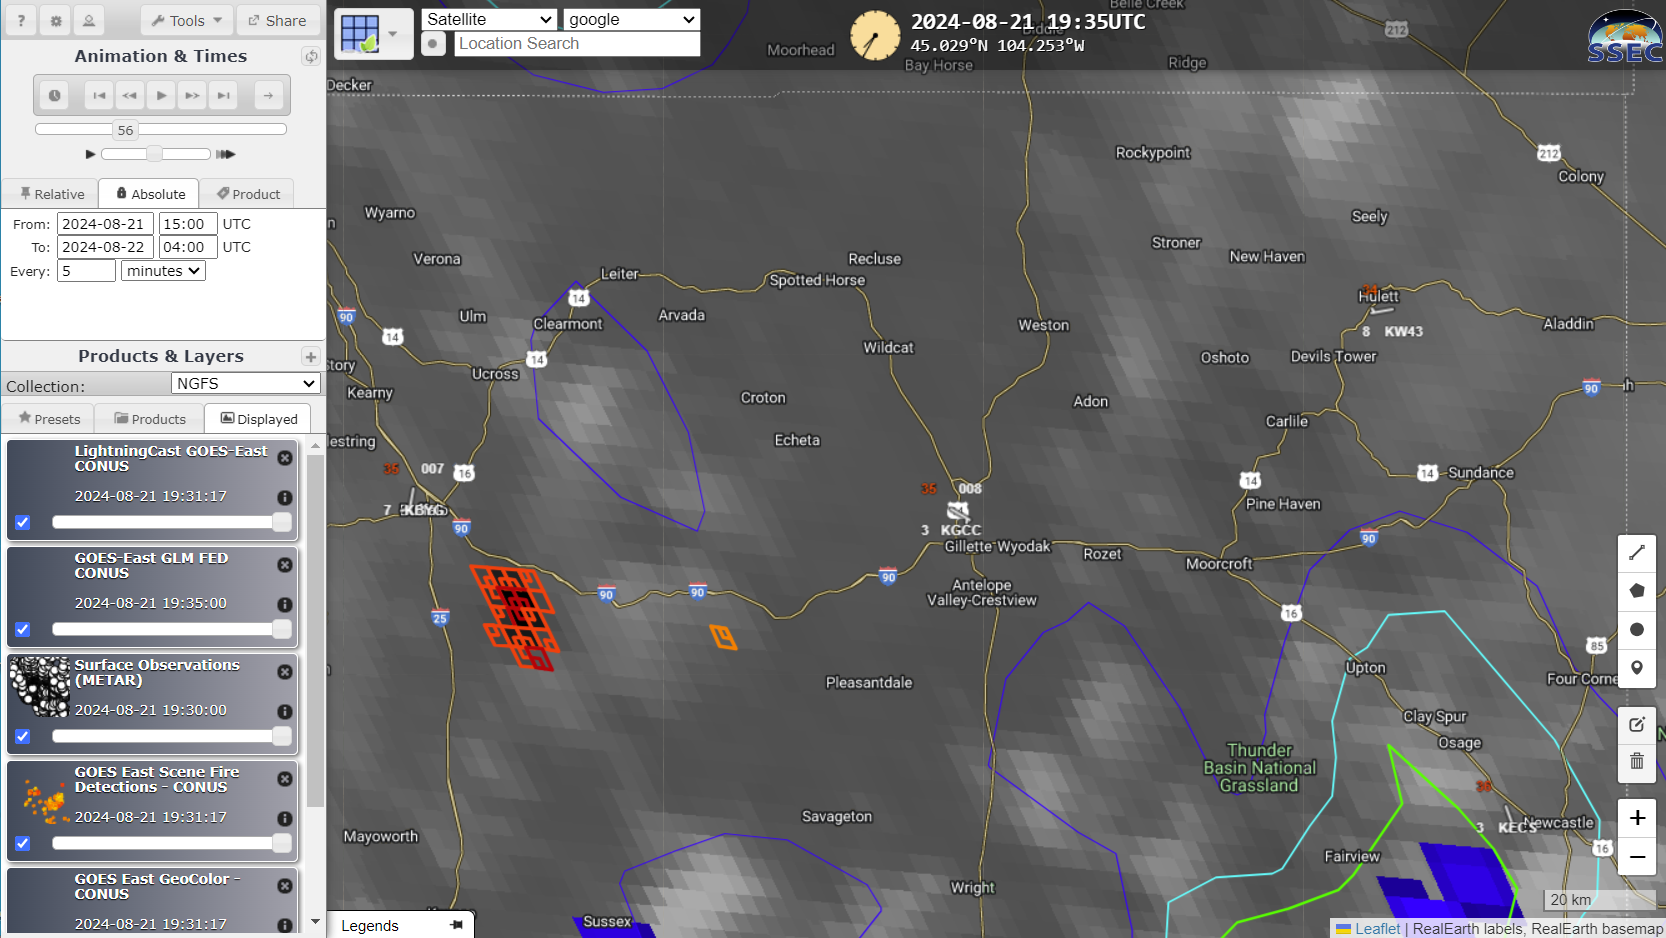
Convection continues later in the day on the 21st, as shown in the series of images below: 1935 UTC and 2225 UTC on 21 August, and 0000 and 0400 UTC on 22 August. By 0400 UTC on 22 August, most of the convection has moved northeast of Wyoming, leaving behind a series of wildfires as indicated by the NGFS detections. The largest of these was the House Draw fire. Notice how quickly the area consumed by the House Draw fire is expanding.
RealEarth display of GOES-16 LightningCast, Flash Extent Density, and shortwave infrared (Band 7, 3.9 µm) imagery, ca. 1935 UTC on 21 August 2024; NGFS fire pixels are also shown (Click to enlarge)RealEarth display of GOES-16 LightningCast, Flash Extent Density, and shortwave infrared (Band 7, 3.9 µm) imagery, ca. 2225 UTC on 21 August 2024; NGFS fire pixels are also shown (Click to enlarge)RealEarth display of GOES-16 LightningCast, Flash Extent Density, and shortwave infrared (Band 7, 3.9 µm) imagery, ca. 0000 UTC on 22 August 2024; NGFS fire pixels are also shown (Click to enlarge)RealEarth display of GOES-16 LightningCast, Flash Extent Density, and shortwave infrared (Band 7, 3.9 µm) imagery, ca. 0400 UTC on 22 August 2024; NGFS fire pixels are also shown (Click to enlarge)
This example of convection-induced fires shows why LightningCast probabilities are included in the NGFS RealEarth displays!
This fire was also discussed on the Satellite Liaison Blog here. Note that this fire also included a Fire Weather Warning issuance from WFO Riverton in collaboration with local Emergency Managers.
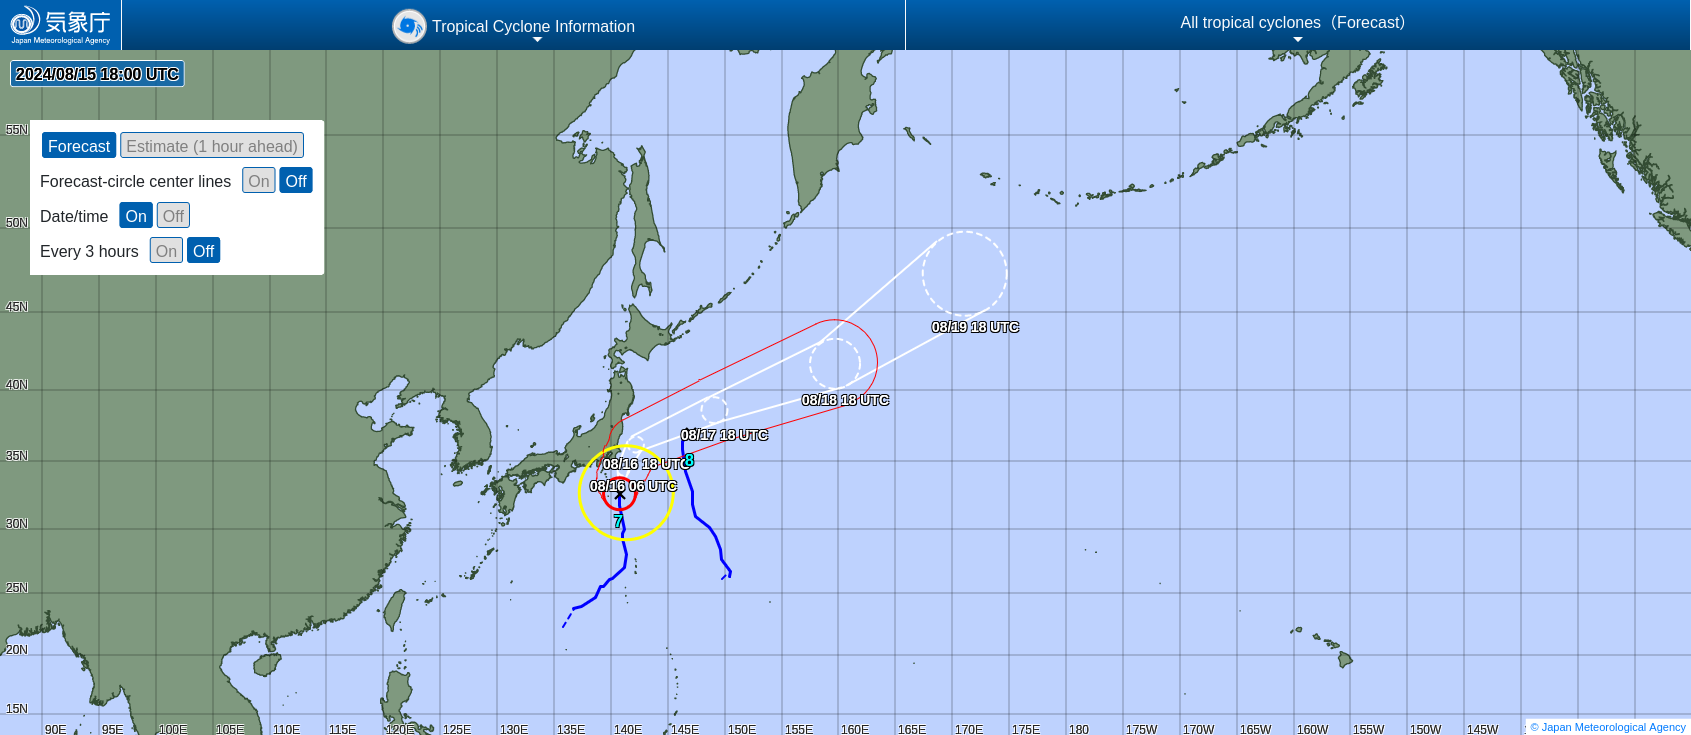
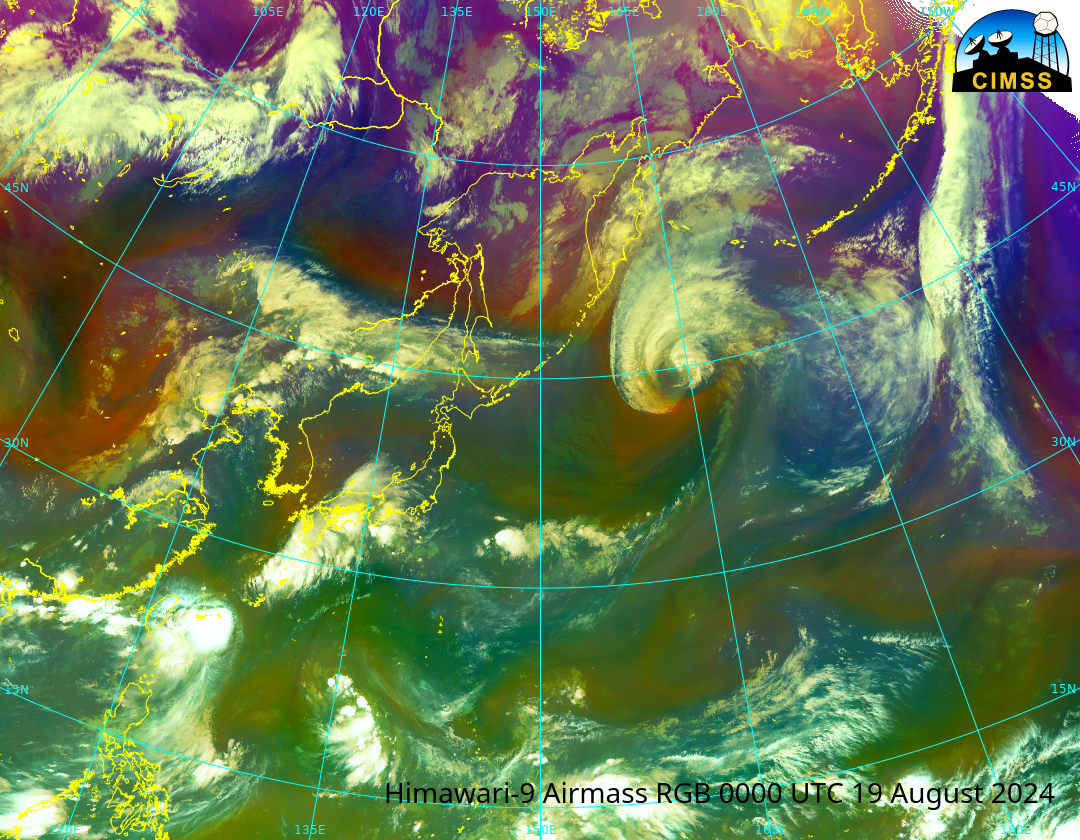
Himawari-9 airmass RGB imagery, above, shows the extratropical transition of Typhoon Ampil. At the beginning of the animation, the typhoon is approaching Japan from the south. By 0000 UTC on 17 August, the typhoon has moved east of Japan, and a Potential Vorticity anomaly just west of the storm (identifiable by the orange hue... Read More
Himawari-9 airmass RGB, 0000 UTC 15 August – 0100 UTC 21 August 2024
Himawari-9 airmass RGB imagery, above, shows the extratropical transition of Typhoon Ampil. At the beginning of the animation, the typhoon is approaching Japan from the south. By 0000 UTC on 17 August, the typhoon has moved east of Japan, and a Potential Vorticity anomaly just west of the storm (identifiable by the orange hue in the RGB) suggests the storm is starting to become extratropical. By 0000 UTC on 19 August, a second mid-tropospheric potential vorticity anomaly (also identifiable by its orange hue in the RGB), is moving over Kamchatka and the Kuril Islands just west of the evolving typhoon and being incorporated into the storm. Airmass RGBs are a useful product in highlighting the possibility of a rapid transition of typhoons to a strong extratropical storm (another example is 2022’s Typhoon Merbok).
Merbok was a very intense storm after it became extratropical, far stronger and damaging than Ampil. One notable difference between the two storms was the connection between the storms and tropical moisture. MIMIC Total Precipitable Water fields for Merbok, below, at 1200 UTC on 14-15 September 2022 (source), show a connection to the rich moisture of the Intertropical Convergence Zone (a MIMIC TPW animation is also available here, from this blog post). That direct connection is missing for Ampil, and might be one of many reasons for the differences in extratropical storm strength.
Global estimates of Total Precipitable Water, 1200 UTC on 14 and 15 September 2022 (Click to enlarge). Typhoon Merbok is near 30 N Latitude, 165 E Longitude on 14 SeptemberGlobal estimates of Total Precipitable Water, 1200 UTC on 18 and 19 August 2024 (Click to enlarge). Typhoon Ampil is near 40 N Latitude, 165 E Longitude on 18 August
Thanks to Eddie Zingone, WFO ANC for mentioning Ampil’s extratropical transition on a telecon this week!
Typhoon Ampil was at the northern edge of the view of the Direct Broadcast antenna at the forecast office on Guam, and CSPP software processed the above images (courtesy Douglas Schumacher) showing the ample eye of the Typhoon. Microwave imagery suggests an eyewall that is not quite complete, especially on... Read More
Processed Direct Broadcast Imagery of Ampil from NOAA-19, 1152 UTC on 15 August 2024; 157 GHz and 10.8 um imagery
Typhoon Ampil was at the northern edge of the view of the Direct Broadcast antenna at the forecast office on Guam, and CSPP software processed the above images (courtesy Douglas Schumacher) showing the ample eye of the Typhoon. Microwave imagery suggests an eyewall that is not quite complete, especially on the western side. MIMIC imagery below (from here) suggests an incomplete eyewall as well.
MIMIC-TC animation, 0000 – 1745 UTC on 15 August 2024 (Click to enlarge)
Hourly imagery from 1140 (just after the NOAA-19 overpass shown above) through 1840 UTC show cold cloud tops not quite continuously encircling Ampil’s eye. The GK2A imagery below was created using geo2grid imagery and level-1b GK2A data from KMA.
GK2A Clean Window infrared (Band 13, 10.5 µm) imagery, hourly from 1140 to 1840 UTC on 15 August 2024 (Click to enlarge)


