This website works best with a newer web browser such as Chrome, Firefox, Safari or Microsoft
Edge. Internet Explorer is not supported by this website.
GOES-East airmass RGB imagery, above, shows the evolution of a strong system that brought heavy rain to the central United States as well as snow over the western Great Lakes. The Potential Vorticity Anomaly that supported the surface cyclone, orange in the RGB shown above, starts over the Rocky Mountains and moves... Read More
GOES-16 Air Mass RGB, every 30 minutes from 1216 UTC 30 October – 0016 UTC 1 November 2024 (Click to enlarge)
GOES-East airmass RGB imagery, above, shows the evolution of a strong system that brought heavy rain to the central United States as well as snow over the western Great Lakes. The Potential Vorticity Anomaly that supported the surface cyclone, orange in the RGB shown above, starts over the Rocky Mountains and moves northeastward to the northern Plains before shifting more eastward across the Great Lakes at the end of the animation. Total Precipitable water fields from MIMIC, below (archived here), show the deep moisture drawn northward from the Gulf of Mexico that the system could access. Madison, WI, set a daily record rainfall — 2.21″ — on 30 October. You might also infer deep moisture in the airmass RGB where the field is a deep green color.
Hourly estimates of Total Precipitable Water from microwave data, 0000 UTC 30 October – 0000 UTC 1 November 2024 (Click to enlarge)
The images below compare GFS pressures on the 2 PVU surface (source) to the airmass RGB fields at the same time. There is good (but not perfect) spatial agreement between the modeled initial pressure maximum on the 2 PVU surface (that is, a lowered tropopause associated with the Potential Vorticity Anomaly) and the orange-hued region in the airmass RGB.
Pressure on the 2 PVU surface (left) and GOES-East airmass RGB (right), 06, 12 and 18 UTC on 31 October 2024 (Click to enlarge)
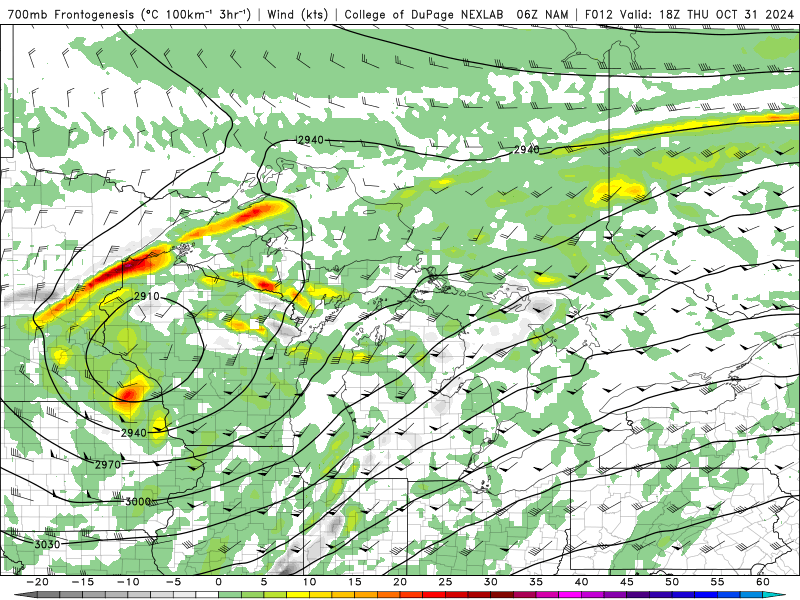
GOES Imagery with its excellent temporal resolution is what a forecaster is going to use to monitor the evolution of a system. Polar Orbiter data offers unique fields that aren’t really available from basic GOES imagery. Suomi-NPP overflew the region and Microwave-derived estimates of rain rate are shown below (the data are mislabeled as coming from NOAA-20) in a toggle with various GOES-16 bands at the same time. The band of heavier precipitation is associated with strong low-level frontogenesis (here is a 12-h NAM forecast of 700-mb Frontogenesis — source — at 1800 UTC on 31 October). In the toggle below, one of the Band 13 images has been rescaled to allow the display to use the entire color bar. It is time to make that adjustment in the upper midwest as very cold cloud tops that accompany strong convection are not likely until next Spring!
GOES-16 bands 2, 13, 10 and 8 showing visible and infrared imagery (0.64 µm, 10.3 µm, 7.3 µm and 6.19 µm, respectively) toggled with ATMS estimates of Rain Rate, 1846 UTC on 31 October 2024 (Click to enlarge)
GOES data can also be used to estimate rain rate. In addition to the level 2 rain rate product, GREMLIN (GOES Radar Estimation via Machine Learning to Inform Numerical Modeling), which field is shown below in a toggle with ATMS estimates of Rain Rate from NOAA-20 (as labeled this time), is available. There is excellent agreement between the two estimates especially regions of heavier precipitation.
NOAA-20 estimates of Rain Rate from ATMS data, and GOES-16 GREMLIN estimates of radar reflectivity, ca. 1920 UTC on 31 October 2024 (Click to enlarge)
Microwave data can also give snowfall estimates, as displayed at this website. Estimates from a variety of Low Earth Orbit (LEO) satellites that have Microwave Sounders on board are shown below for times between 1500 and 1900 UTC on 31 October 2024.
Instantaneous snowfall rates from Microwave Sounders, 1532-1917 UTC on 31 October 2024, Satellite as indicated (Click to enlarge)
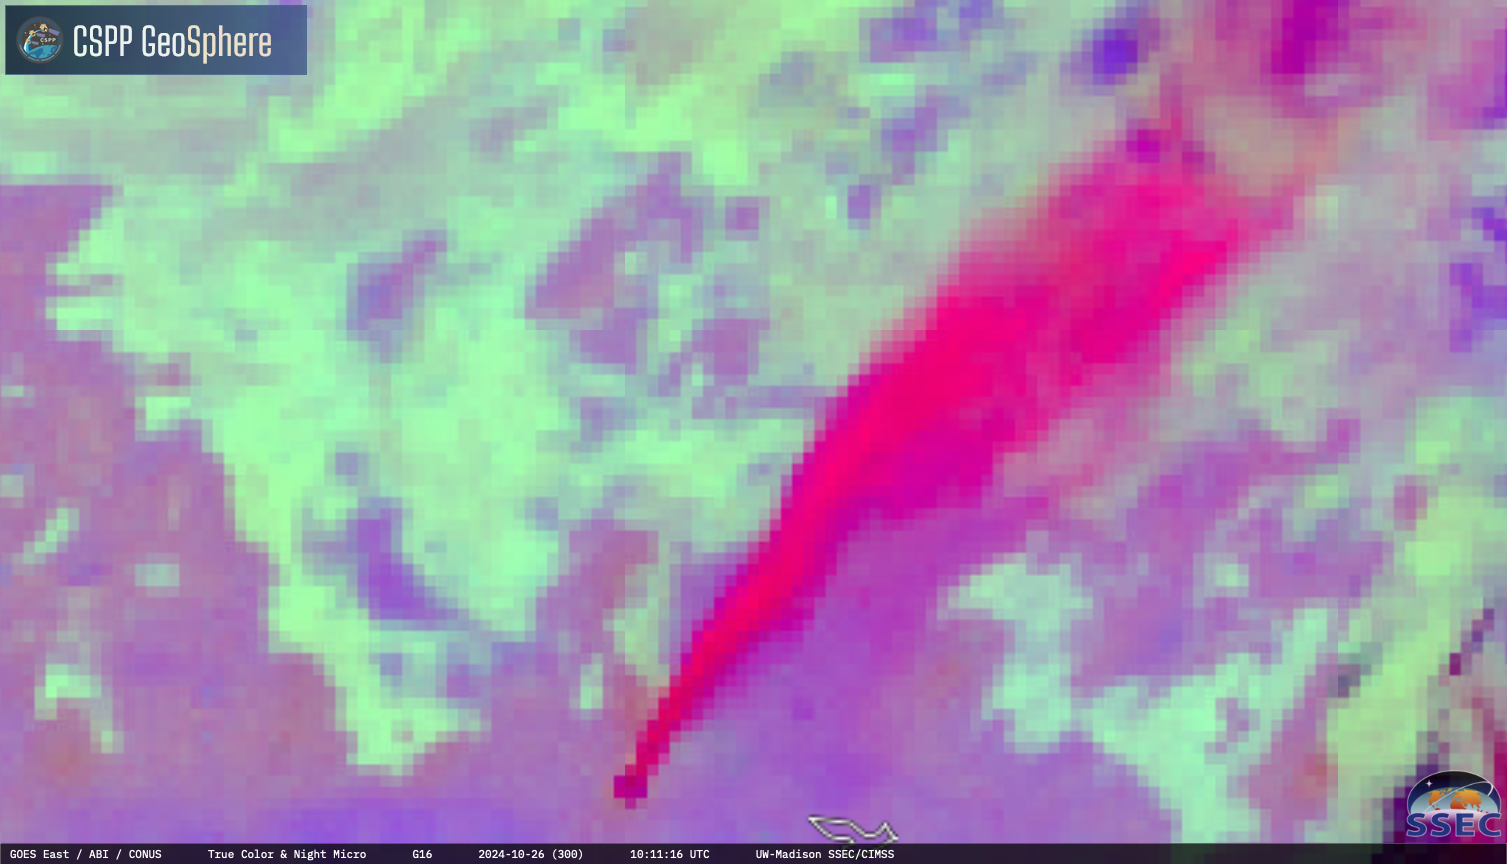
A prolonged eruptive period of Popocatépetl occurred during 23-30 October 2024. An animation of GOES-16 (GOES-East) Nighttime Microphysics RGB + daytime True Color RGB images from the CSPP GeoSphere site (above) displayed the volcanic plumes — which often exhibited brighter shades of magenta at night, and a hazy appearance during the day —... Read More
GOES-16 Nighttime Microphysics RGB + daytime True Color RGB images, 23-30 October [click to play MP4 animation]
A prolonged eruptive period of Popocatépetl occurred during 23-30 October 2024. An animation of GOES-16 (GOES-East)Nighttime Microphysics RGB + daytime True Color RGB images from the CSPP GeoSphere site (above) displayed the volcanic plumes — which often exhibited brighter shades of magenta at night, and a hazy appearance during the day — during its multiple eruptive phases (the most robust of which began around 1631 UTC on 25 October).
Preliminary/non-operational GOES-19 Ash RGB images (below) also showed the periodic pulses of ash from Popocatépetl.
GOES-19 Ash RGB images, 22-30 October (courtesy Tim Schmit, NOAA/NESDIS/STAR) [click to play MP4 animation]
A radiometrically-retrieved Ash Height product from the NOAA/CIMSS Volcanic Cloud Monitoring site (below) showed that the volcanic plume occasionally reached altitudes of 12 km or greater (magenta).
GOES-16 Ash Height product, 23-30 October [click to play MP4 animation]
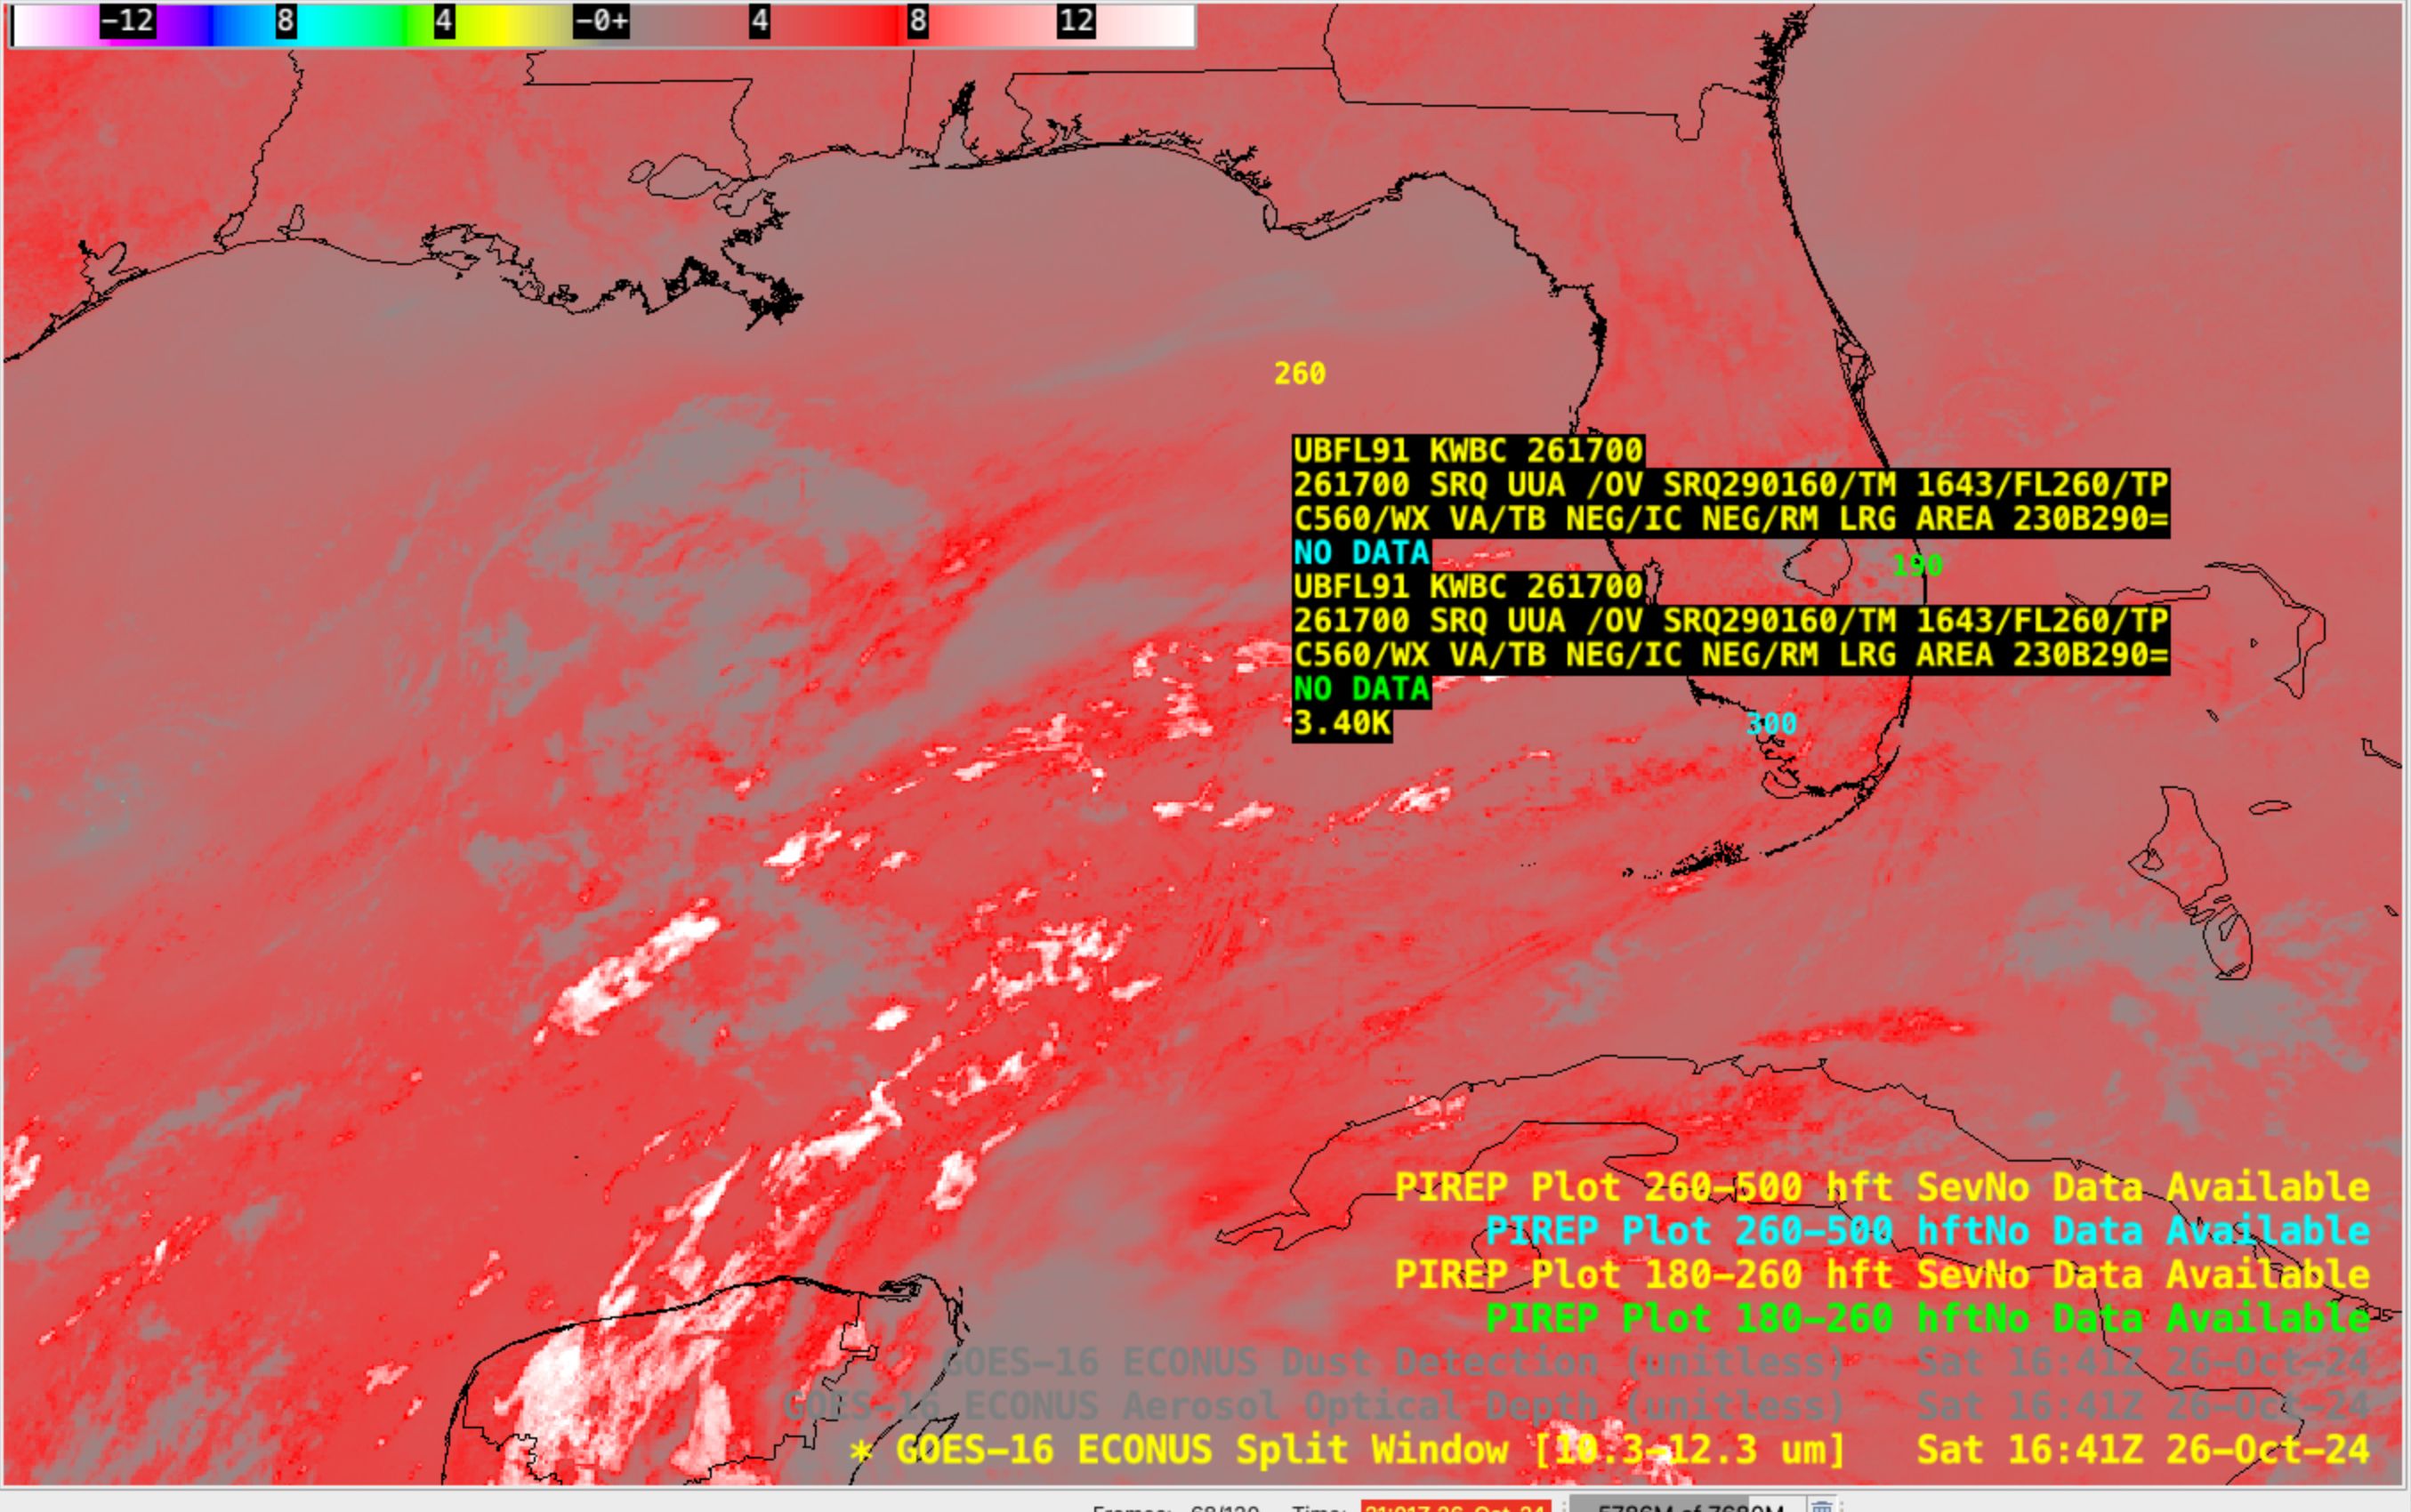
The aforementioned robust eruption that began around 1631 UTC on 25 October ejected ash to an estimated altitude of 32000 ft (FL320) — and southwesterly winds ahead of a 300 hPa trough over Mexico transported this ash across the Gulf of Mexico. On 26 October, there were several Pilot Reports (PIREPs) of Volcanic Ash (VA) over the eastern Gulf of Mexico, near or over the west coast of Florida, at altitudes of 25000-28000 ft (FL250-FL280) (below).
GOES-16 Split Window Difference image, with cursor display of a Pilot Report of Volcanic Ash at 1508 UTC
GOES-16 Split Window Difference image, with cursor display of a Pilot Report of Volcanic Ash at 1514 UTC
GOES-16 Split Window Difference image, with cursor display of a Pilot Report of Volcanic Ash at 1643 UTC
GOES-16 Split Window Difference image, with cursor display of a Pilot Report of Volcanic Ash at 1934 UTC
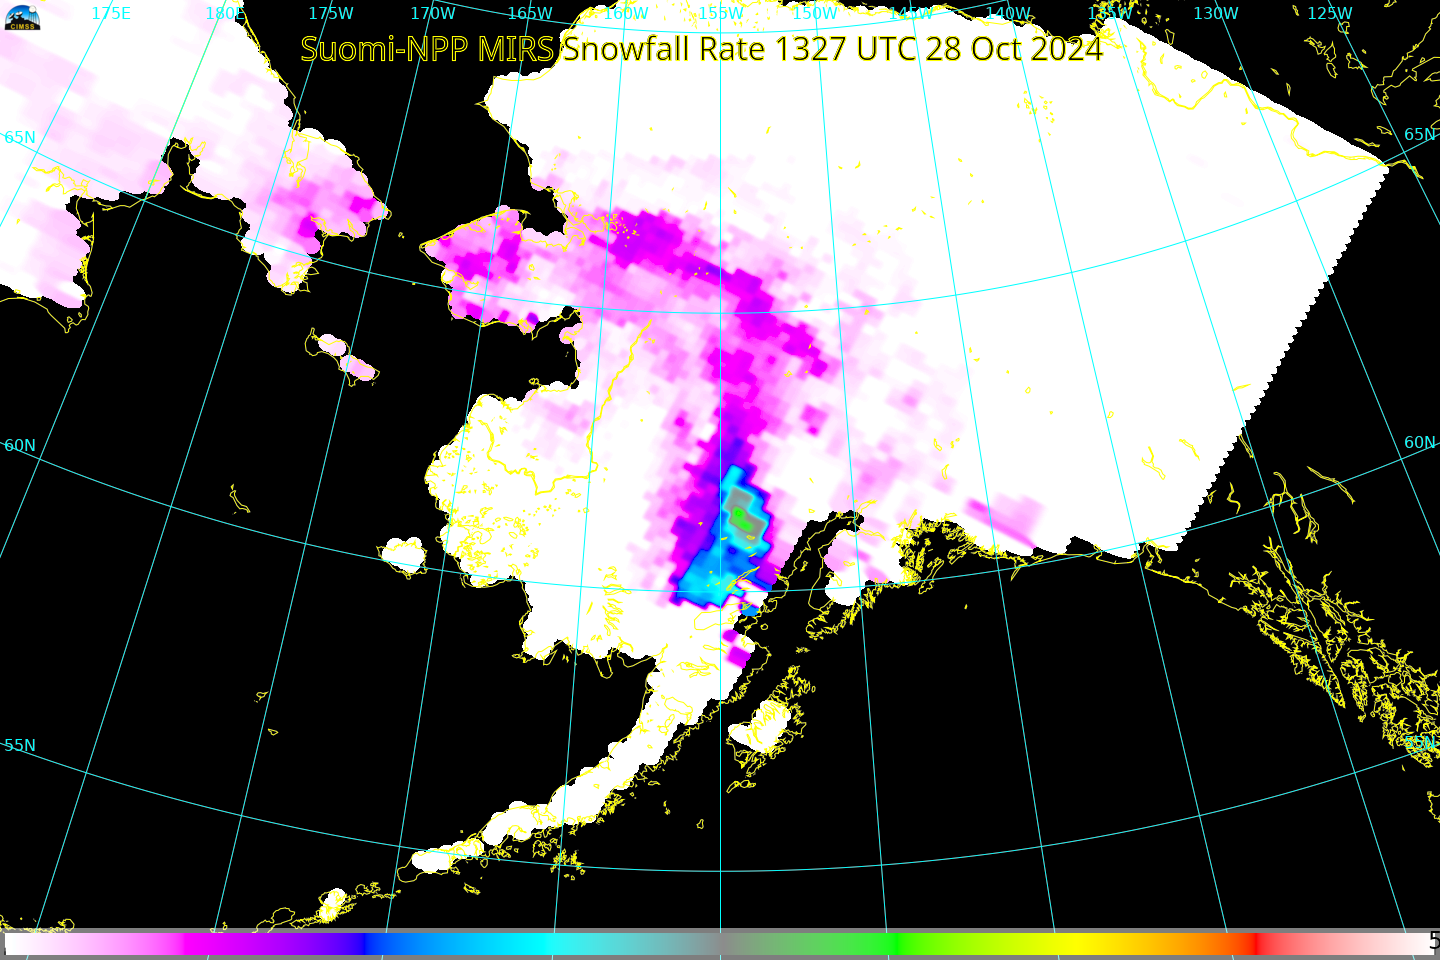
The Community Satellite Processing Package (CSPP) software Polar2Grid supports the creation of imagery using Microwave Integrated Retrieval Software (MIRS) algorithms. This is useful because on-line sources of imagery occasionally go missing. Consider, for example, the Snowfall Rate values that are available at this site from GINA. NOAA-20 was viewing parts of... Read More
The Community Satellite Processing Package (CSPP) software Polar2Grid supports the creation of imagery using Microwave Integrated Retrieval Software (MIRS) algorithms. This is useful because on-line sources of imagery occasionally go missing. Consider, for example, the Snowfall Rate values that are available at this site from GINA. NOAA-20 was viewing parts of Alaska, but no data were created. Polar2Grid can help.
Snowfall Rates at 1208 (NOAA-20) and 1324 (Suomi-NPP) on 28 October 2024 (Click to enlarge)
Polar2Grid is self-contained unix-based software that creates reprojected imagery from JPSS data that can be found online. One set of online data sources are the NOAA/NESDIS/Amazon Web Service bit buckets for Suomi-NPP (here) and for NOAA-20 (here). JPSS Satellites include many different data types. For MIRS products (a list of MIRS products that Polar2Grid can create is here), click on “NPR-MIRS-IMG” as highlighted below. Clicking will reveal different years, and then different months and days. Click through until you reach the date you want; for this case, that’s 28 October 2024.
List of JPSS AWS Buckets for NOAA-20 (Click to enlarge)
Once you get to the date you are interested in, you’ll see many pages of files, because each file covers about 30 seconds of information from the satellite. Page 14, shown below (with 100 files per page!), shows data ending at 1226 UTC on 28 October. For this blog post, I’m looking for data (based on this prediction of the NOAA-20 orbit) between 1211 and 1217 UTC on 28 October (meaning I’d have to scroll up on this page online).
MIRS files available on page 14 (28 October 2024) for NOAA-20; 100 entries per page. (Click to enlarge)
After downloading the files, and also the files for Suomi NPP near 1324 UTC on the 28th, it’s time to create imagery. This is done using the -r mirs flag (that is, the MIRS reader) in Polar2Grid. The commands I used (from within the $POLAR2GRID_HOME/bin directory) are below. Prior to running polar2grid, I created and defined a grid (‘ANC’) and stored the grid parameters in a file (‘ANC.yaml’) using the grid helper command: ./p2g_grid_helper.sh ANC -155.0 62.0 2000 -2000 1440 960 > ANC.yaml ; the grid is centered at 62oN, 155oW, has 2000-m resolution in the east-west and north-south directions, and the grid has dimensions of 1440×960.
Then I added a predefined colormap to the .tif file that Polar2Grid created, and then added coastlines, lat/lon lines, and a colorbar to the final image with the commands below.
The imagery was annotated, and the toggle below is the result. The Suomi NPP image below compares well with the image in the toggle at the top of the blog post, and the earlier NOAA-20 Snow Fall Rate has been created; the slow progress of enhanced snowfalls approaching the Anchorage area can be discerned.
MIRS Snow Fall Rate from NOAA-20 (1211 UTC) and Suomi-NPP (1327 UTC) on 28 October 2024 (Click to enlarge)
Scientists and programmers at SSEC/CIMSS have been working with Hydra within McIDAS-V to augment its functionality, enabling it to view data from the Cross-Track Infrared Sounder (CrIS) on JPSS Satellites (Suomi-NPP, NOAA-20 and NOAA-21). How is this functionality accessed? After downloading the McIDAS-V package, and opening it, a user will... Read More
Scientists and programmers at SSEC/CIMSS have been working with Hydra within McIDAS-V to augment its functionality, enabling it to view data from the Cross-Track Infrared Sounder (CrIS) on JPSS Satellites (Suomi-NPP, NOAA-20 and NOAA-21). How is this functionality accessed? After downloading the McIDAS-V package, and opening it, a user will need to configure User Preferences, as shown in the image below.
McIDAS-V window showing how to configure User Preferences (click to enlarge)
In the Preferences window, change the Toolbar Options so that ‘Show HYDRA GUI’ is included. That’s demonstrated in the toggle below. Highlight ‘Show HYDRA GUI’ on the left (under ‘Actions’), then click ‘Add’. Once this is done, as you’ll see below, there is a ‘Hydra’ GUI tab on the McIDAS-V front page, as shown here.
Change Toolbar Options, adding the Hydra GUI (Click to enlarge)
What kind of data are expected by the Hydra plug-in? You can order the data from NOAA’s CLASS System. At that website, before ordering, change the User Preferences, accessed from the left toolbar as shown below.
Access to User Preferences at the NOAA CLASS system (Click to enlarge)
The User Preferences that Hydra expects are ‘Package Geolocation with JPSS Data Products’; Hydra needs this as ‘Yes’ because it expects data and geolocation data to be in the same file. Note that this is different from other software packages, such as Polar2Grid, that expect data files and geolocation files to be separate (albeit ultimately in the same directory). I did click ‘Yes’ on ‘Deaggregate JPSS Data Products’ but this did not appear to have an effect as I expected (which would be to put all granules in one file).
User Preferences page. At present, ‘Package Geolocation with JPSS Data‘ must be ‘Yes‘ for Hydra to function properly. (Click to enlarge)
The data to order are shown here; under the ‘Please select a product to search’ drop-down menu, choose JPSS CrIS SDR Operational, (Note: SDR means Sensor Data Record) and either choose by times (I typically go to this website to find the series of times that I want) or location. For this example, I choose NOAA-20 data from 1240 to 1255 on 26 October 2024. (This website shows the swath from Greenland to the Aleutians). After ordering the data, you’ll get an email showing where the requested data are stored, as shown here. The file names at that include many granules. The file name structure shown below includes both the Geolocation information (‘GRCSO’) and the CRiS data (‘SCRIF’), as shown below. If you hadn’t specified ‘Package Geolocation with JPSS Data Products‘ under User Preferences, NOAA CLASS would return individual SCRIF and GCRSO files the Hydra (today) cannot interpret correctly.
Put all the files specified in the email into a local directory. You’re now ready to display them using Hydra, so click the Hydra icon in the McV window. When you do that, you’ll see the window appear (below) from which you can point to the directory where the data sits by selecting ‘File(s)’ under the ‘File’ tab.
Hydra window as a user points navigates to files holding CrIS data (click to enlarge)
After selecting all the files within the directory into which I placed the GCRSO-SCRIF files, and clicking ‘Open’, the Hydra window changed. Note that the swath of data overlays what you might have expected given the swath from the SSEC Polar Orbit Track website. Once the swath appears, click on ‘Display’ in this window.
Hydra display showing a default presentation of NOAA-20 CrIS fields (Click to enlarge)
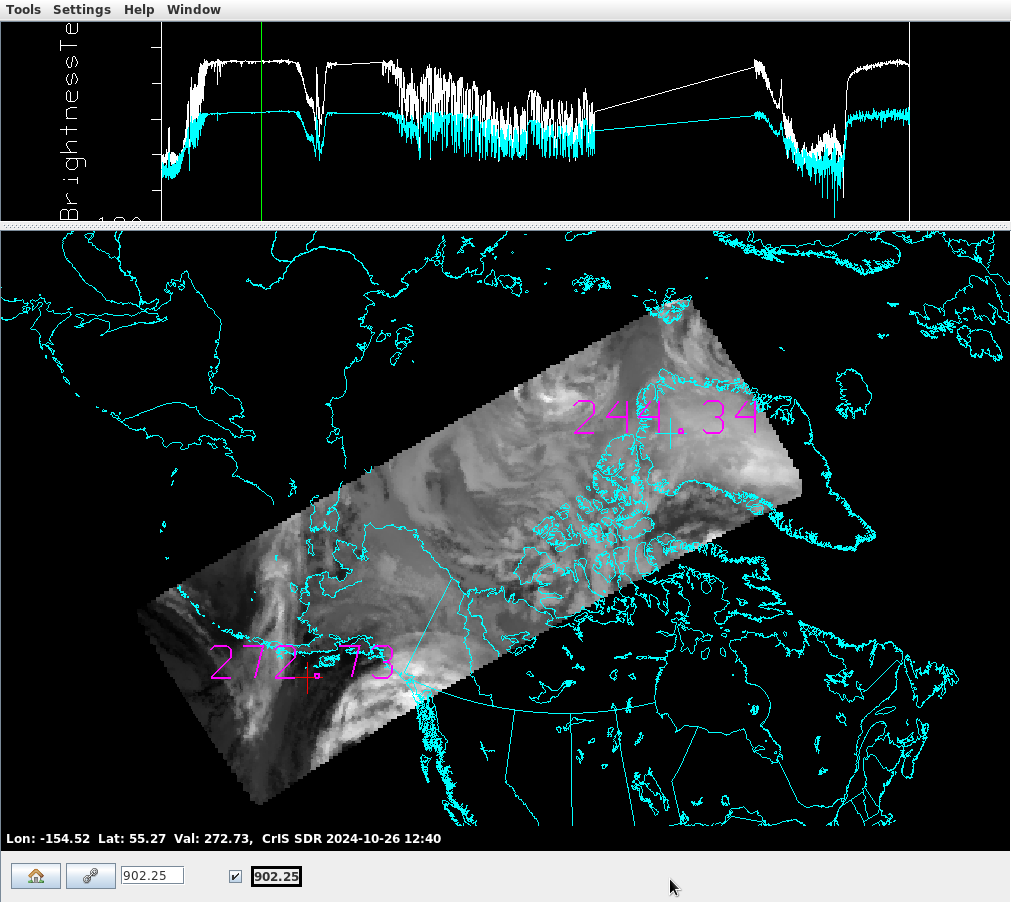
‘Display’ will open another window that shows two probes and the swath. I moved the probe values, and resized the window, and the result is below. The CrIS spectra at the two points are shown — and you can drag the probe locations around the image and see how the spectra change in real time. In this case, the ‘warmer’ (‘cooler’) location’s spectrum is shown in white (cyan). The data in the lower image are CrIS data at wavenumber 902.25 (that is, 11.1 micrometers). That can be changed either by dragging the green line or by entering a value in the box at the bottom of the window.
Display windows with spectra from two probes and displayed greyscale values for wavenumber 902.25
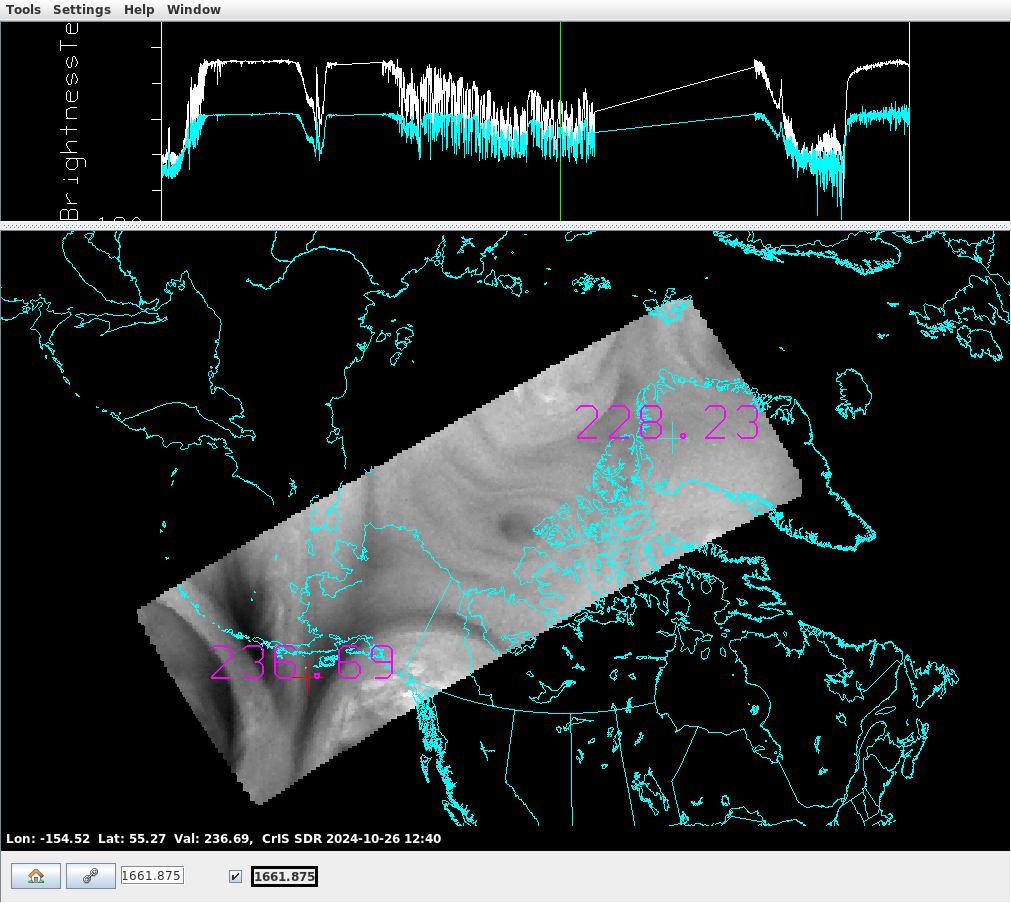
The window below shows how things change when the green line is dragged to the right, and released. Wavenumber 1661.875 (that is, 6.02 micrometers) is shown in the large window now.
Display windows with spectra from two probes and displayed greyscale values for wavenumber 1661.875
Now, under Tools there is a ‘Transect’ choice. If you choose that, a solid line will appear in the window, as shown below. I’ve moved it so it’s start/end points coincide with the two probe locations, and that is shown below.
Display windows with spectra from two probes and displayed greyscale values for wavenumber 1661.875; a Transect line is also shown (click to enlarge)
The Wavenumber 1661.875 Brightness temperatures along that line are shown below. If you drag the endpoints of the transect line above, the transect displayed below will change in real time. If you click on that solid triangle in the center of the transect, you can drag the entire line, and you’ll also see the transect below changing in real time.
Transect of Brightness Temperature for line shown in Window1 (Click to enlarge)
Other functionality available includes the creation of RGB imagery from CrIS data, and the creation scatterplots (and density plots) that compare two different channels on CrIS. Becoming familiar with wavenumber spectra is an important process given that a geostationary atmospheric sounder (GXS) is scheduled to fly on GeoXO, scheduled for launch in the mid-2030s. The version of McIDAS-V that includes the functionality described herein is available at the Daily Build link here. This daily build is created every day with all of the previous day’s programming changes. Therefore, not everything has been fully tested. If you are prompted for a user/password: ‘mcv’ will work for both.
I am indebted to Bob Carp, SSEC, for his help in understanding the functionality of this software. Thanks are also due to Bill Line, CIRA, for asking for (and funding!) this expansion in functionality.


