Unusually dry air aloft across Florida

GOES-16 Mid-level (6.9 µm) and Upper-level (6.2 µm) Water Vapor images (with/without a map overlay), from 1201 UTC on 05 April to 0001 UTC on 06 April; rawinsonde sites are plotted in red [click to play animated GIF | MP4]
GOES-16 Mid-level (6.9 µm) and Upper-level (6.2 µm) Water Vapor images (with/without a map overlay) at 1901 UTC on 05 April; rawinsonde sites are plotted in red [click to play animated GIF | MP4]
Plot of rawinsonde data from Tampa Bay, Florida at 1200 UTC on 05 April [click to enlarge]
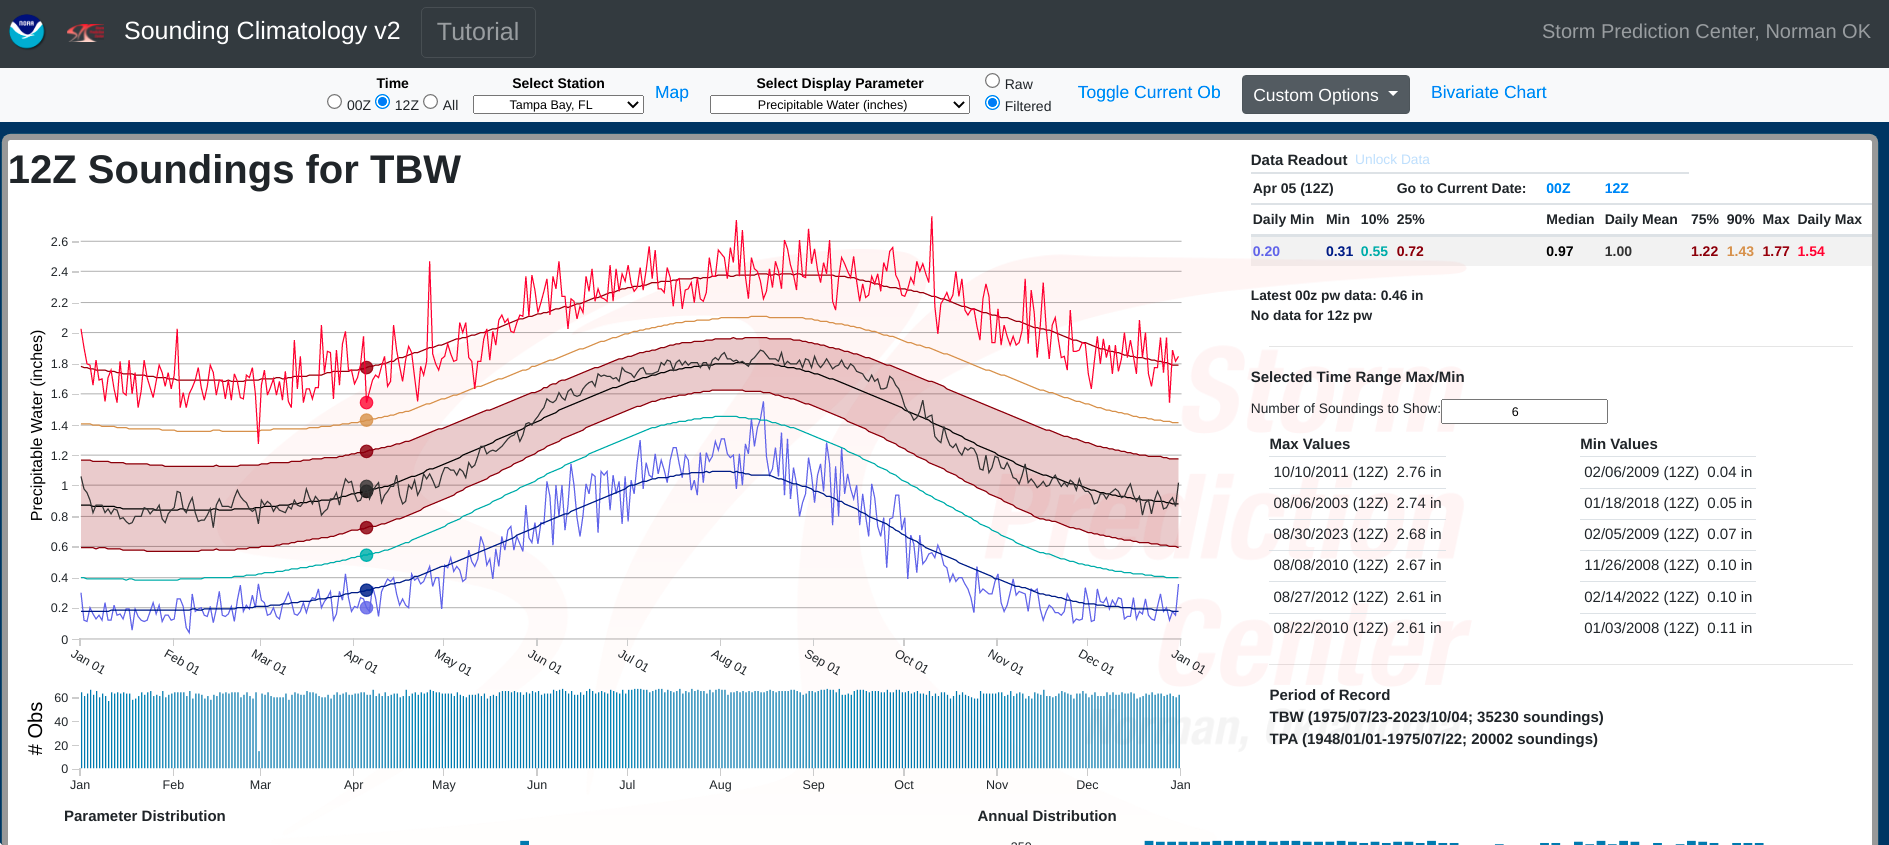
Climatology of Total Precipitable Water for all 1200 UTC soundings on 05 April at Tampa Bay [click to enlarge]
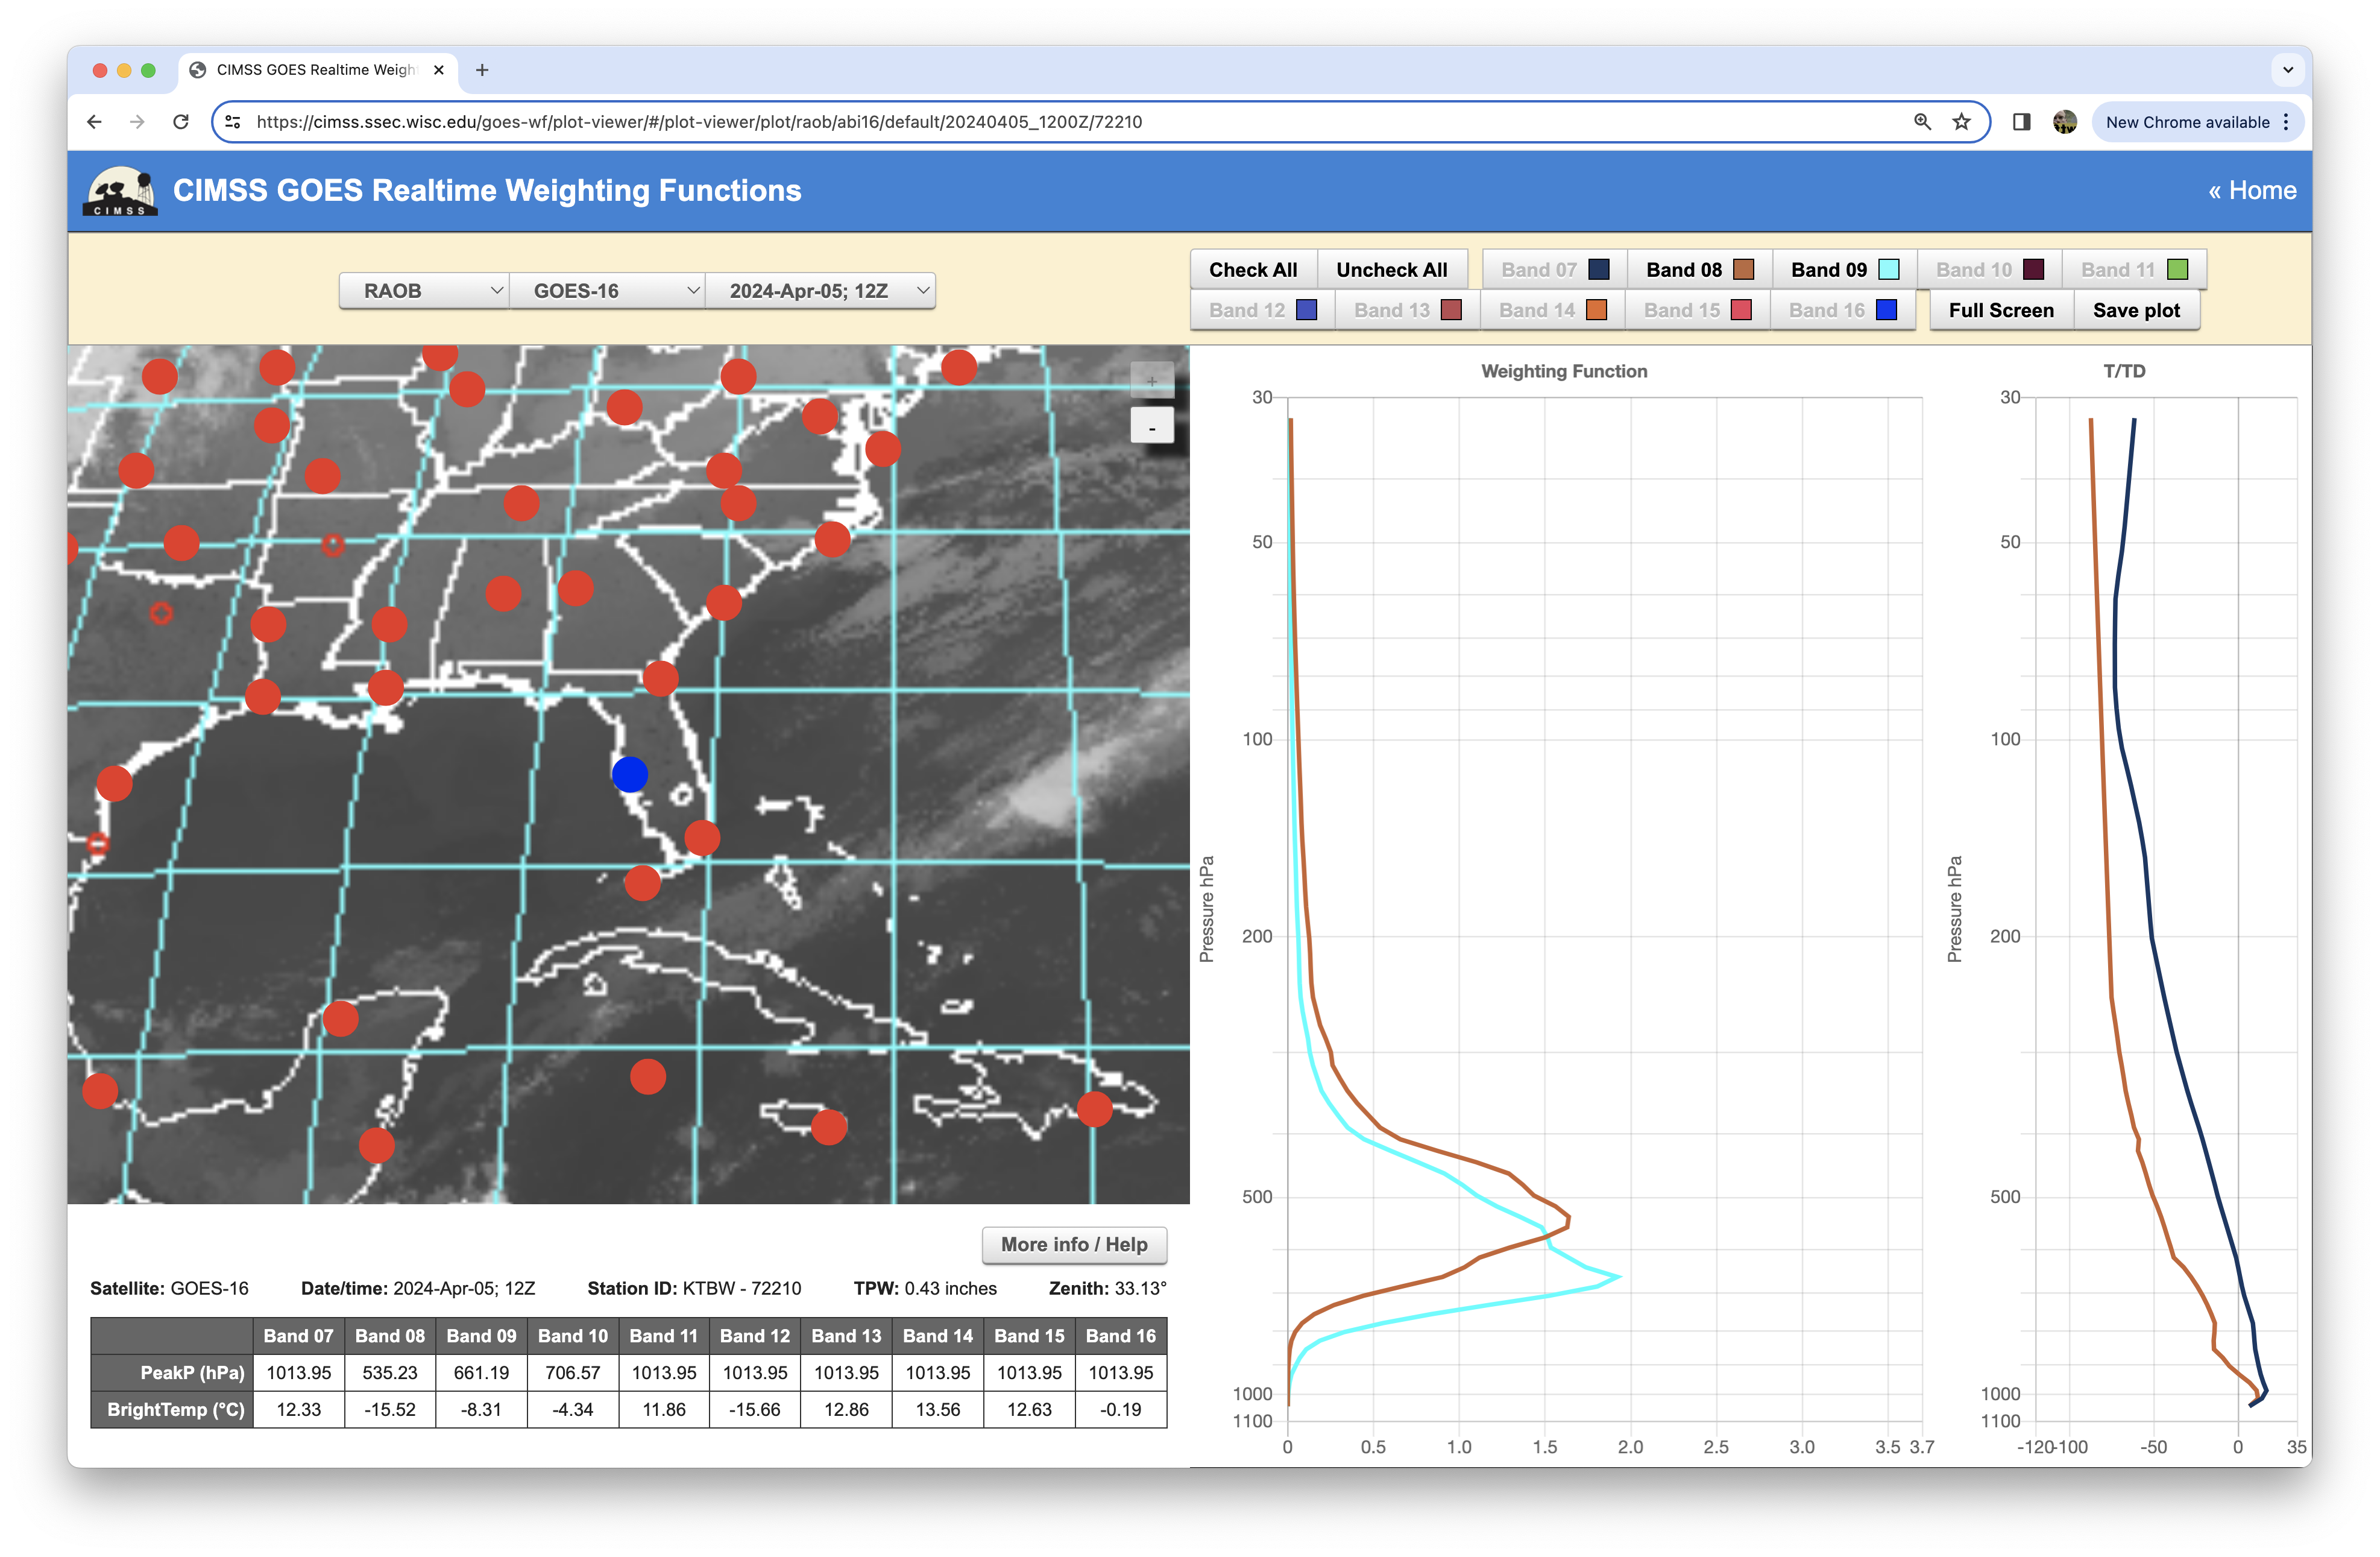
Plot of Weighting Functions for GOES-16 Mid-level Water Vapor (Band 09, cyan) and Upper-level Water Vapor (Band 08, brown), calculated using data from 1200 UTC rawinsonde data from Tampa Bay [click to enlarge]
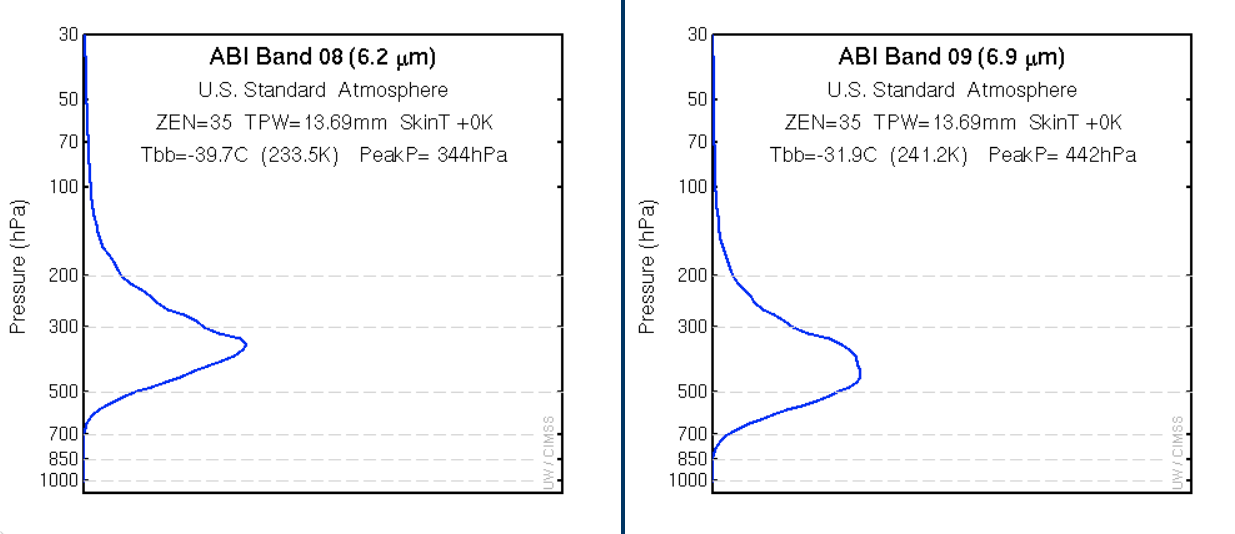
Plots of GOES-16 Upper-level Water Vapor (Band 08, left) and Mid-Level Water Vapor (Band 09, right) Weighting Functions, calculated using a US Standard Atmosphere temperature/moisture profile [click to enlarge]