The MIMIC Total Precipitable Water product at 3-hour intervals (below) indicated the presence of TPW values in the 2.0 to 2.5 inch range over parts of the region.
Upstream rawinsonde data profiles from Washington Dulles International Airport in northern Virginia (below) showed TPW values of 46.8 mm or 1.83 inches at 12 UTC on 30 July, and 49.2 mm or 1.94 inches at 00 UTC on 31 July (although the later data looks suspect, given the balloon was launched as strong thunderstorms were approaching).
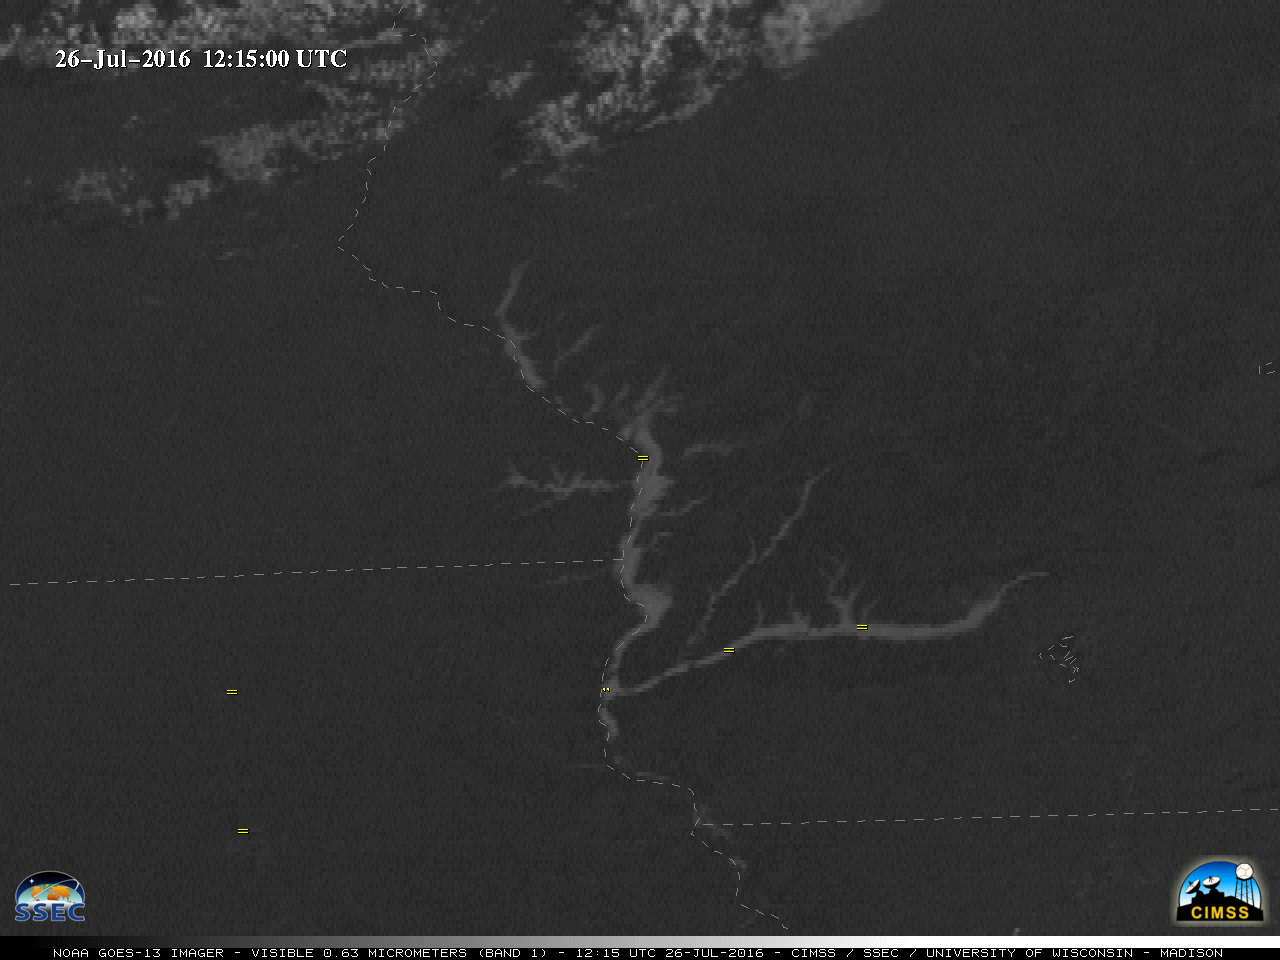
Heavy rainfall and flash flooding in Maryland
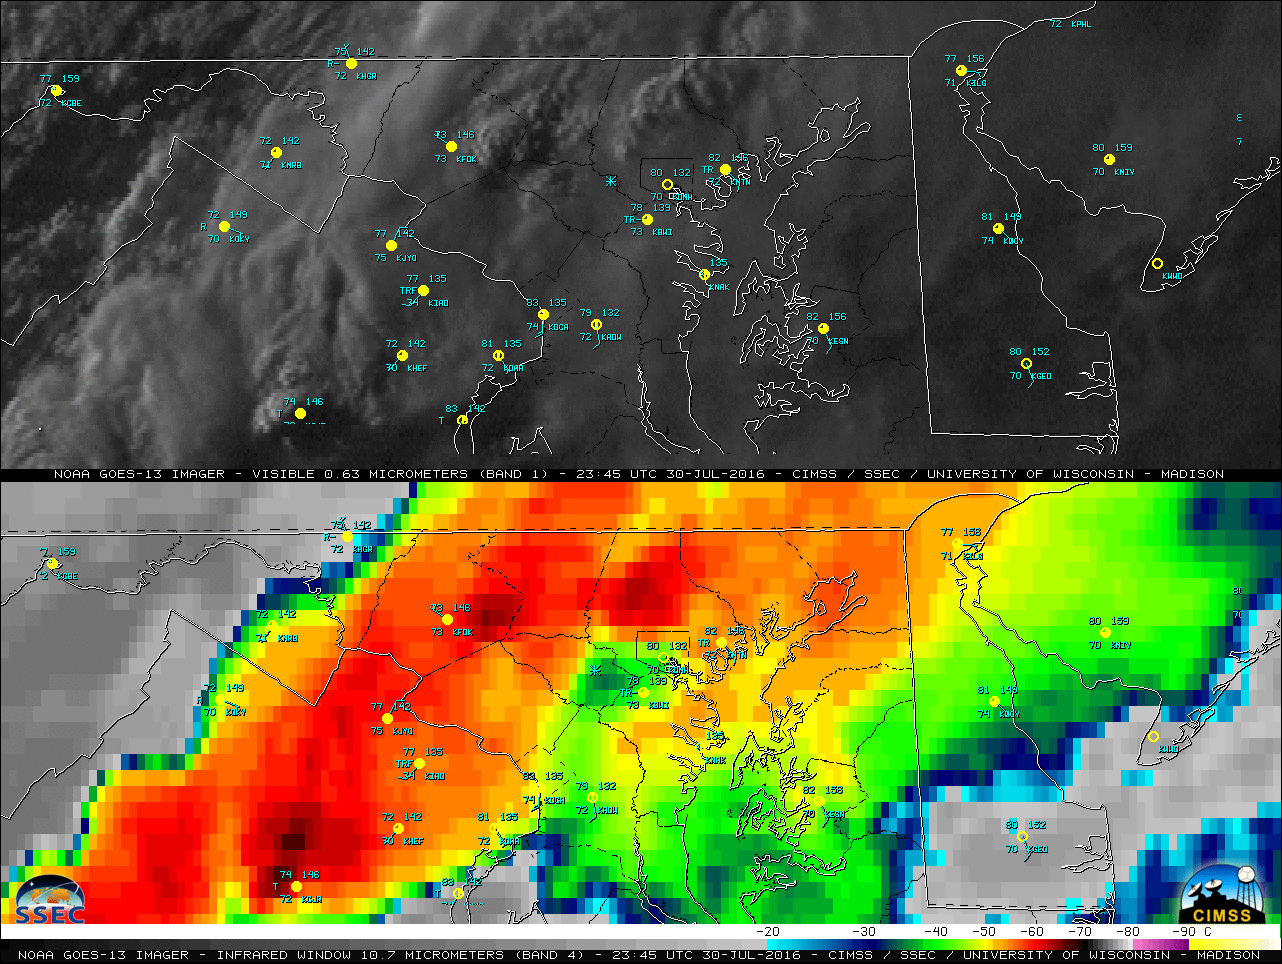
July 30th, 2016 | Scott BachmeierRiver valley fog in Wisconsin, Minnesota and Iowa
July 26th, 2016 | Scott Bachmeier![Suomi NPP VIIRS 11.45 µm - 3.74 µm Infrared brightness temperature difference ("fog product") at 0735 UTC [click to enlarge]](http://cimss.ssec.wisc.edu/satellite-blog/wp-content/uploads/2016/07/160726_0735utc_viirs_fog.png)
Suomi NPP VIIRS 11.45 µm – 3.74 µm Infrared brightness temperature difference (“fog product”) at 0735 UTC [click to enlarge]
During the subsequent daylight hours, GOES-13 Visible (0.63 µm) images (below) revealed the extent of the valley fog which had formed (the yellow symbols denote stations reporting fog). However, this fog quickly dissipated quickly with strong heating from the July sun.
This region frequently experiences such episodes of river valley fog, but they are most common during the Autumn months as nights grow longer and nighttime temperatures get colder. In this late July event, the primary ingredient favoring fog formation was high soil moisture due to recent heavy rainfall (below), much of which occurred on 24 July.
Transverse banding: a signature of potential turbulence
July 20th, 2016 | Scott Bachmeier![GOES-13 Infrared Window (10.7 um) images, pilot reports of turbulence, Turbulence AIRMET boundaries [click to play animation]](http://cimss.ssec.wisc.edu/satellite-blog/wp-content/uploads/2016/07/ir_screenCapture-20160719_113000.png)
GOES-13 Infrared Window (10.7 um) images, pilot reports of turbulence, Turbulence AIRMET boundaries [click to play animation]
The corresponding GOES-13 Water Vapor (6.5 µm) images (below) perhaps highlighted the transverse banding features a bit better at times, since the weighting function for that spectral band generally peaks in the middle to upper troposphere where the transverse banding cloud features existed.
![GOES-13 Water Vapor (6.5 um) images, pilot reports of turbulence, Turbulence AIRMET boundaries [click to play animation]](http://cimss.ssec.wisc.edu/satellite-blog/wp-content/uploads/2016/07/wv_screenCapture-20160719_113000.png)
GOES-13 Water Vapor (6.5 um) images, pilot reports of turbulence, Turbulence AIRMET boundaries [click to play animation]
Severe thunderstorms and heavy rainfall/flooding in the Upper Midwest
July 12th, 2016 | Scott BachmeierA sequence of Infrared images from Terra/Aqua MODIS (11.0 µm) and Suomi NPP VIIRS (11.45 µm) (below) showed greater detail in the storm-top temperature structure at various times during the event.
![Infrared images from Terra/Aqua MODIS (11.0 µm) and Suomi NPP VIIRS (11.45 µm) [click to play animation]](http://cimss.ssec.wisc.edu/satellite-blog/wp-content/uploads/2016/07/MODIS_IR_20160712_0343.png)
Infrared images from Terra/Aqua MODIS (11.0 µm) and Suomi NPP VIIRS (11.45 µm) [click to play animation]
===== 19 July Update =====
![Comparison of before (09 July) and after (12 July through 19 July) Suomi NPP VIIRS true-color images [click to enlarge]](http://cimss.ssec.wisc.edu/satellite-blog/wp-content/uploads/2016/07/160709-19_suomi_npp_viirs_truecolor_Lake_Superior_sediment_anim.gif)
Comparison of before (09 July) and after (12 July through 19 July) Suomi NPP VIIRS true-color images [click to enlarge]
Another comparison of before (09 July) and after (13 through 19 July) true-color RGB images from Terra and Aqua MODIS is shown below.
A toggle between a Terra MODIS Visible (0.65 µm) image and the corresponding MODIS Sea Surface Temperature (SST) product on 16 July (below) showed that the SST values in the sediment-rich nearshore waters were significantly warmer (middle 60s F, red enhancement) than those found closer to the center of Lake Superior (middle 40s F, cyan enhancement).