Flash Flooding in American Samoa
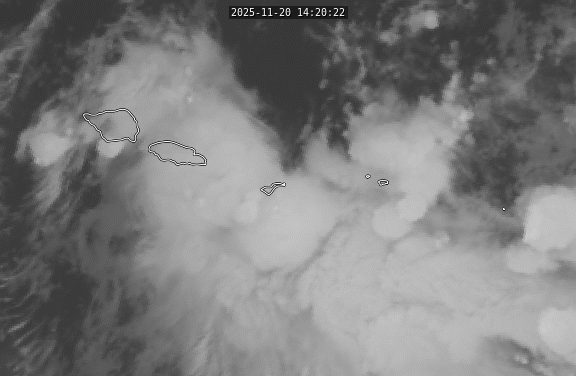
The residents of American Samoa found themselves in the early morning hours of 20 November 2025, as strong maritime convection moved into the region. There is no radar in the area, so satellite observations are critical for operational awareness and nowcasting. The Band 13 infrared view on GOES-18 showed a large array of vigorous convective storms stretching east-west across the near-equatorial Pacific.
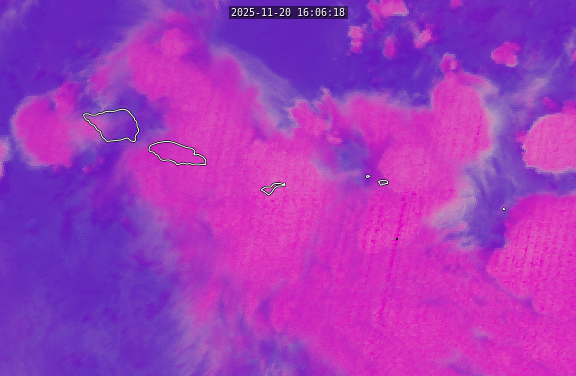
While this product gives a solid qualitative view of where deep, moist convection is taking place, additional products can also further inform as to the intensity of the storms. One of these is the Day Convection RGB. The recipe for this product is designed to show red when clouds are high and green where cloud droplets are large. The combination of high clouds and large droplets is found in deep convective plumes, while the combination of red and green produces yellow. The following animation shows that relationship in action. You might note that this loop spans the sunrise. Since the product relies heavily on near-infrared and visible reflectance, it can only be used during the day. The lack of yellow at the start of the loop does not mean that there is no deep convection. Instead, it just means that the 3.9 minus 10.3 micron brightness temperature difference which comprises the green channel of this image in very small at night (unless something is on fire).
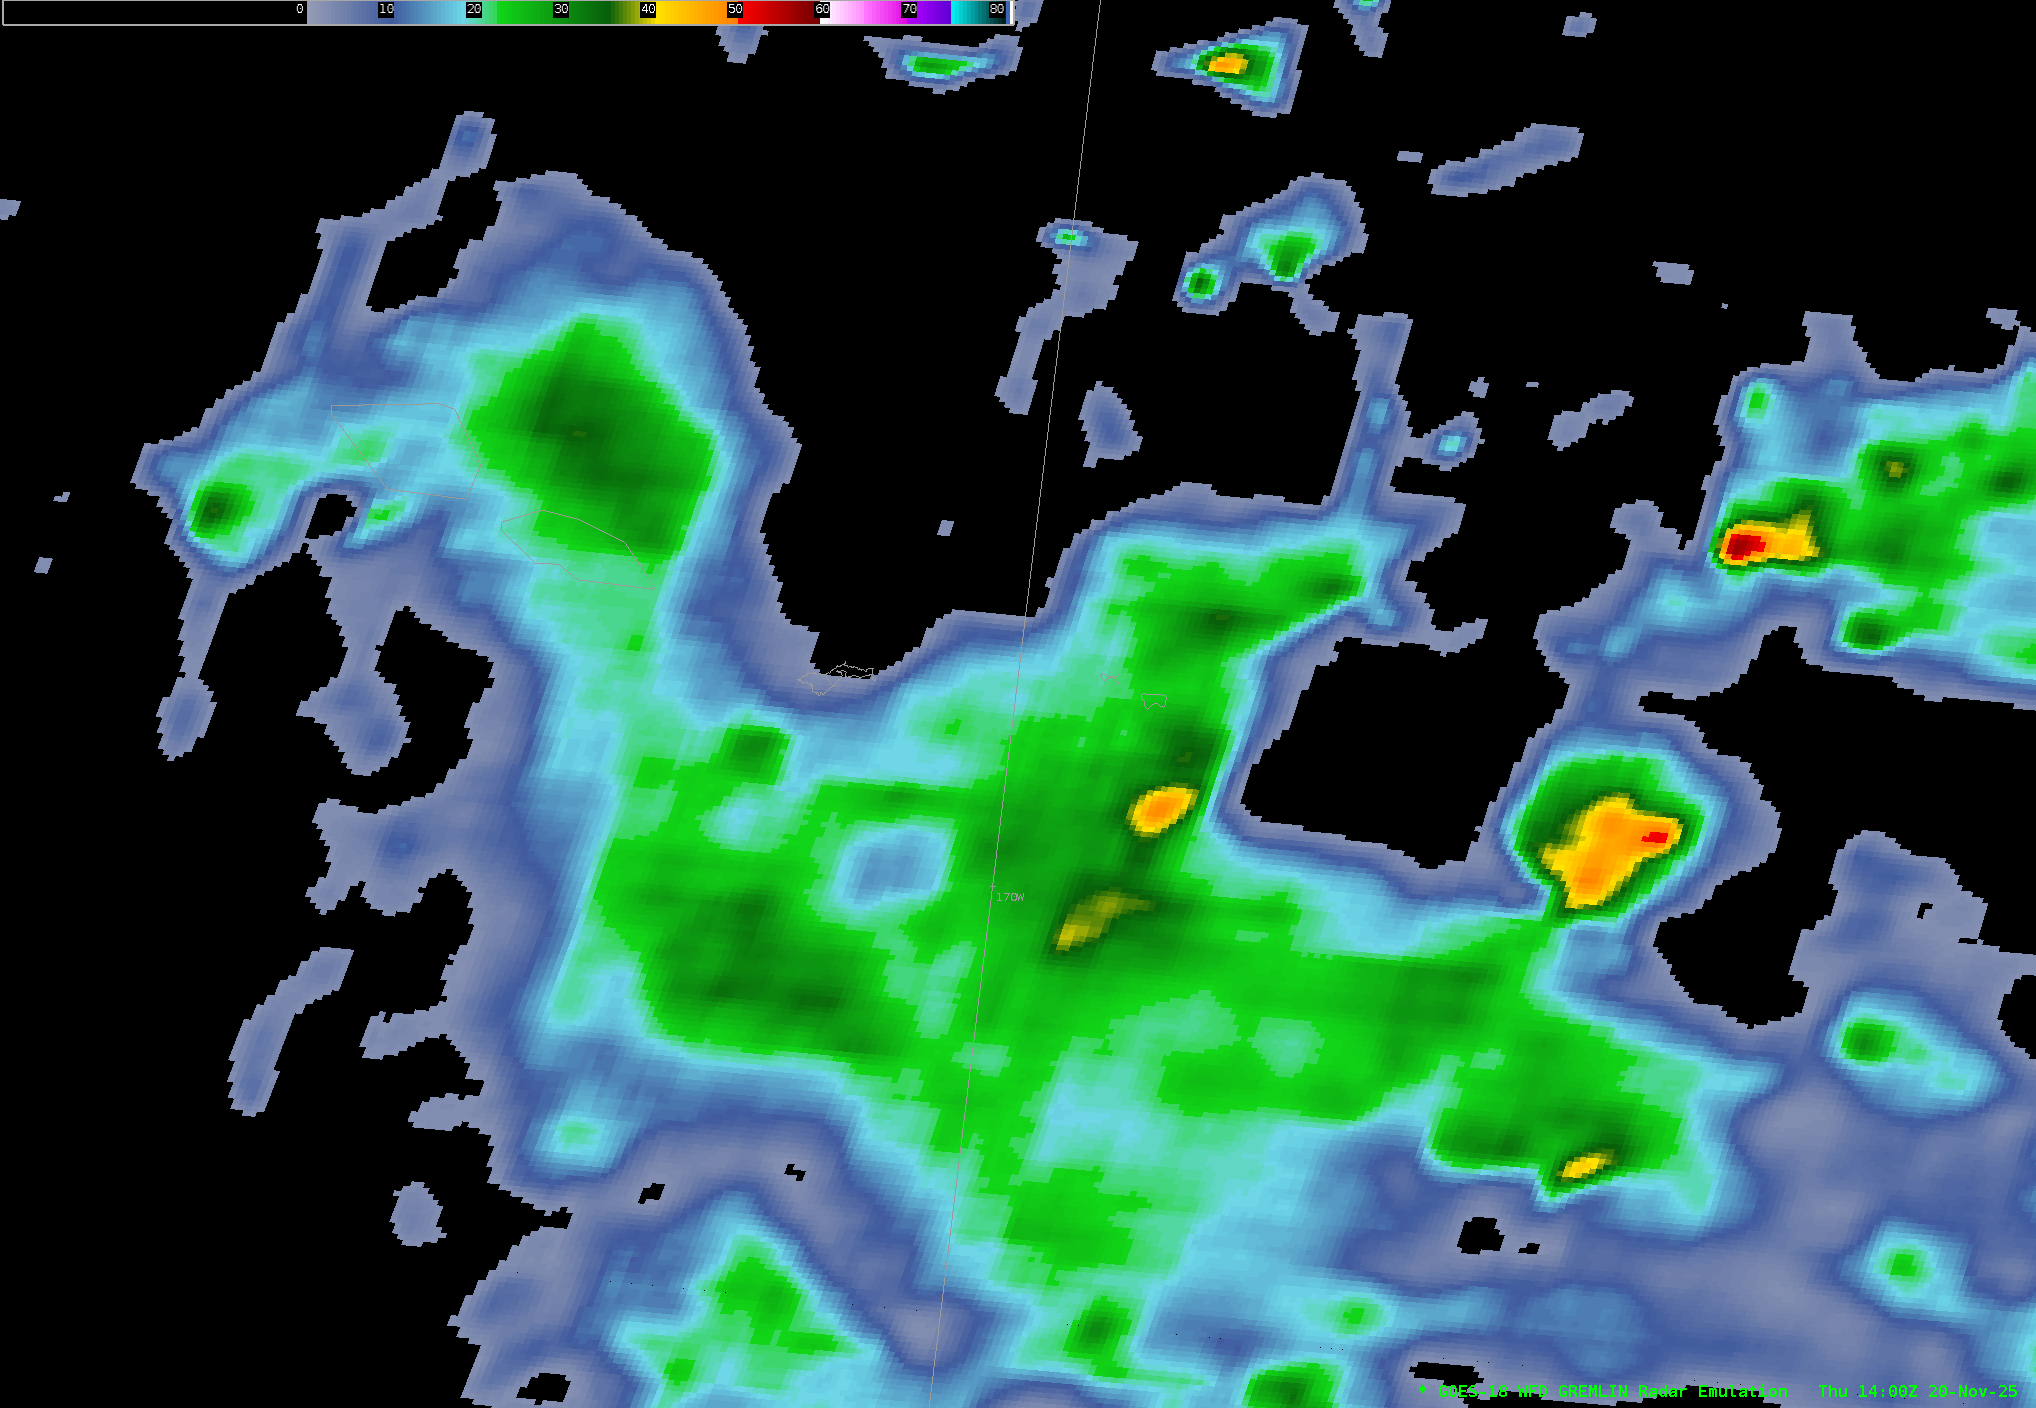
With no radar, satellites have to step in and help fill the gap. The GREMLIN product is a machine-learning retrieval of rainfall from satellite brightness temperature observations, designed to mimic the radars that forecasters find so familiar. The following loop is from GREMLIN as displayed on AWIPS for roughtly the same time as the previous animations. Note the pulses of yellow over and around the island of Tutuilia, corresponding with rain rates of 40 mm/hr (more than 1.5 inches per hour).
Satellites can also help judge the convective instability of the atmosphere. NUCAPS-retrieved thermodynamic profiles from polar-orbiting hyperspectral infrared and microwave sounding instruments provide valuable information about the atmosphere’s thermodynamic state. Since NUCAPS retrieves dozens of profiles simultaneously, it’s possible to analyze the profiles like a three-dimensional cube, taking horizontal slices and seeing how key parameters change horizontally as well as vertically. The next image shows the 850-500 mb lapse rate over the central Pacific as calculated by NUCAPS and displayed in AWIPS. The NUCAPS availability parameter is plotted on top as an array of red, blue, or green dots. The values in the middle of the convection are untrustworthy as neither the infrared nor the microwave sounders can penetrate the convective cores. Still, the reliable locations show lapse rates approaching 6 C/km. In the tropics, the moist adiabatic lapse rate is less than it is in the tropics as more latent heat lease means a slower lapse rate. Therefore, the observed lapse rates can still indicate instability

Clicking on any of the dots in AWIPS brings up the sounding and its associated stability indices. For one green dot near Pago Pago, American Samoa, the environment is clearly moderately unstable with CAPEs in the mid-to-upper 1000s and effectively no CIN to restrain convection.

This just continues a trend of record-setting precipitation in American Samoa, which has previously been discussed on the blog. The chart below shows the accumulated precipitation for so far in 2025 (blue), the wettest year before now (2020, magenta), and normal (brown). Already in 2025, the total rainfall has exceeded every single year save one despite still having a month to go.
