Satellite indicators of thundersnow during a lake effect snow event in southern Lake Michigan
1-minute GOES-19 Infrared images with overlays of GLM Flash Extent Density (large blue/cyan pixels) and GLM Flash Points (white dots), along with plots of surface reports (red) and fixed buoy reports (yellow), from 0501-1000 UTC on 10 November [click to play MP4 animation]
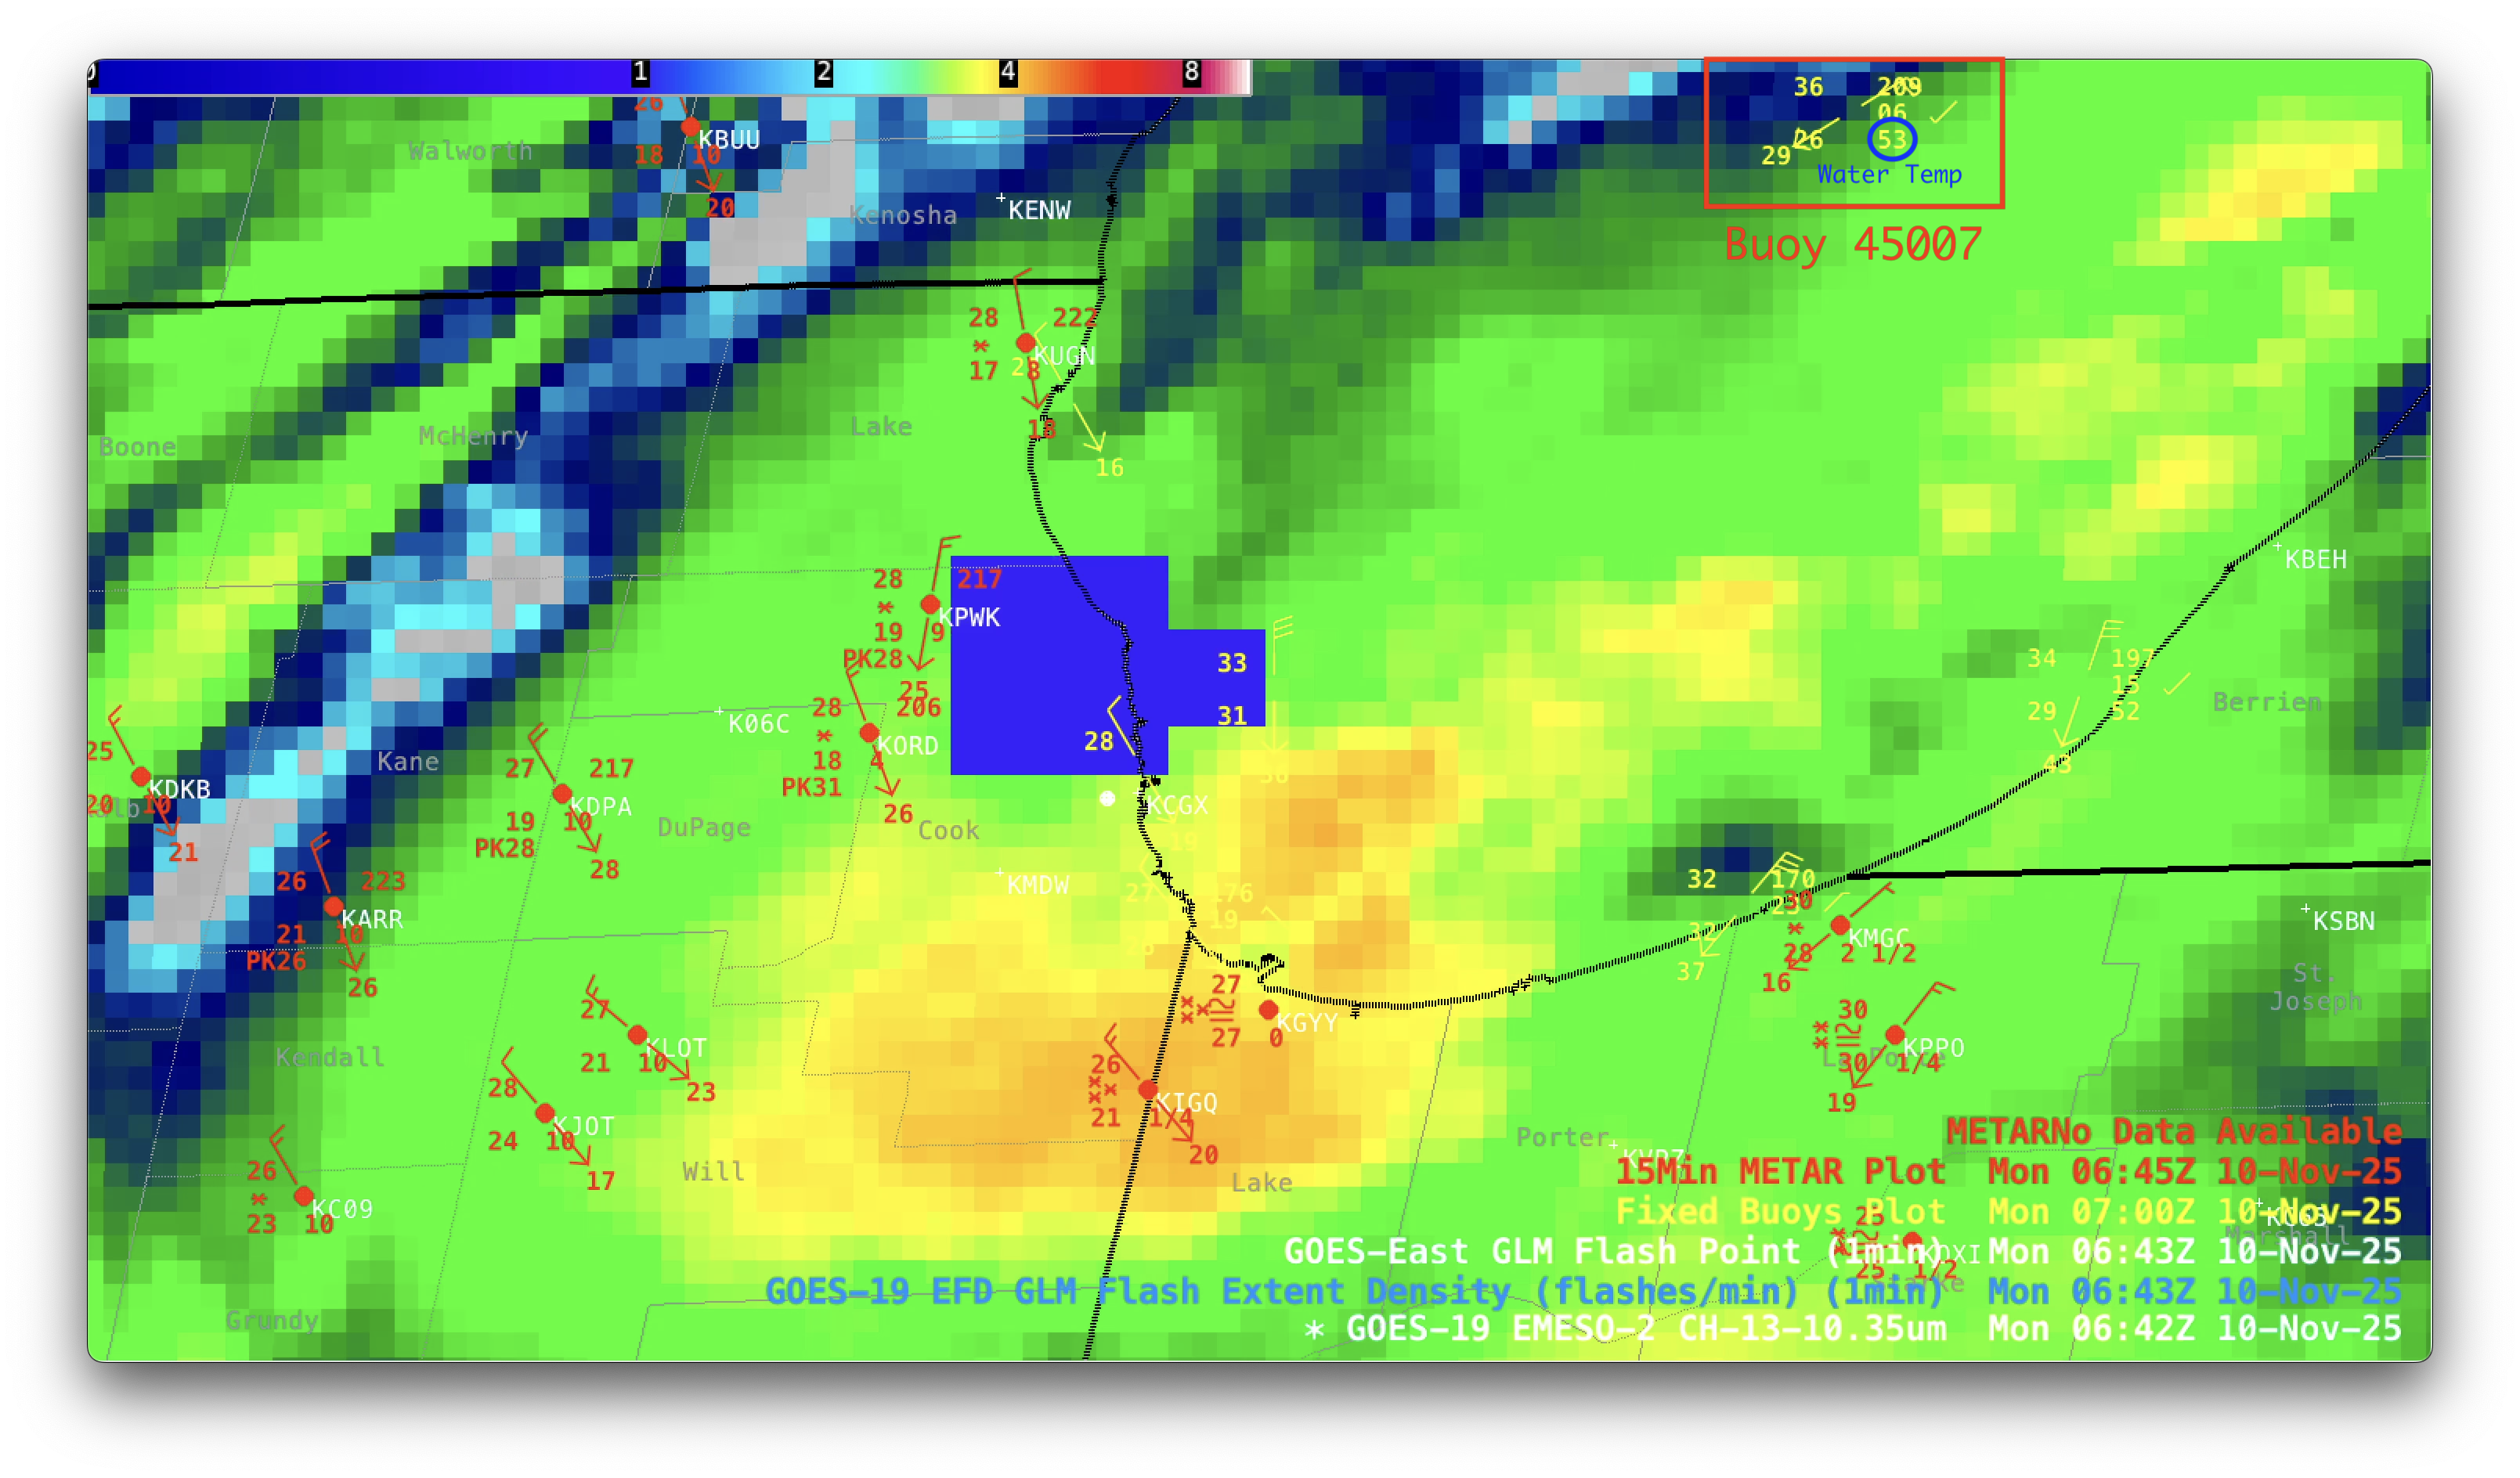
1-minute Mesoscale Domain Sector GOES-19 (GOES-East) Infrared images (above) showed a lake effect cloud band — exhibiting cloud-top infrared brightness temperatures as cold as -49 C (darker shades of orange) — over far southern Lake Michigan that was moving inland across parts of northwest Indiana and northeast Illinois after midnight on 10 November 2025. Air temperatures in the mid-30s F flowing across lake buoy water temperatures of 53ºF created sufficient instability in the marine boundary layer to enhance and sustain these lake effect cloud bands.
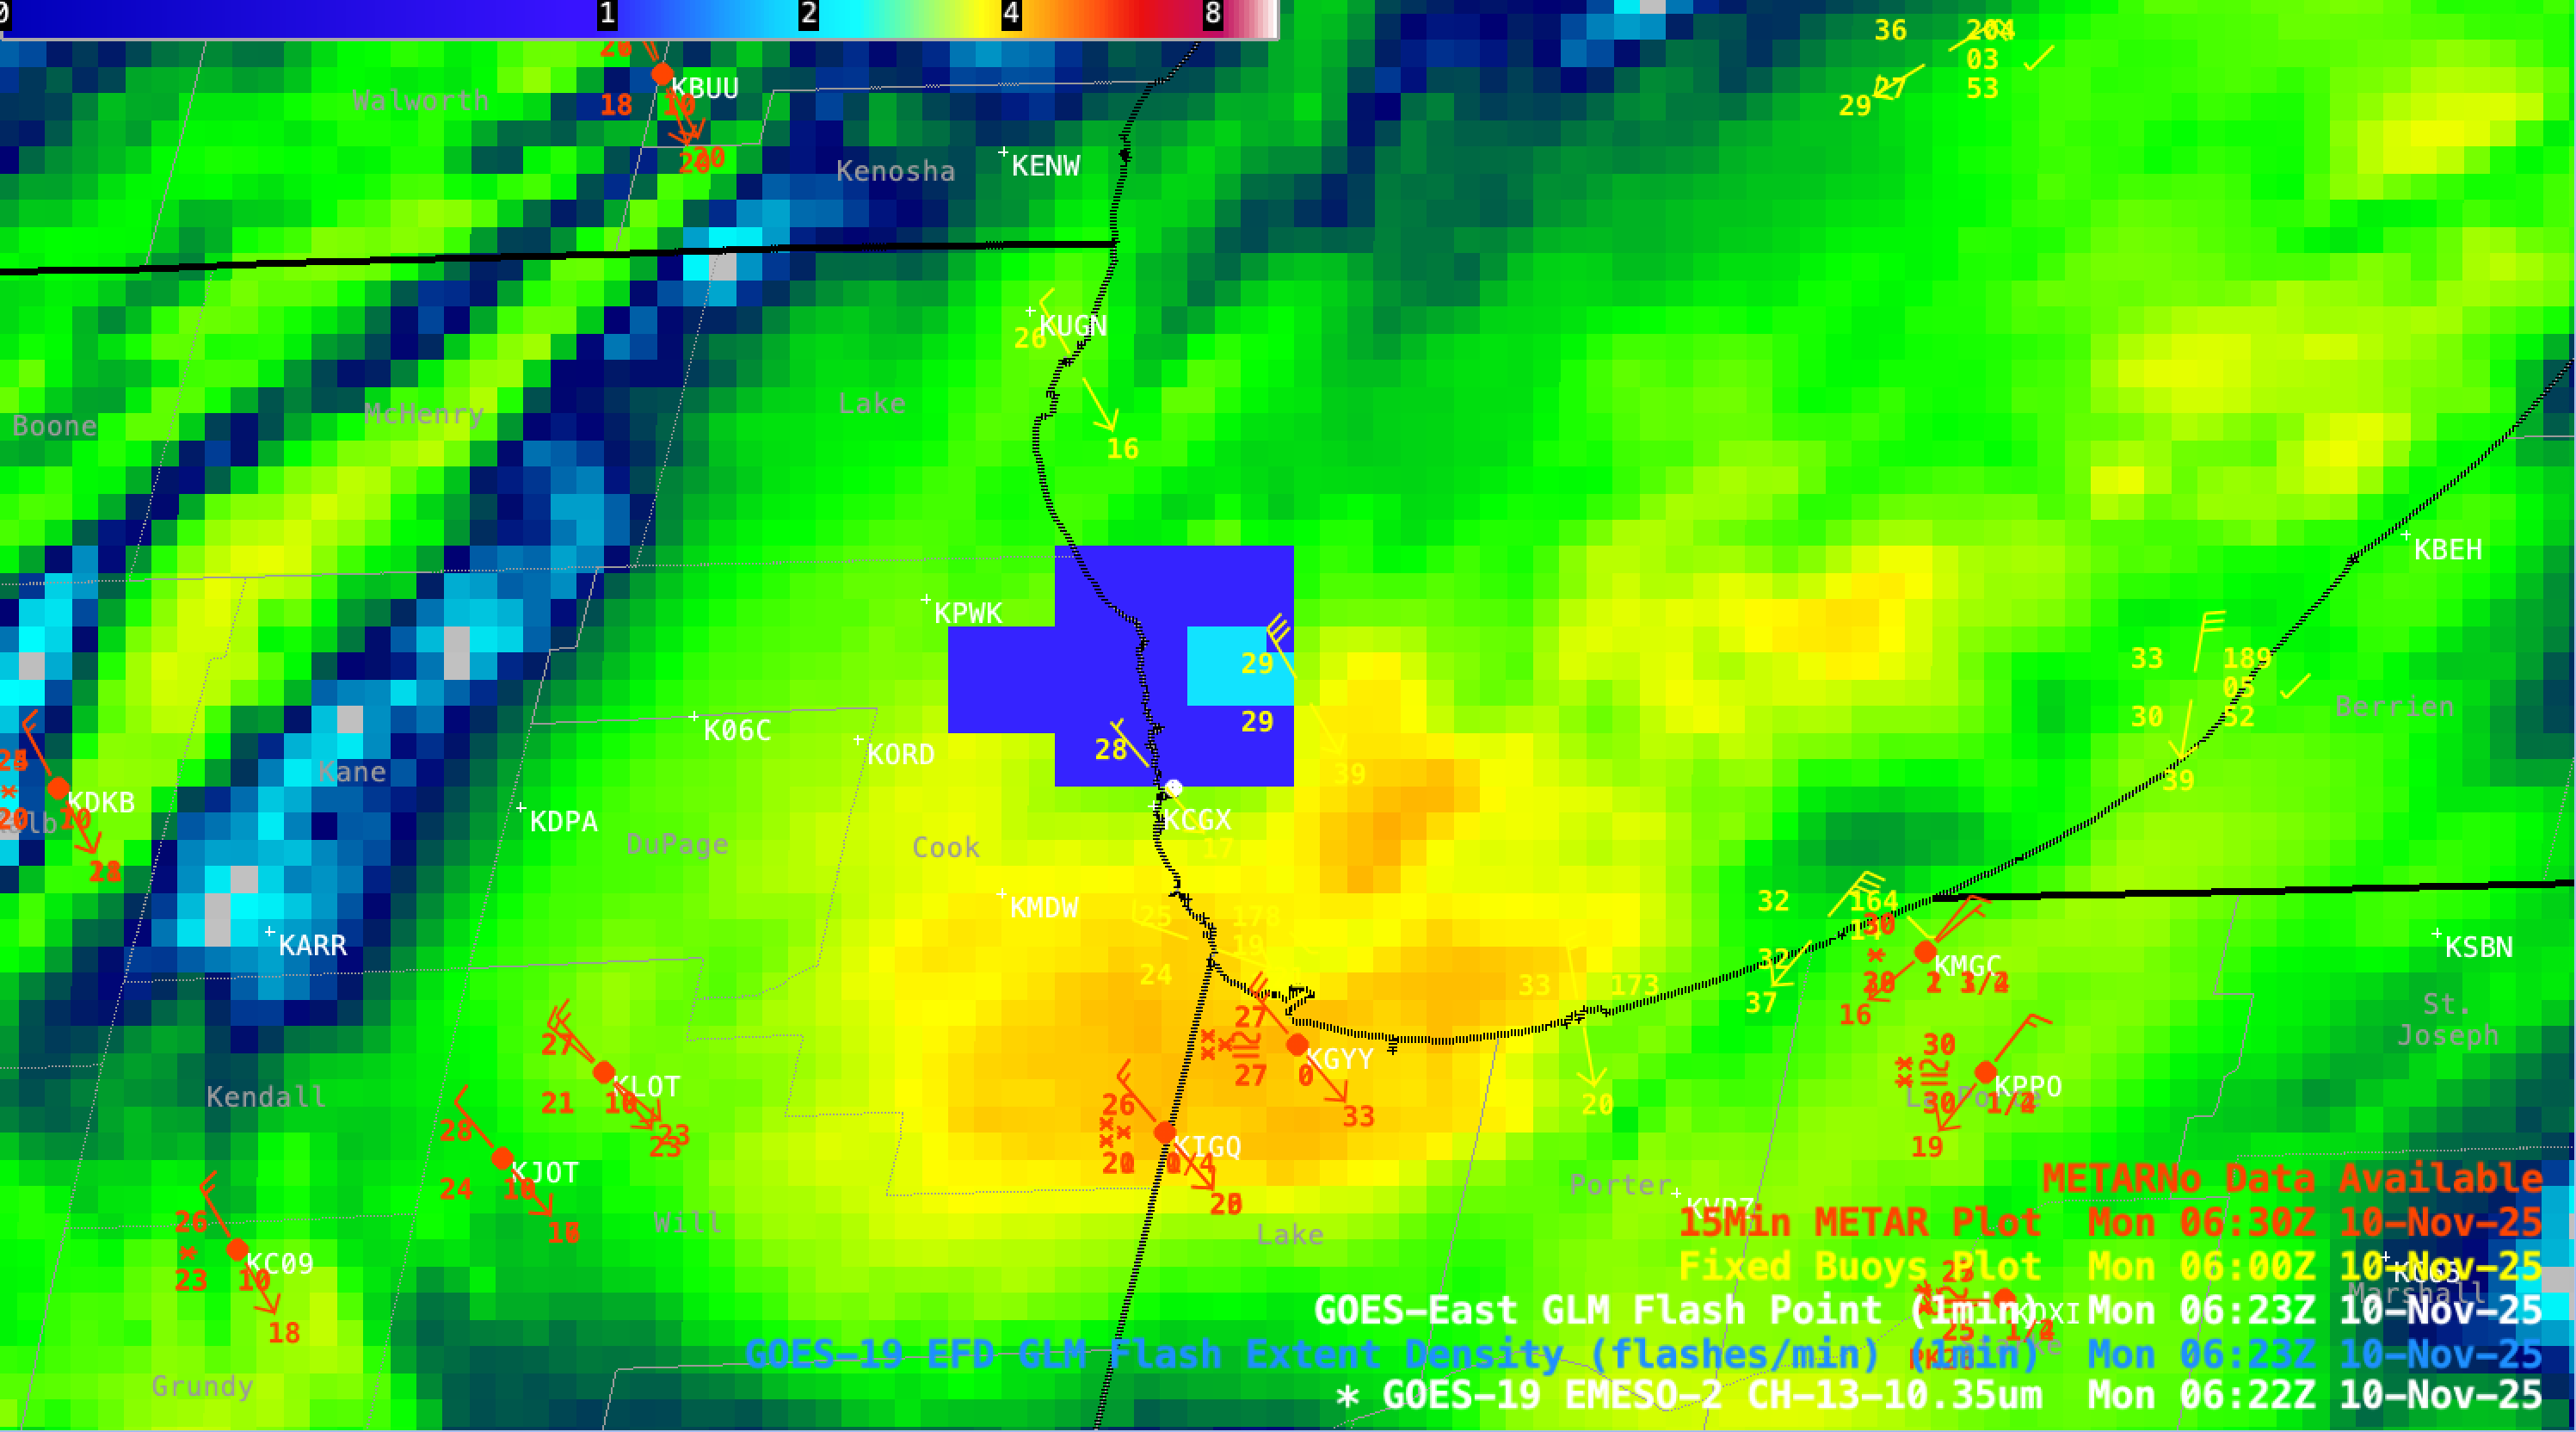
Overlays of GLM Flash Extent Density and Flash Points highlighted 3 brief instances of satellite-detected lightning activity — along the coast of Indiana at 0519 UTC, and then along the coast of Illinois (near Chicago) at 0622 UTC and 0642 UTC (below). Note that the GLM Flash Points are parallax-corrected (to match their location at the surface), while the GLM Flash Extent Density gridded product is *not* parallax-corrected (and therefore exhibits a slight NNW displacement in GOES-19 imagery). None of the nearby METAR sites explicitly reported thundersnow or lightning around the times of these GLM signatures.

GOES-19 Infrared image at 0519 UTC on 10 November with overlays of GLM Flash Extent Density (large blue/cyan pixels) and GLM Flash Points (white dots), along with plots of surface reports (red) and fixed buoy reports (yellow) [click to enlarge]
GOES-19 Infrared image at 0622 UTC on 10 November with overlays of GLM Flash Extent Density (large blue/cyan pixels) and GLM Flash Points (white dots), along with plots of surface reports (red) and fixed buoy reports (yellow) [click to enlarge]
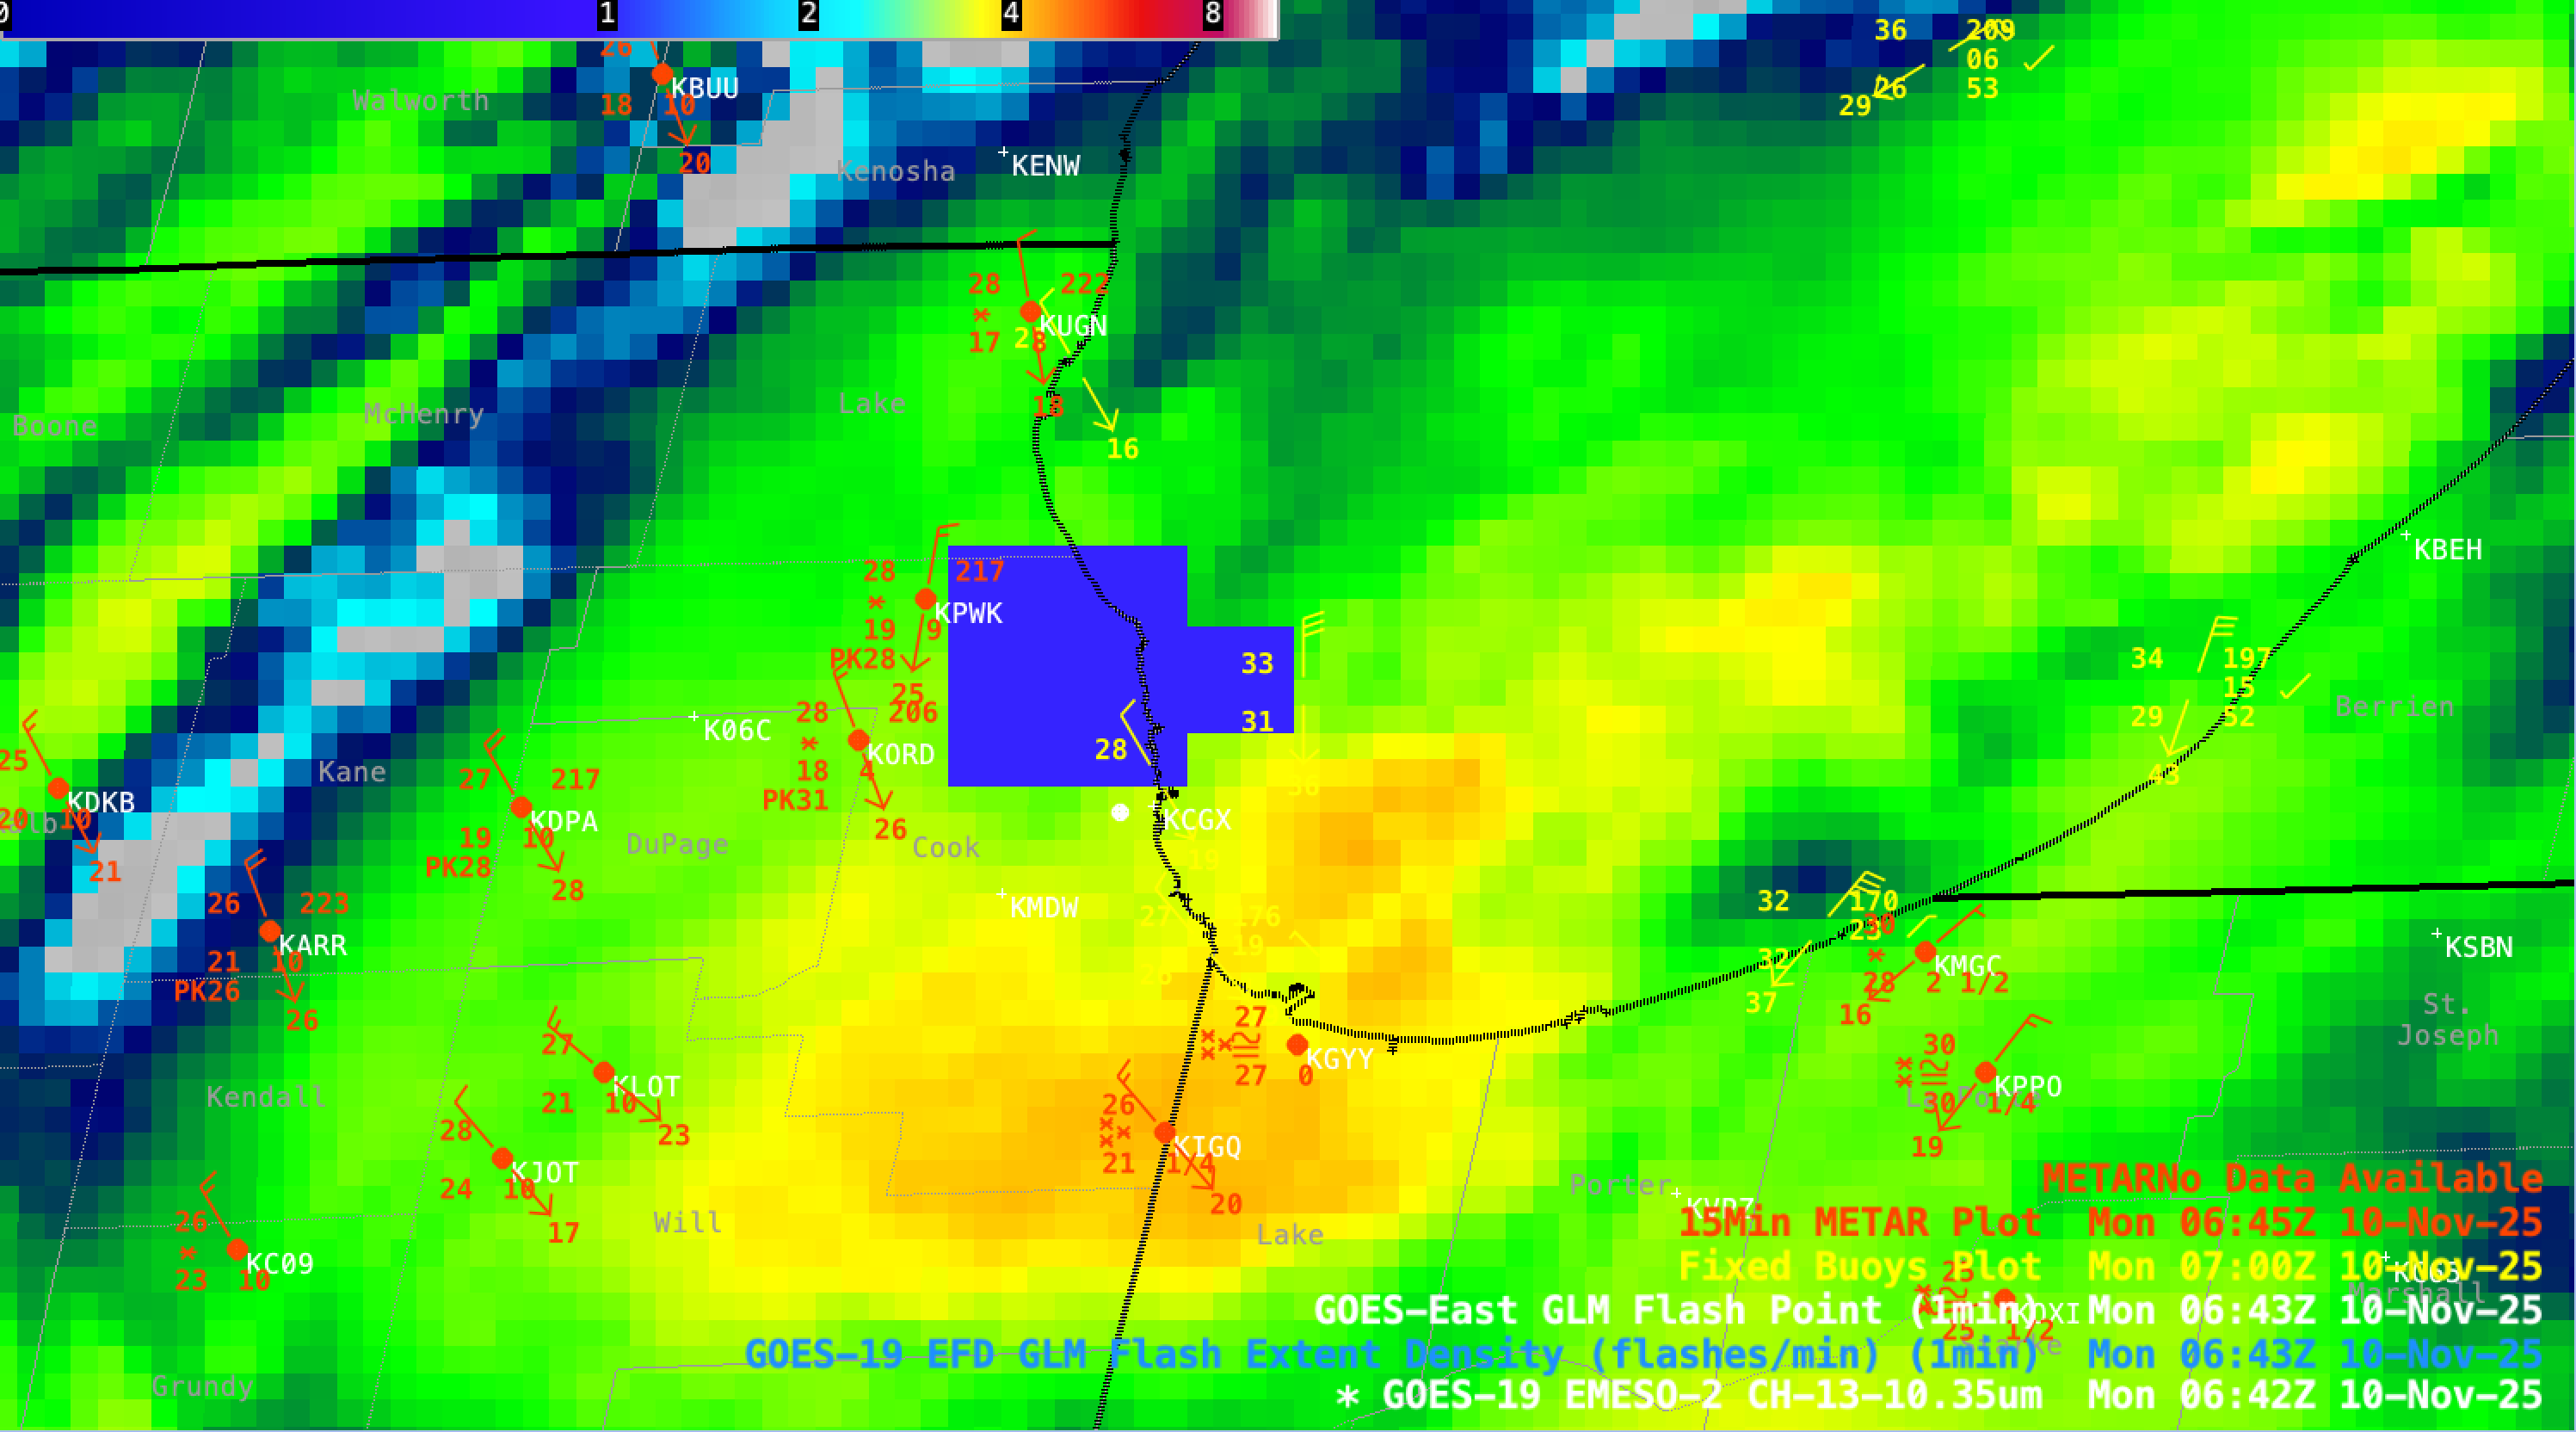
GOES-19 Infrared image at 0642 UTC on 10 November with overlays of GLM Flash Extent Density (large blue/cyan pixels) and GLM Flash Points (white dots), along with plots of surface reports (red) and fixed buoy reports (yellow) [click to enlarge]
_______________________________

1-minute GOES-19 Infrared images with overlays of GLM Flash Extent Density (large blue/cyan pixels) and GLM Flash Points (white dots), along with plots of surface reports (red) and fixed buoy reports (yellow), from 0641-1300 UTC on 10 November [click to play MP4 animation]
Farther to the north, another lake effect snow band was moving inland across far southeast Wisconsin and extreme northeast Illinois (above). No lightning activity was seen in GLM data with this lake effect cloud band, but it did produce as much as 13.0 inches of snow at Pleasant Prairie, Wisconsin (below).

Map showing Local Storm Reports of snowfall accumulations ending at 1400 UTC on 10 November