The impact of satellite inputs in ProbSevere v3
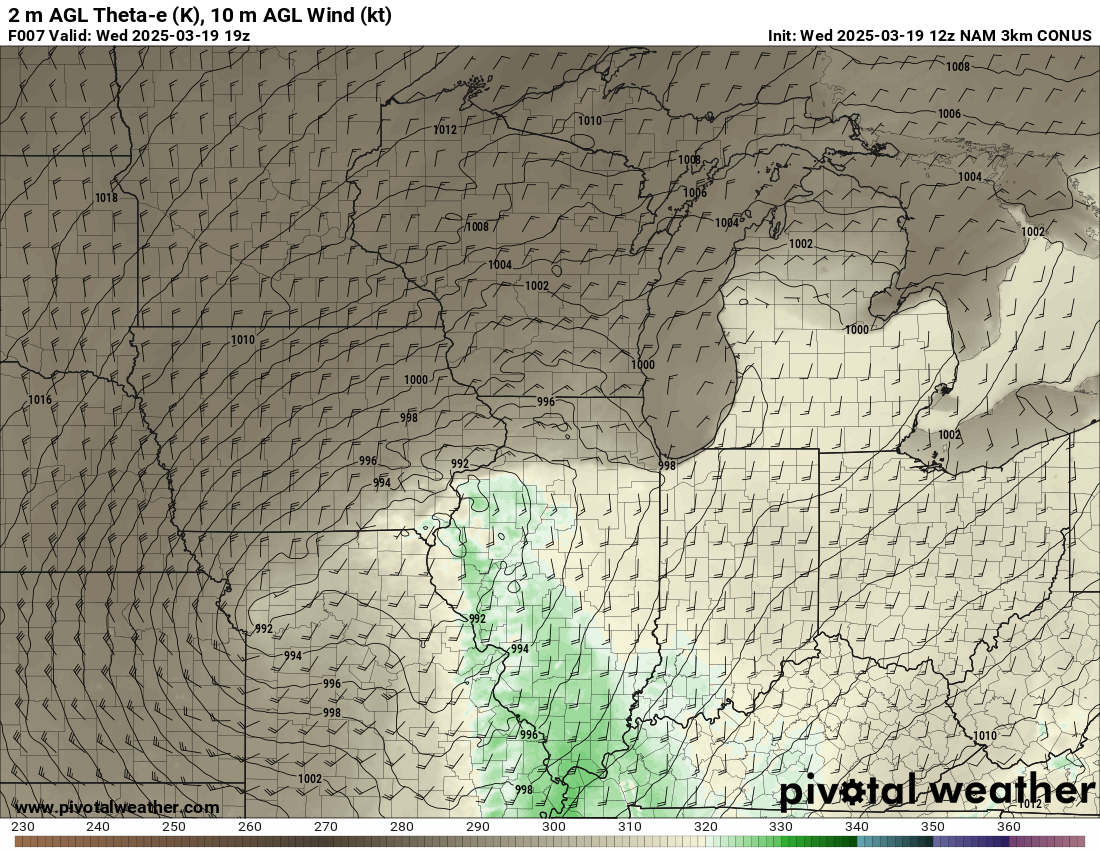
On March 19, a potent shortwave trough forced the development of a strong surface cyclone and moisture return into central Illinois, with ample surface theta-e and deep-layer shear to sustain surface-based convection.
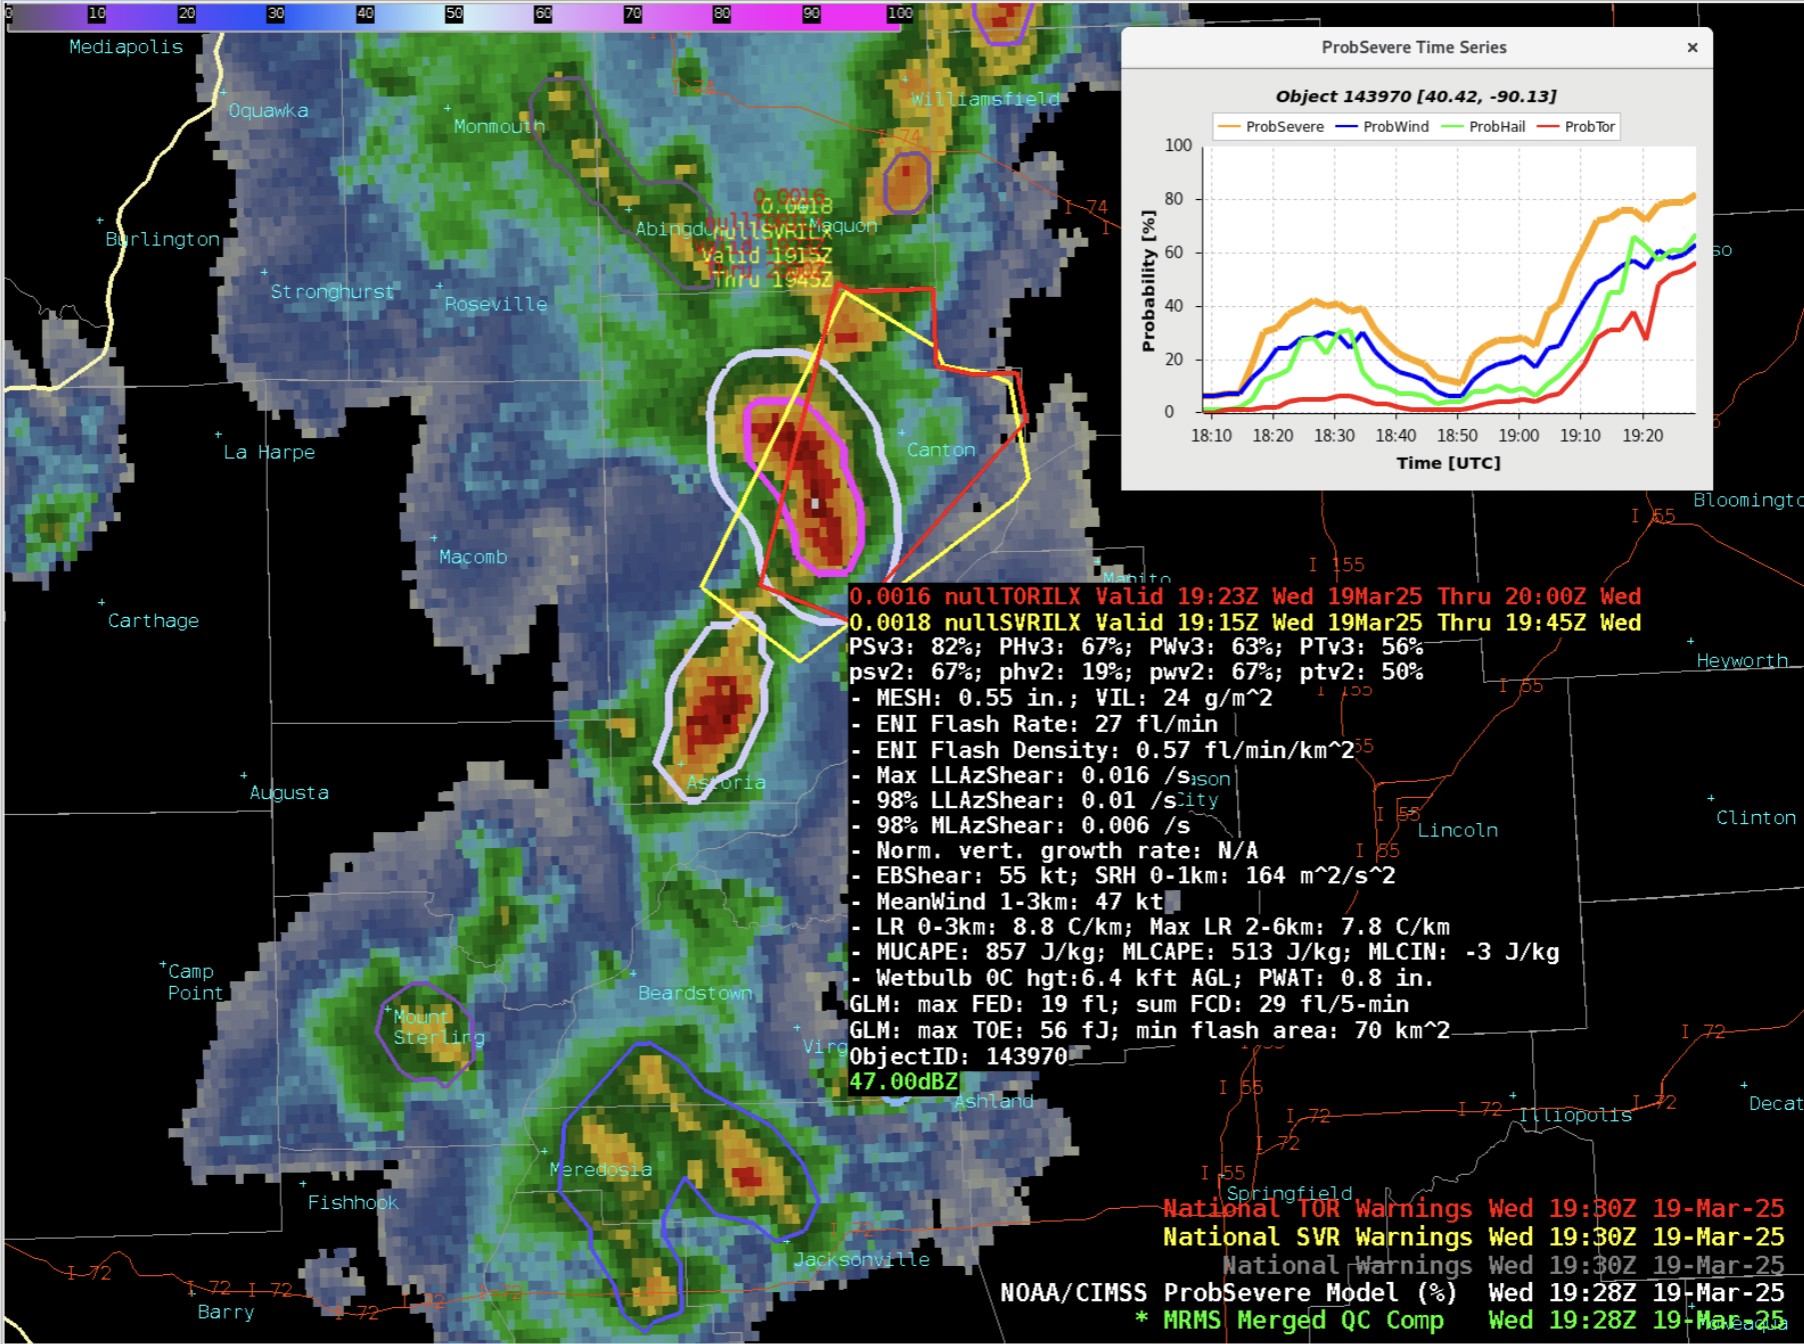
In the animation below, you can see the quickly developing convection and associated ProbSevere v3 contours evolve. The storm that affected Canton, Illinois produced a damaging wind report at 19Z and a tornado report first at 19:30Z.
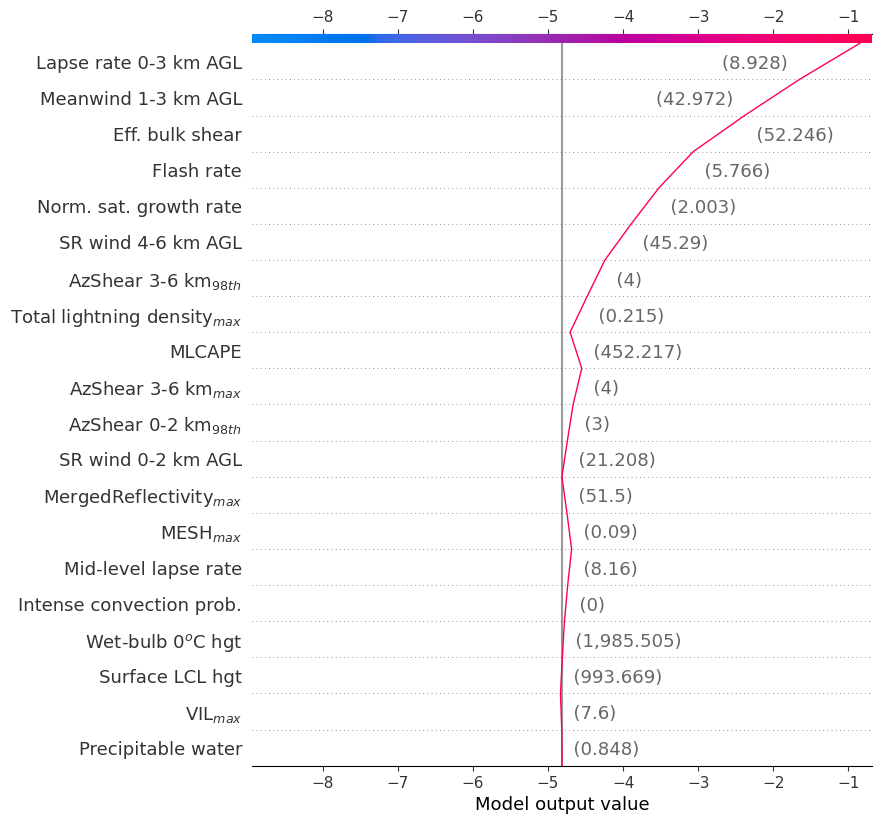
Early on the storm’s development, the satellite growth rate in ProbSevere was quite impactful. At 18:18Z, the moderate growth rate was the 5th most-important predictor.
- Lapse rate 0-3 km (8.9 C/km)
- Mean wind 1-3 km AGL (43 kt)
- Effective bulk shear (52 kt)
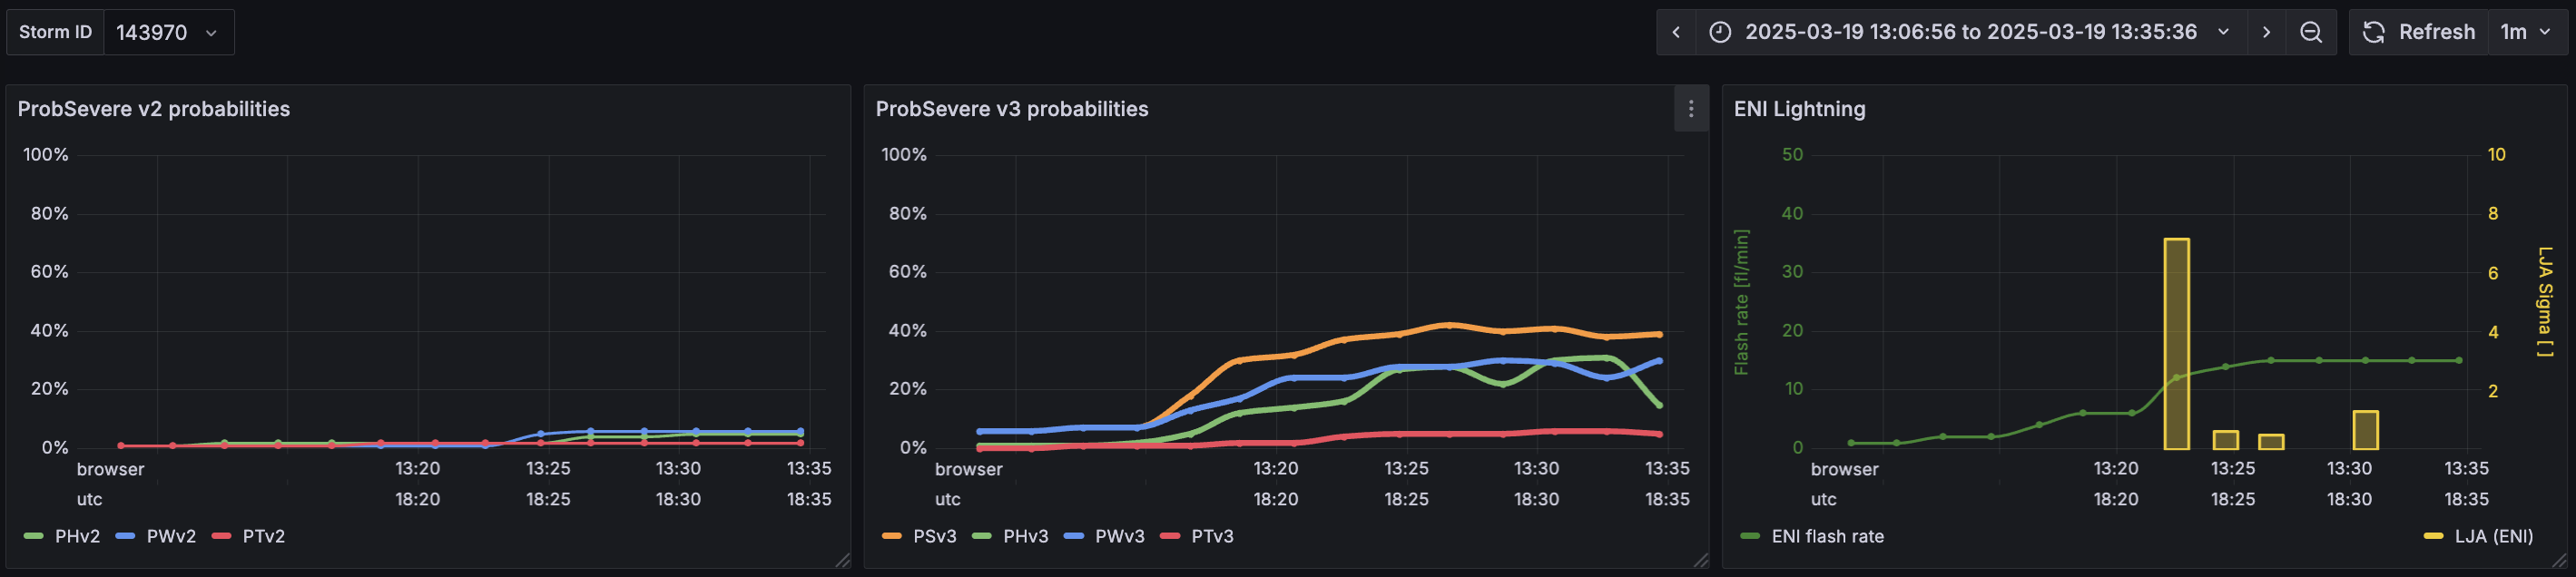
- Total lightning flash rate (6 fl/min)
- Satellite growth rate (2%/min)
Along with all of the other predictors, this generated a probability of severe of 30%. As an experiment, when we artificially made the satellite growth rate 0, the probability fell to 14%. The satellite growth rate has the most impact on storms during the development phase of convection. Once convection is more mature, the deep-learning-based IntenseStormNet predictor (which uses images of ABI and GLM fields as inputs) is the more important satellite feature in the ProbSevere v3 models.
Using the Python SHAP library, we created a “decision” plot to visually see how different predictors in the model affected the final prediction. The bar on the top and bottom is in “log-odds-space”, which allows us to see meaningful deflections of the predictors. That is, the deflections are all proportional to their importance on the final prediction. Rightward deflections increase the probability of severe whereas leftward deflections decrease the final probability. The satellite growth rate was about as important as the flash rate for this storm at this time.
Shortly after 18:18Z, a strong lightning jump also boosted the probability of severe to about 40%. About 35 minutes later, damaging wind was report. Interestingly, the moderate satellite growth rate did not boot the ProbSevere v2 probability, probability because the meager radar and lightning predictors were squashing the probability overall. However, the ProbSevere v3 models are gradient-boosted decision trees, and appear to utilize the satellite data more skillfully (as well as other inputs) than the previous version.
The probability of tornado began ramping up in this storm around 19:10Z, hitting 56% at the time of the first tornado report (19:30Z), which is a very high value for ProbTor v3. In the AWIPS display below, a user’s mouse “hovering” over the ProbSevere object produces the pop-up text. This text provide forecasters the exact probabilities and select predictor values. A time series of the probability values opens up when a user double-clicks on the storm object. These visualization features help forecasters quickly interrogate severe or tornadic threats, which is particularly important during busy severe-weather situations.