We get letters, MODIS True Color Edition
Sometimes, CIMSS Blog writers get emailed letter, like the one below (anonymized) forwarded along to CIMSS with a request
A long-dormant idea has resurrected itself in my mind, which is to look into the “biomass and carbon impact” (e.g. biomass and carbon knocked down) from some MCS and derecho type events.  We may have talked about this briefly some years ago.  Since we share an interest in NW PA, I thought I would ask if you know of any maps or diagrams that would show the affected area from the July 21, 2003 wind event…..of course it produced the tornado that brought down the Kinzua Bridge, but the event itself was much more widespread....

.....Is there an archived database of satellite imagery that would show the damage in NW Pennsylvania from the 21 July 2003 storm?
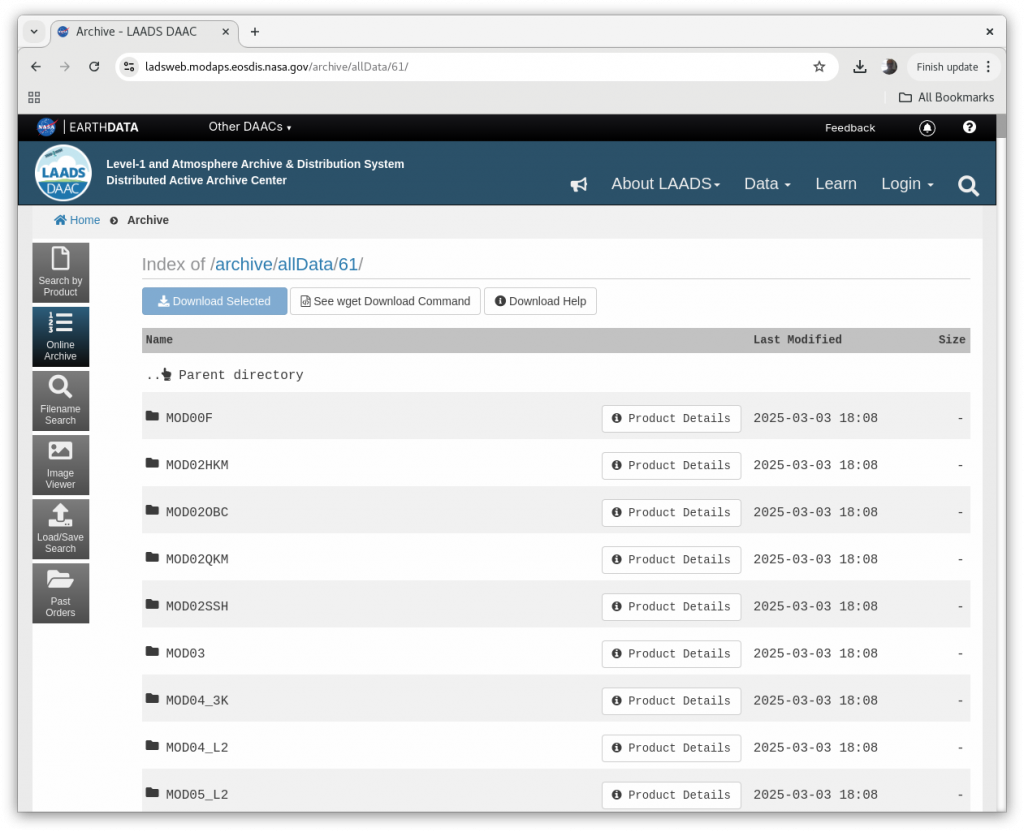
Your blogger first thought of the MODIS Today website — but those images “only” go back to late 2007. There are data sources that allow a reconstruction of those images, however. The big challenge in accessing MODIS data from long ago is knowing when Terra (or Aqua) overflew northwest Pennsylvania, where the Kinzua Viaduct once stood. The CIMSS Polar Orbit Tracking website (https://www.ssec.wisc.edu/datacenter/polar_orbit_tracks/) includes an archive for satellites, so it’s easy to find where Terra was flying on 19 July, 20 July, 21 July, … , 27 July (and other dates too, of course), allowing someone to identify the times of data needed. I’m looking at series of days because I don’t recall cloud conditions over northwest Pennsylvania from back in 2003! The NASA LAADS website (https://ladsweb.modaps.eosdis.nasa.gov/) contains the level-1b hdf files that can be used to create imagery. (This is also discussed in this blog post for imagery over the Himalayas). For this blog post, I searched for Level-1b files ( https://ladsweb.modaps.eosdis.nasa.gov/missions-and-measurements/science-domain/modis-L0L1/ ) and downloaded hdf files containing data to be displayed with polar2grid software. The data needed to construct true-color imagery include quarter-kilometer data (MOD02QKM), half-kilometer data (MOD02HKM) and georeferencing data (MOD03), as shown at the website below (accessible from this link). Each of those folders will have annual and then daily folders to enter; the daily files are 5-minute granules that are matched to times in the polar orbit tracks at the CIMSS website.
Day 207 files (that is, 26 July 2003) that include Kinzua are shown below. Here are the MODIS paths on that day; note the location of 1630 and 1635 UTC on that map!
MOD02HKM.A2003207.1630.061.2017194224505.hdf
MOD02HKM.A2003207.1635.061.2017194225024.hdf
MOD02QKM.A2003207.1630.061.2017194224505.hdf
MOD02QKM.A2003207.1635.061.2017194225024.hdf
MOD03.A2003207.1630.061.2017194181034.hdf
MOD03.A2003207.1635.061.2017194180729.hdf
I downloaded the data from LAADS for multiple days. To display the imagery, polar2grid (free unix-based software from CIMSS available here) is used. First, a geographic location is established for polar2grid:
./p2g_grid_helper.sh Kinzua -78.6 41.8 250 -250 1120 840 > Kinzua.yaml
That polar2grid command creates gridding information for an 1120×840 grid centered at 41.8oN, 78.6oW with 250-m resolution in the n-s and e-w directions. The polar2grid command to create a true_color image and then to place borders, coastlines, and a lat/lon grid are shown below.
./polar2grid.sh -r modis -w geotiff -p true_color -g Kinzua --grid-configs ./Kinzua.yaml -f /path/to/downloadedfiles/Kinzua/206/*.hdf ./add_coastlines.sh --add-borders --borders-resolution f --add-coastlines --coastlines-resolution f --add-grid --grid-D 1.0 1.0 --grid-d 1.0 1.0 --grid-text-size 12 terra_modis_true_color_20030726_??????_Kinzua.tifThe imagery created is below.

An animation from 19-27 July 2003 is shown below. An abundance of clouds is obvious. Perhaps days later in July, or in August, will show clearer skies! Still, a difference field between 19 and 25 July (that is, before and after the Kinzua destruction) might show something. A toggle between those two dates is at the bottom of this blog post.


Thanks to Kathy Strabala, SSEC/CIMSS, for reminding me about the LAADS data source. A next step for anyone wanting to look at that region would be to access Landsat data and hope for clearer skies.