Grampians bushfire in southeast Australia produces a pyrocumulonimbus cloud

JMA Himawari-9 “Red” Visible (0.64 µm, top), Shortwave Infrared (3.9 µm, center) and “Clean” Infrared Window (10.4 µm, bottom) images from 0300-0510 UTC on 4th February, with plots of surface reports at Melbourne YMML [click to play animated GIF | MP4]
Himawari-9 True Color RGB images created using Geo2Grid (below) displayed the pyroCb cloud that was being transported southeastward — and dense smoke (shades of tan) was evident in the vicinity (and immediately downwind) of the Grampians bushfire.

JMA Himawari-9 True Color RGB images, from 0250-0600 UTC on 4th February [click to play animated GIF | MP4]

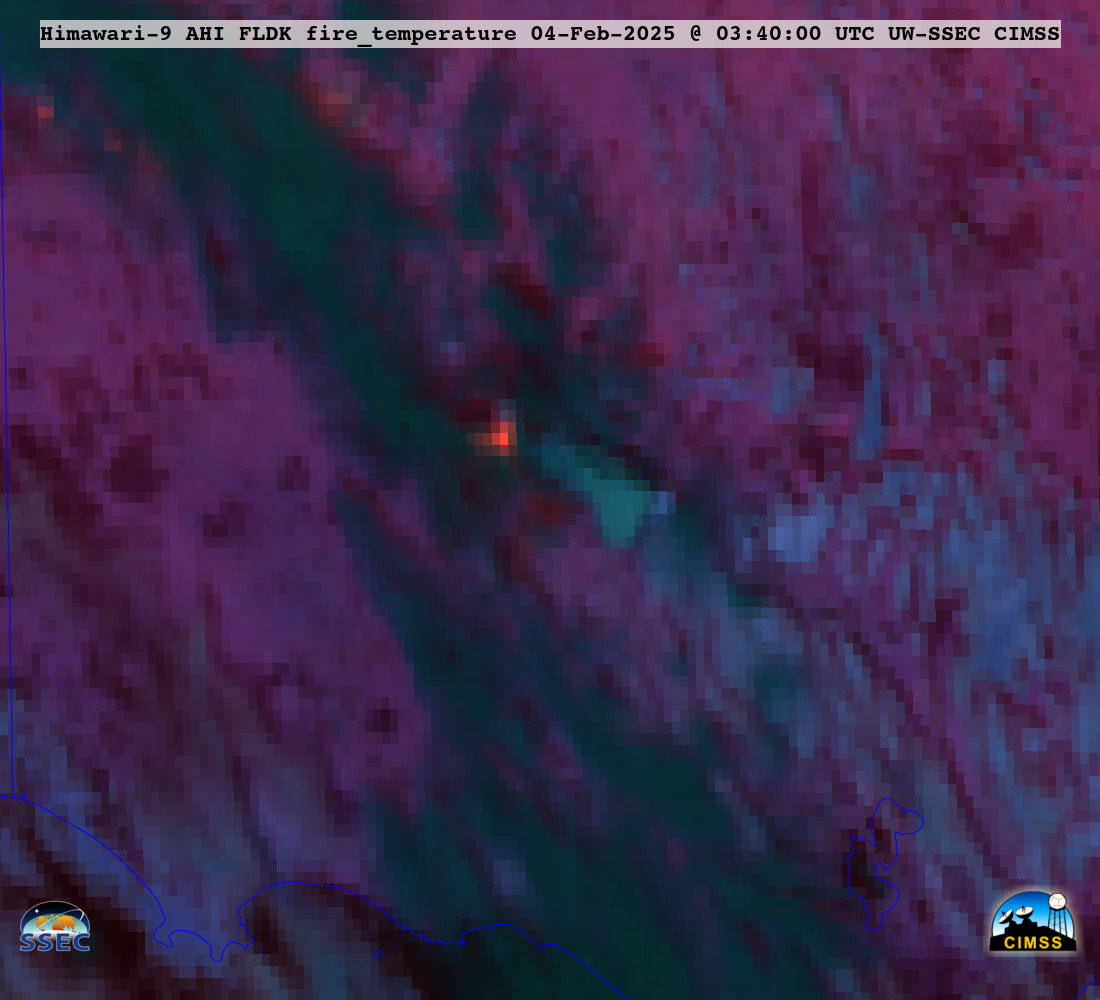
Himawari-9 Fire Temperature RGB images, from 2100 UTC on 3rd February to 1100 UTC on 4th February [click to play animated GIF | MP4]