Severe thunderstorms across Hawai’i
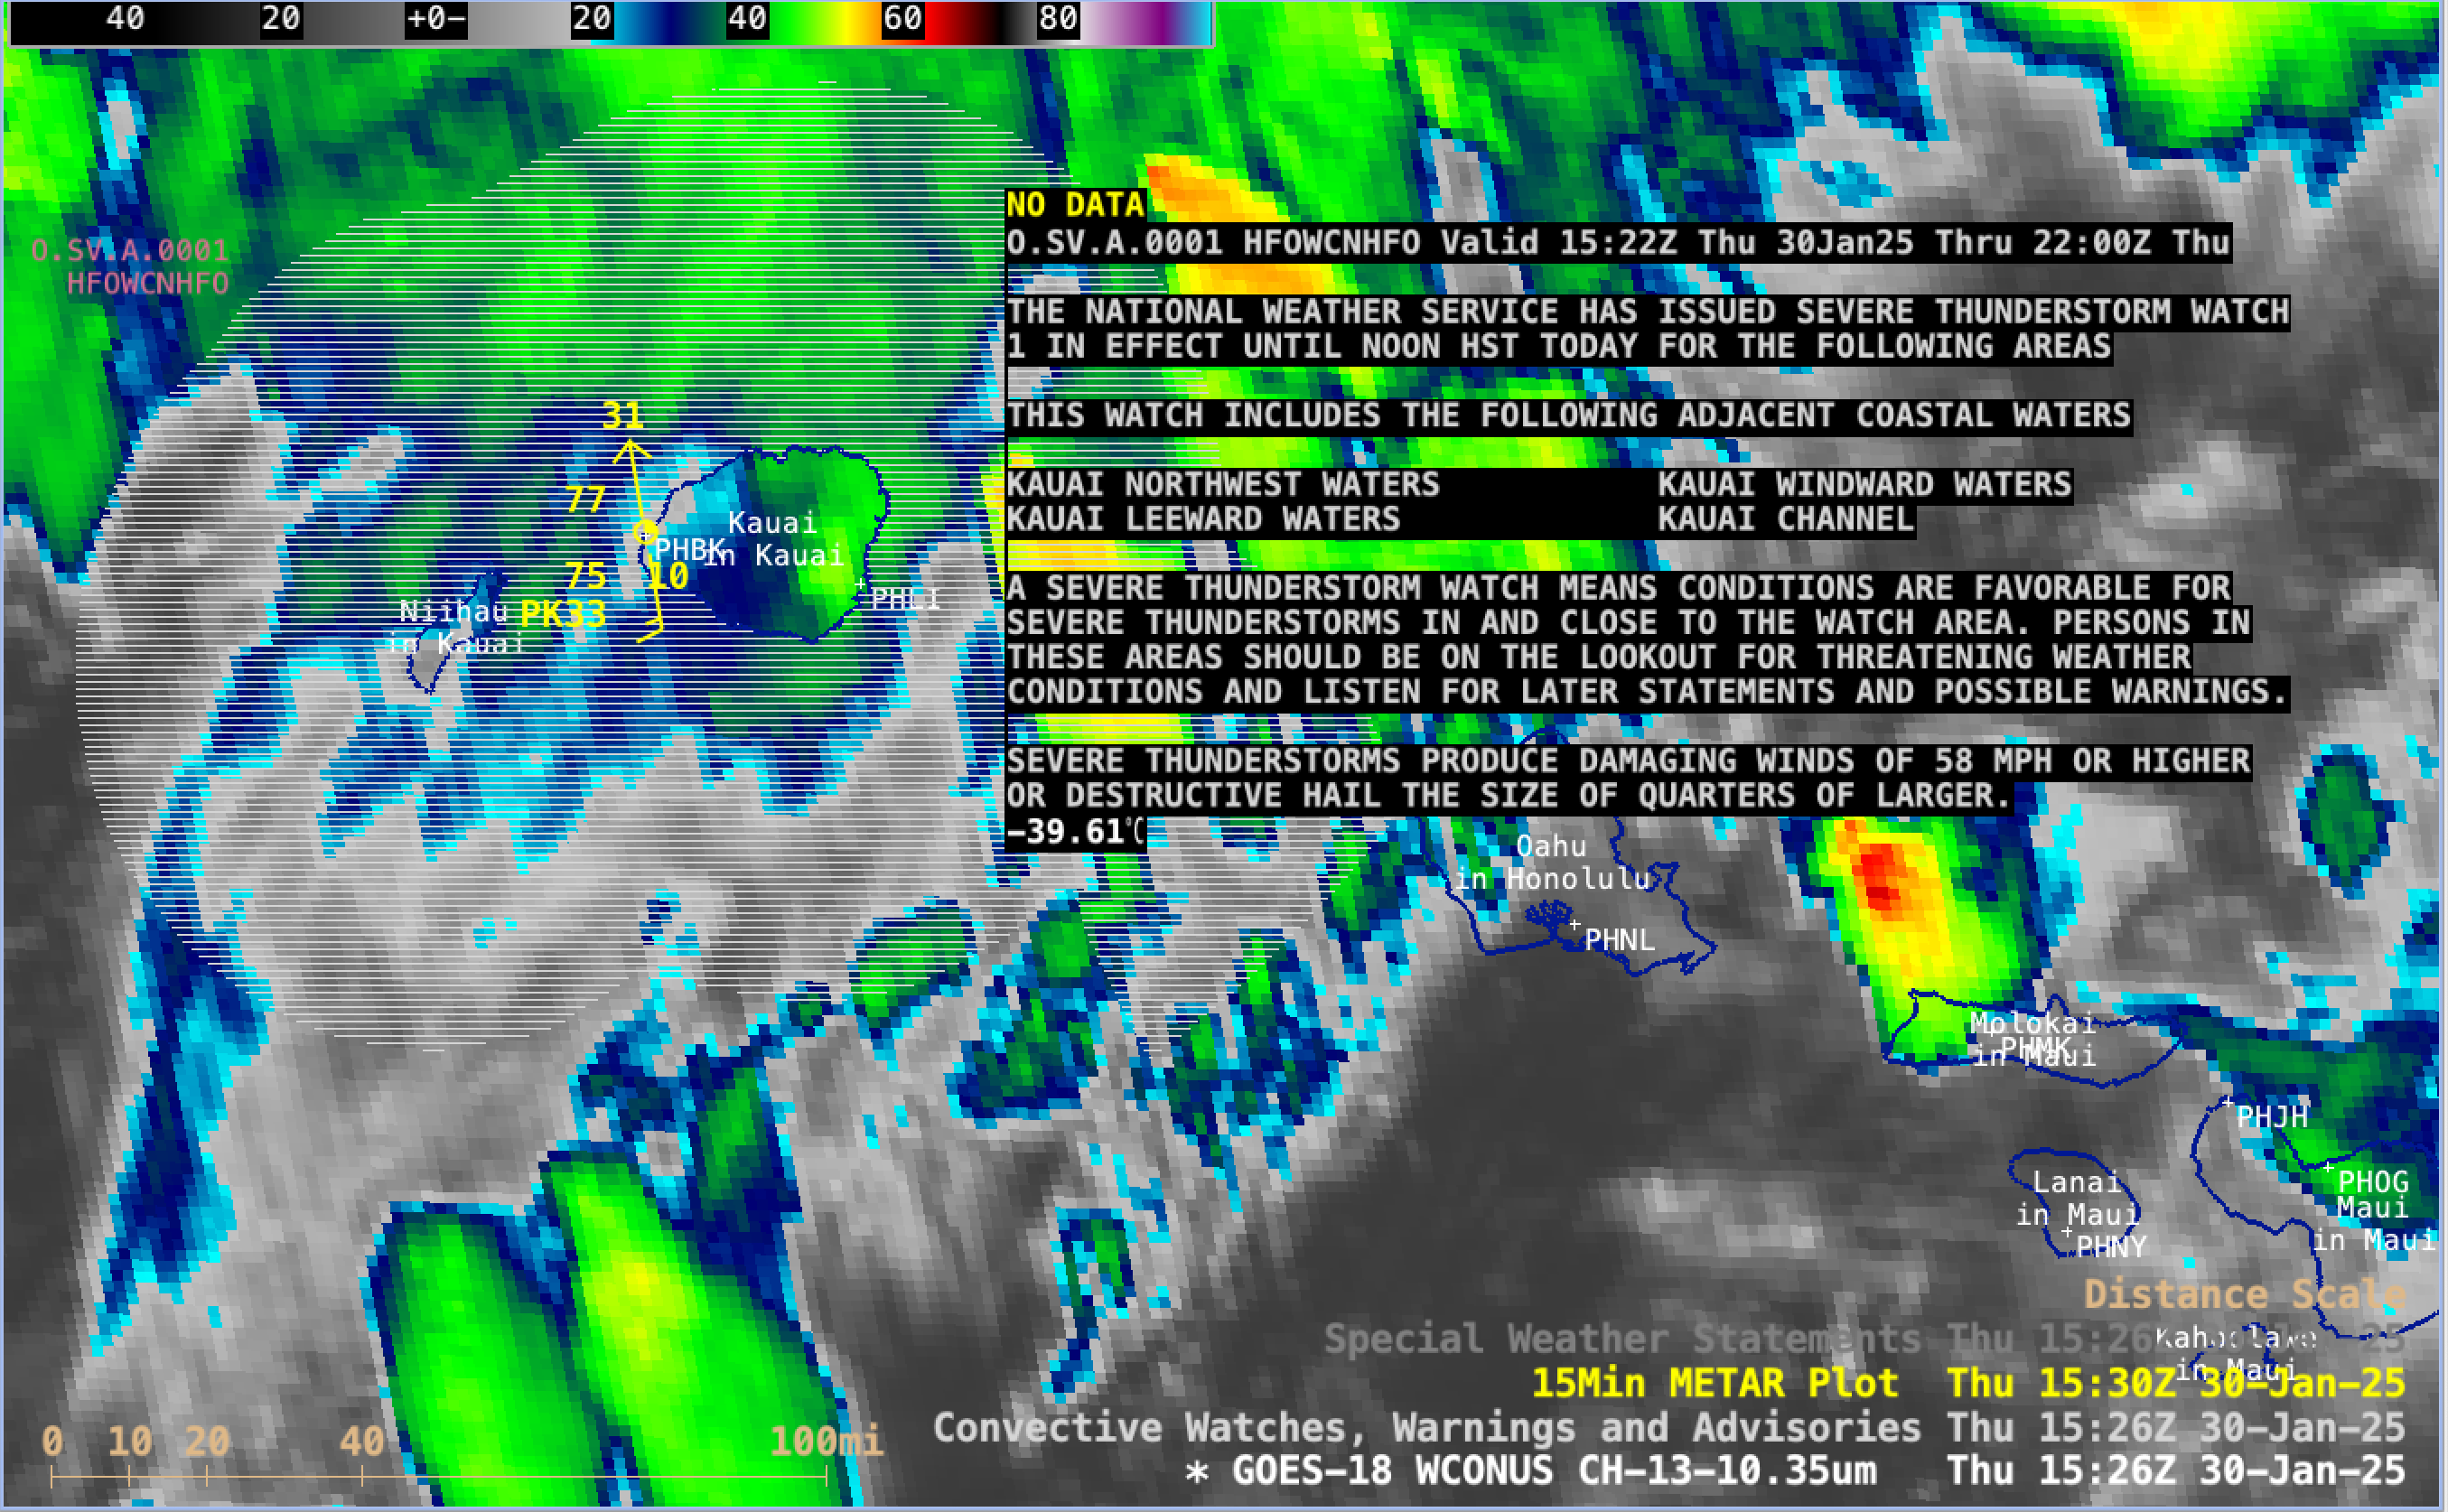
GOES-18 Clean Window Infrared (10.3 µm) image at 1528 UTC, with a cursor sample of the Severe Thunderstorm Watch [click to enlarge]
5-minute GOES-18 Clean Infrared Window (10.3 µm) images, from 1106 UTC on 30th January to 0901 UTC on 31st January [click to play MP4 animation]
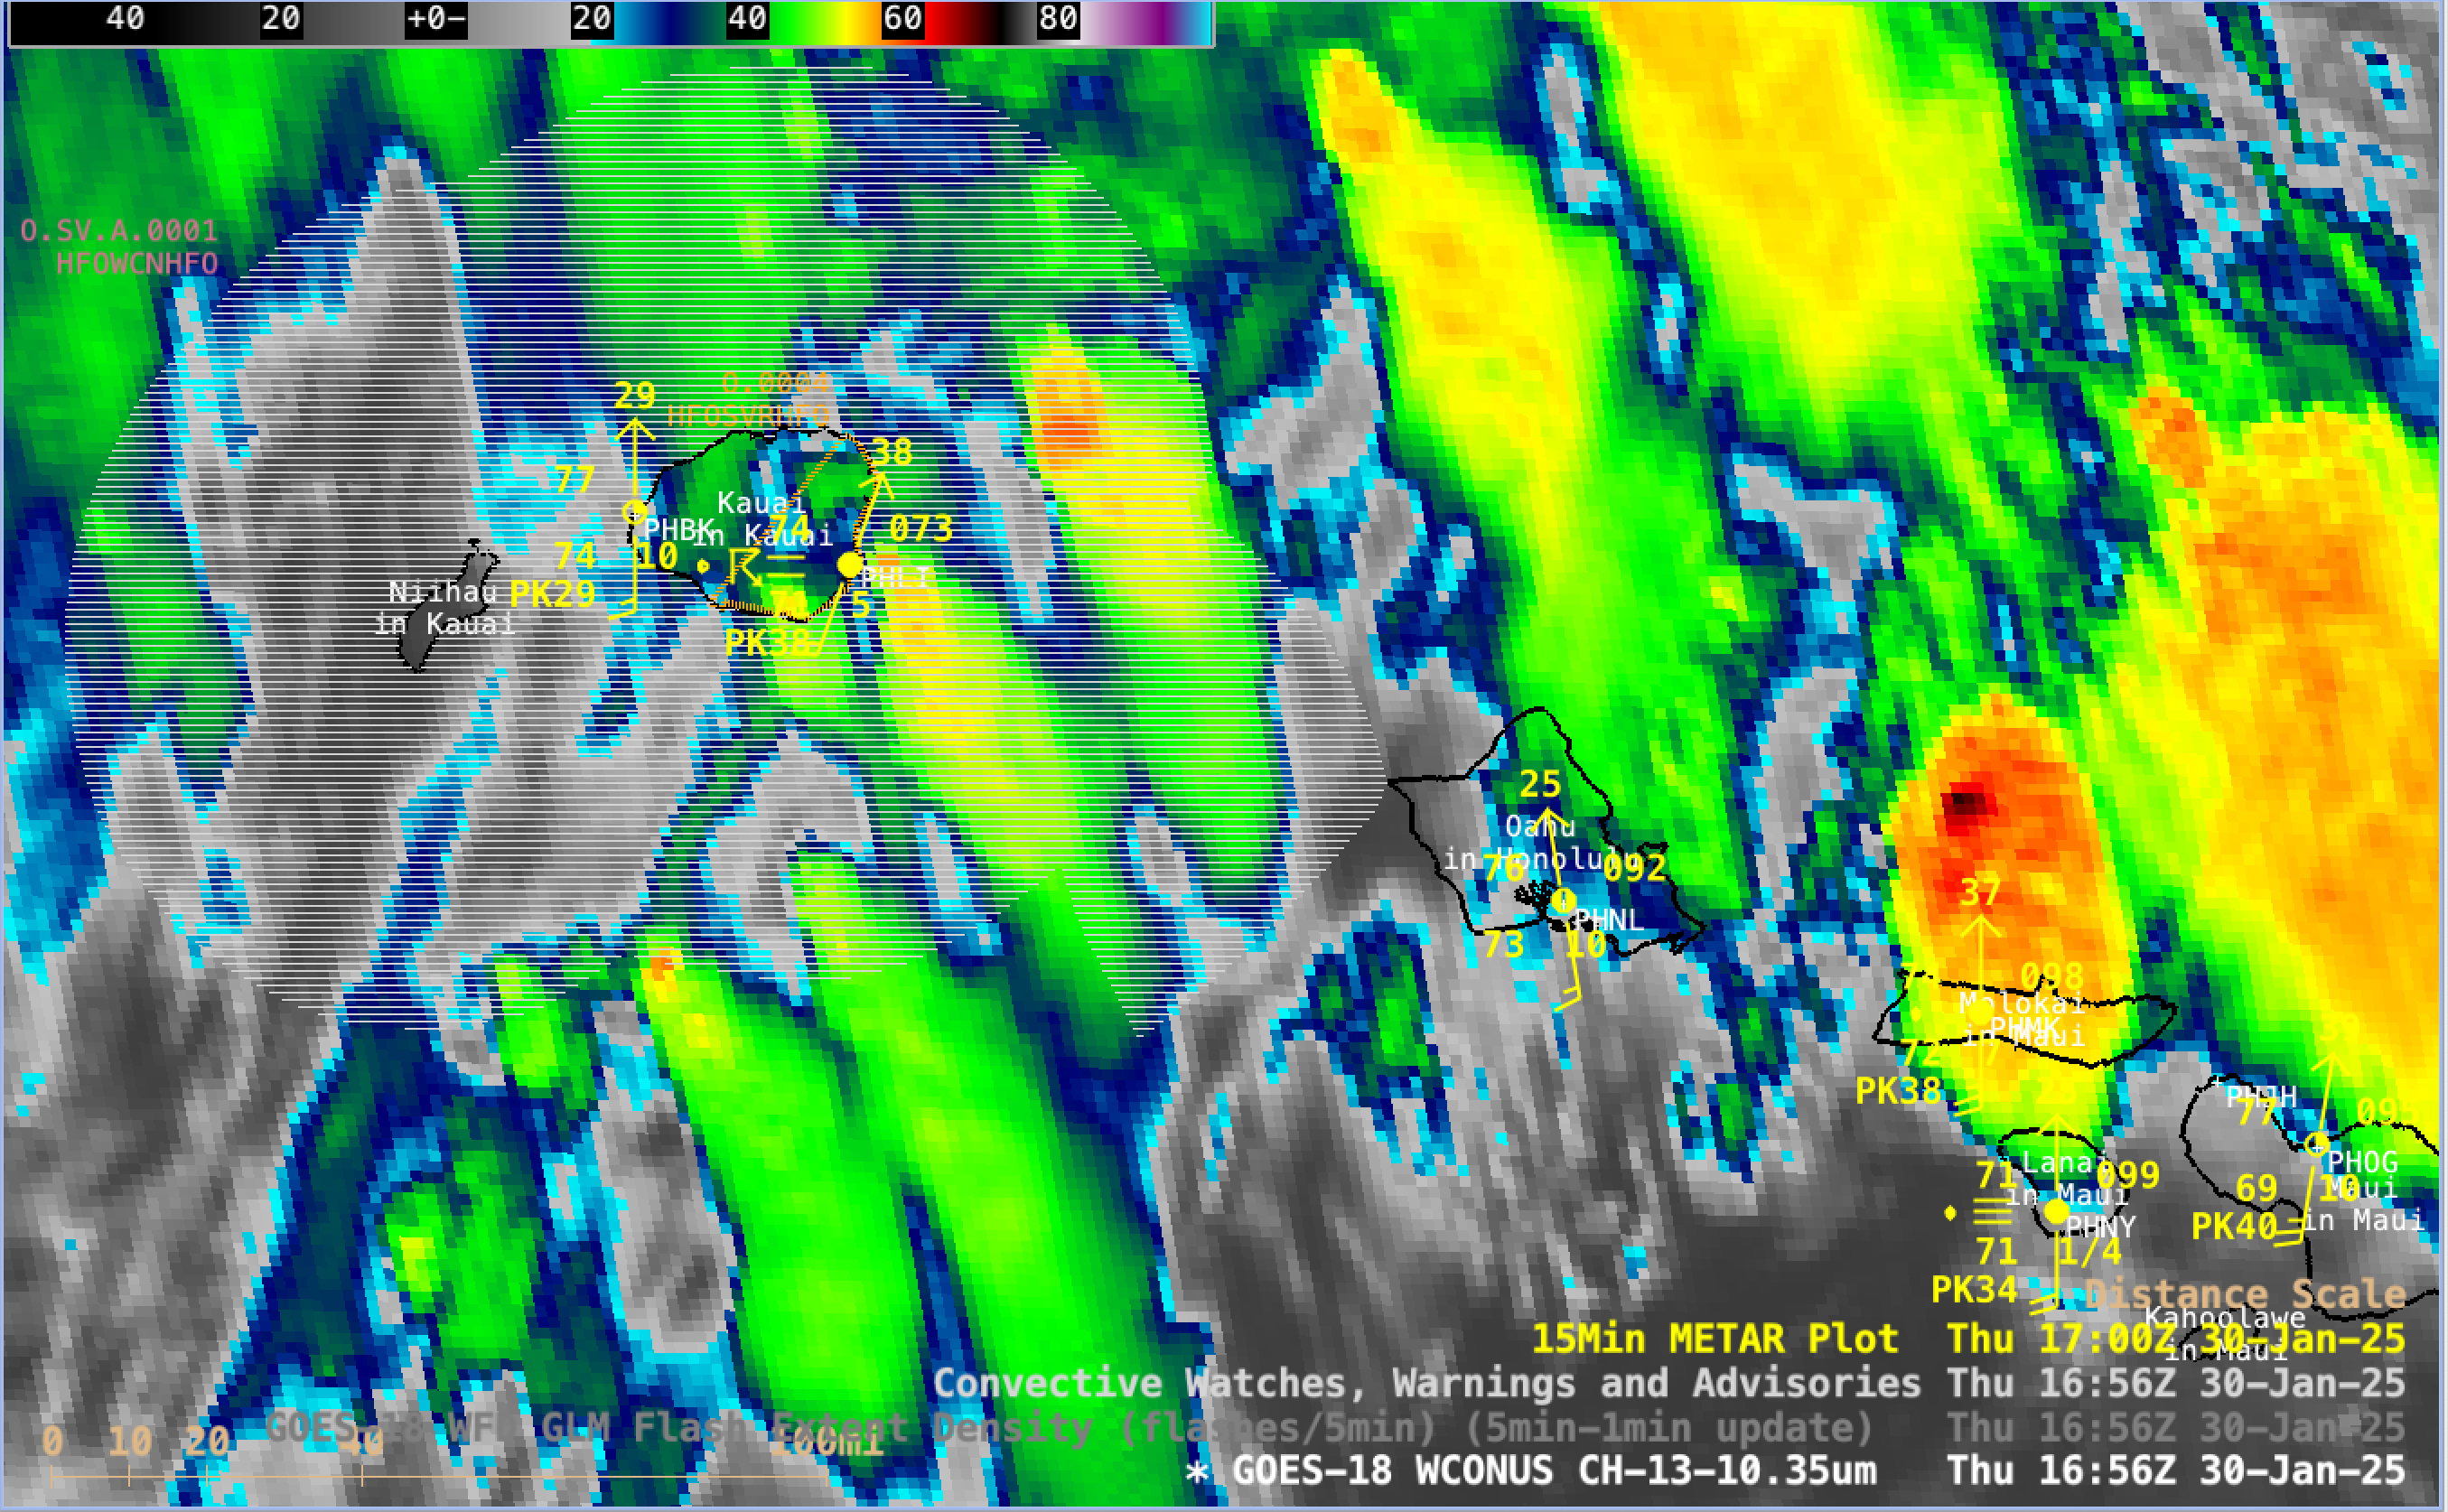
A corresponding animation of GOES-18 Infrared images with an overlay of GLM Flash Extent Density (below) displayed the abundant lightning activity associated with these thunderstorms.
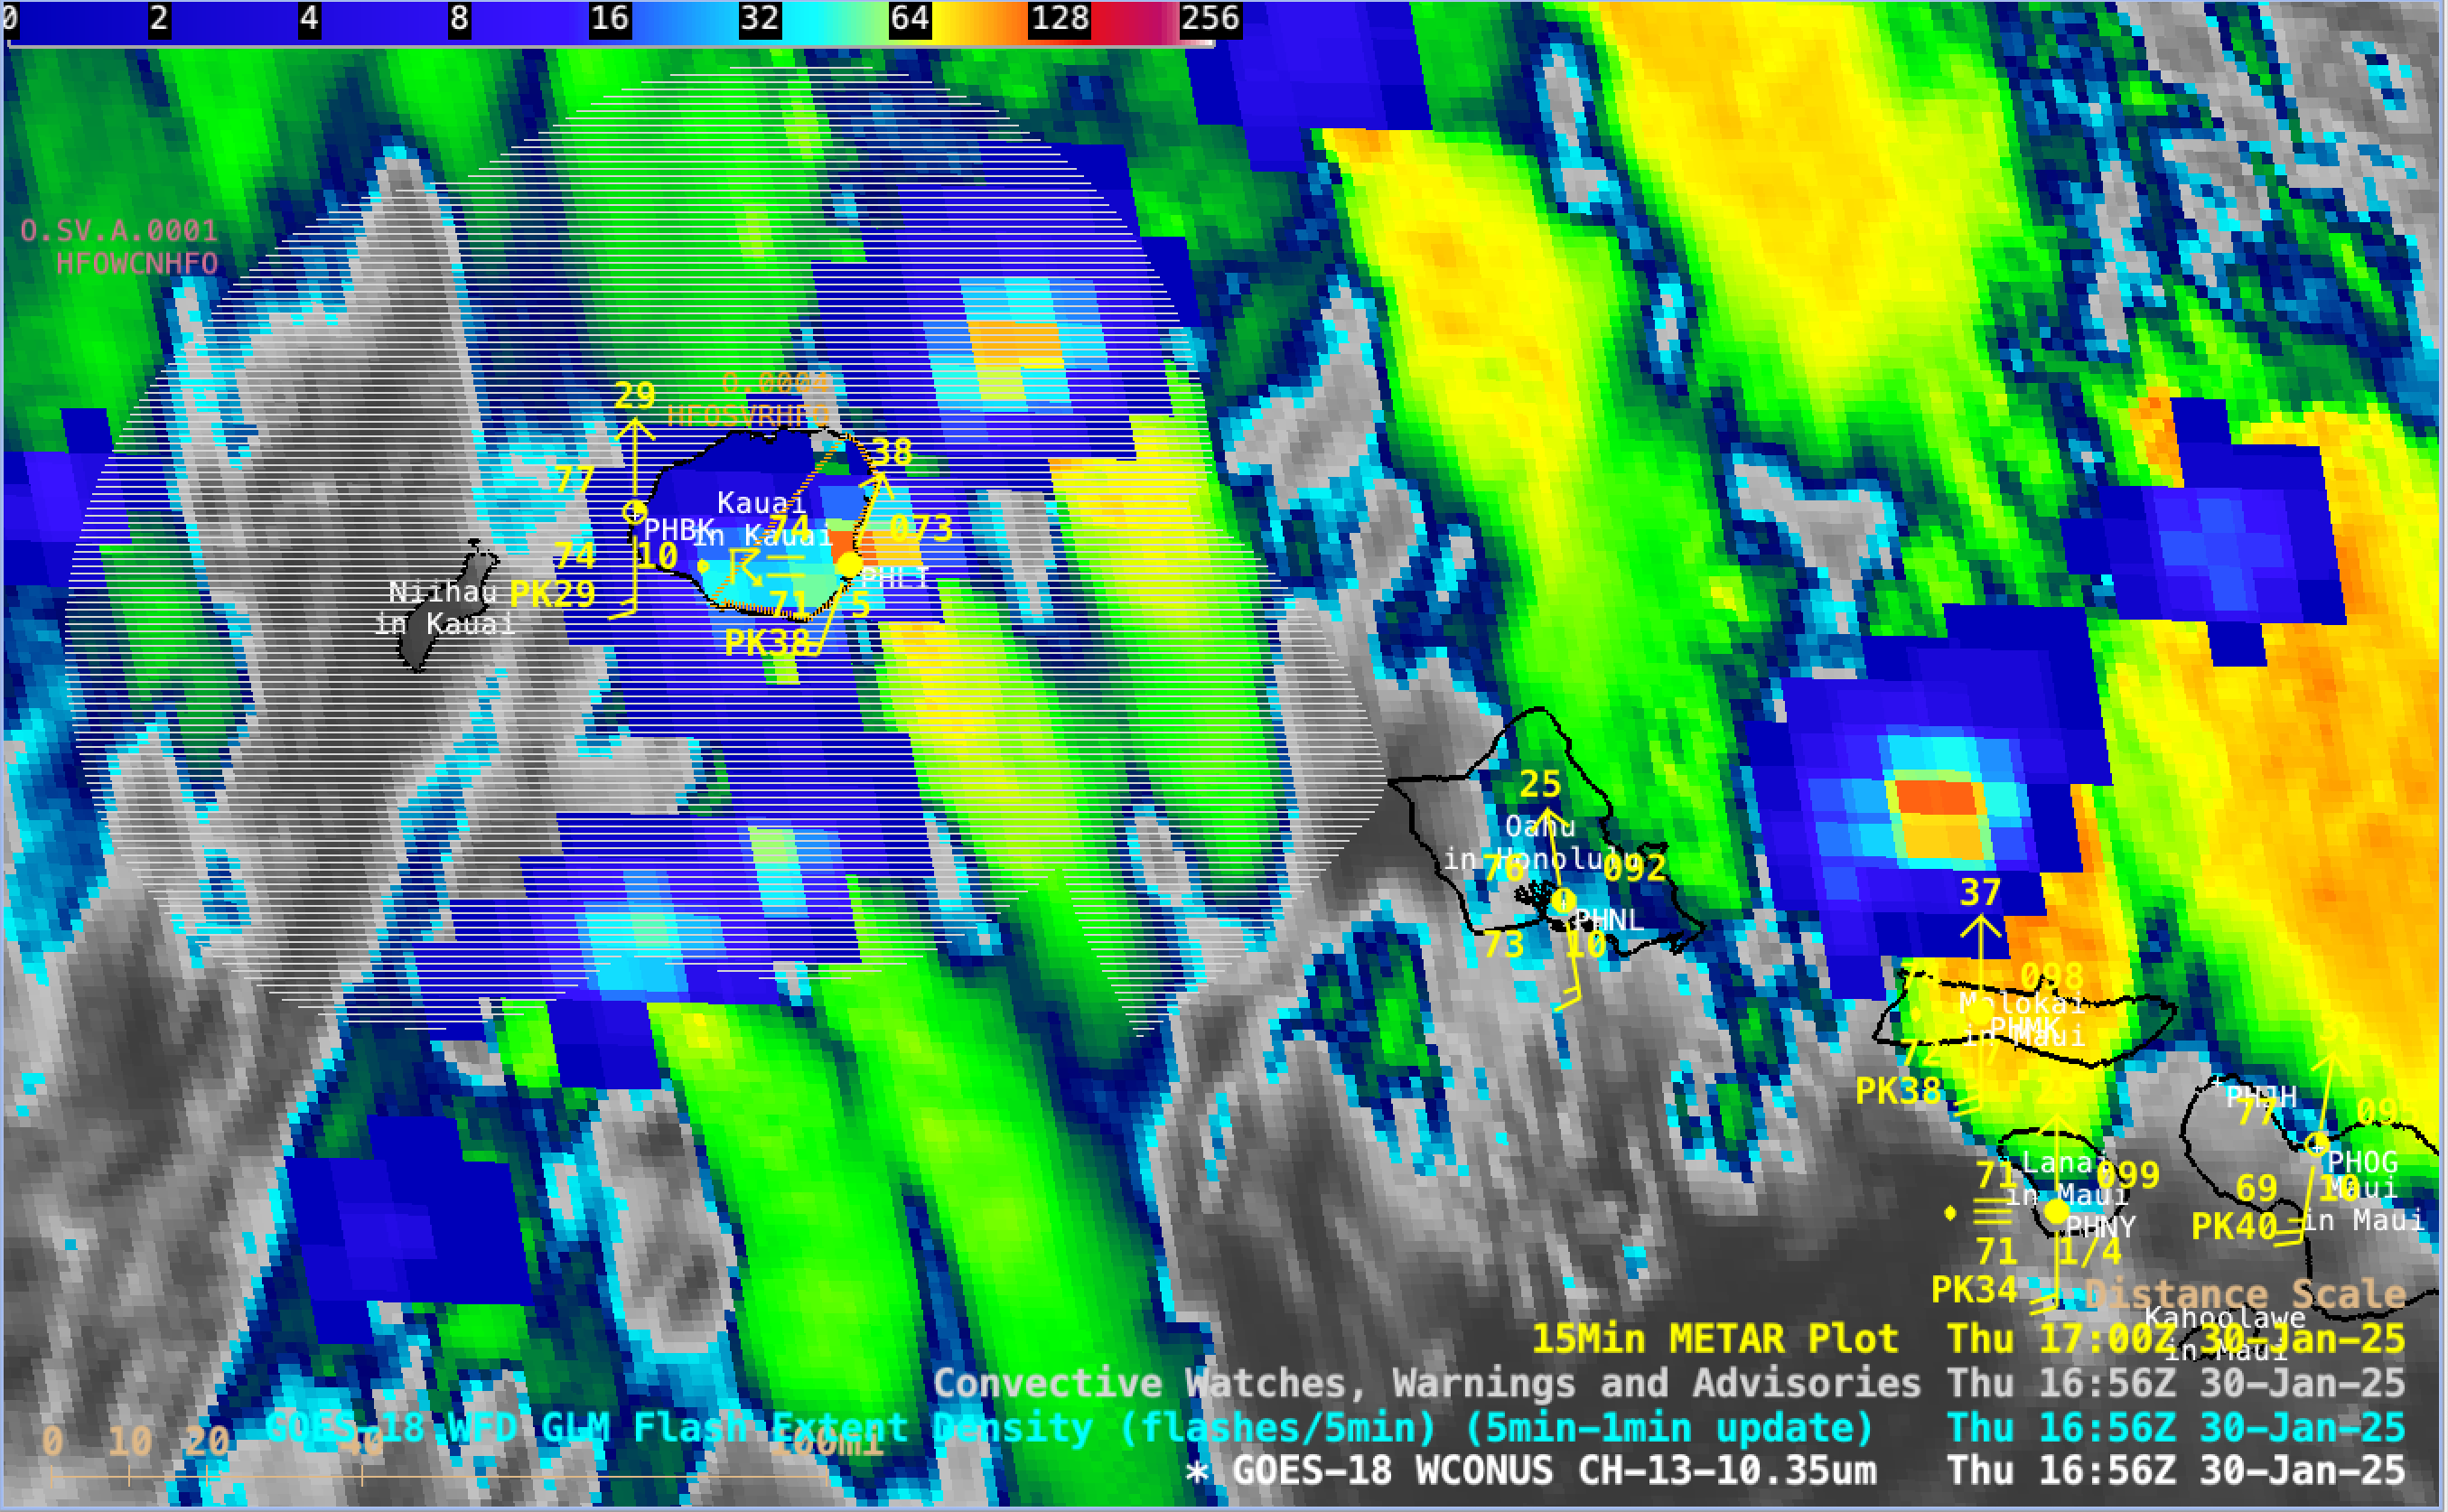
5-minute GOES-18 Clean Infrared Window (10.3 µm) images with an overlay of GLM Flash Extent Density, from 1106 UTC on 30th January to 0901 UTC on 31st January [click to play MP4 animation]
The air mass within the warm sector was also unusually moist — in fact, a new daily record rainfall of 3.57 inches occurred at Honolulu. The Total Precipitable Water (PW) value of 1.98″ derived from Lihue, Kauai rawinsonde data at 1200 UTC on 30th January was a record high value for that date/time, according to the SPC Sounding Climatology site (below).
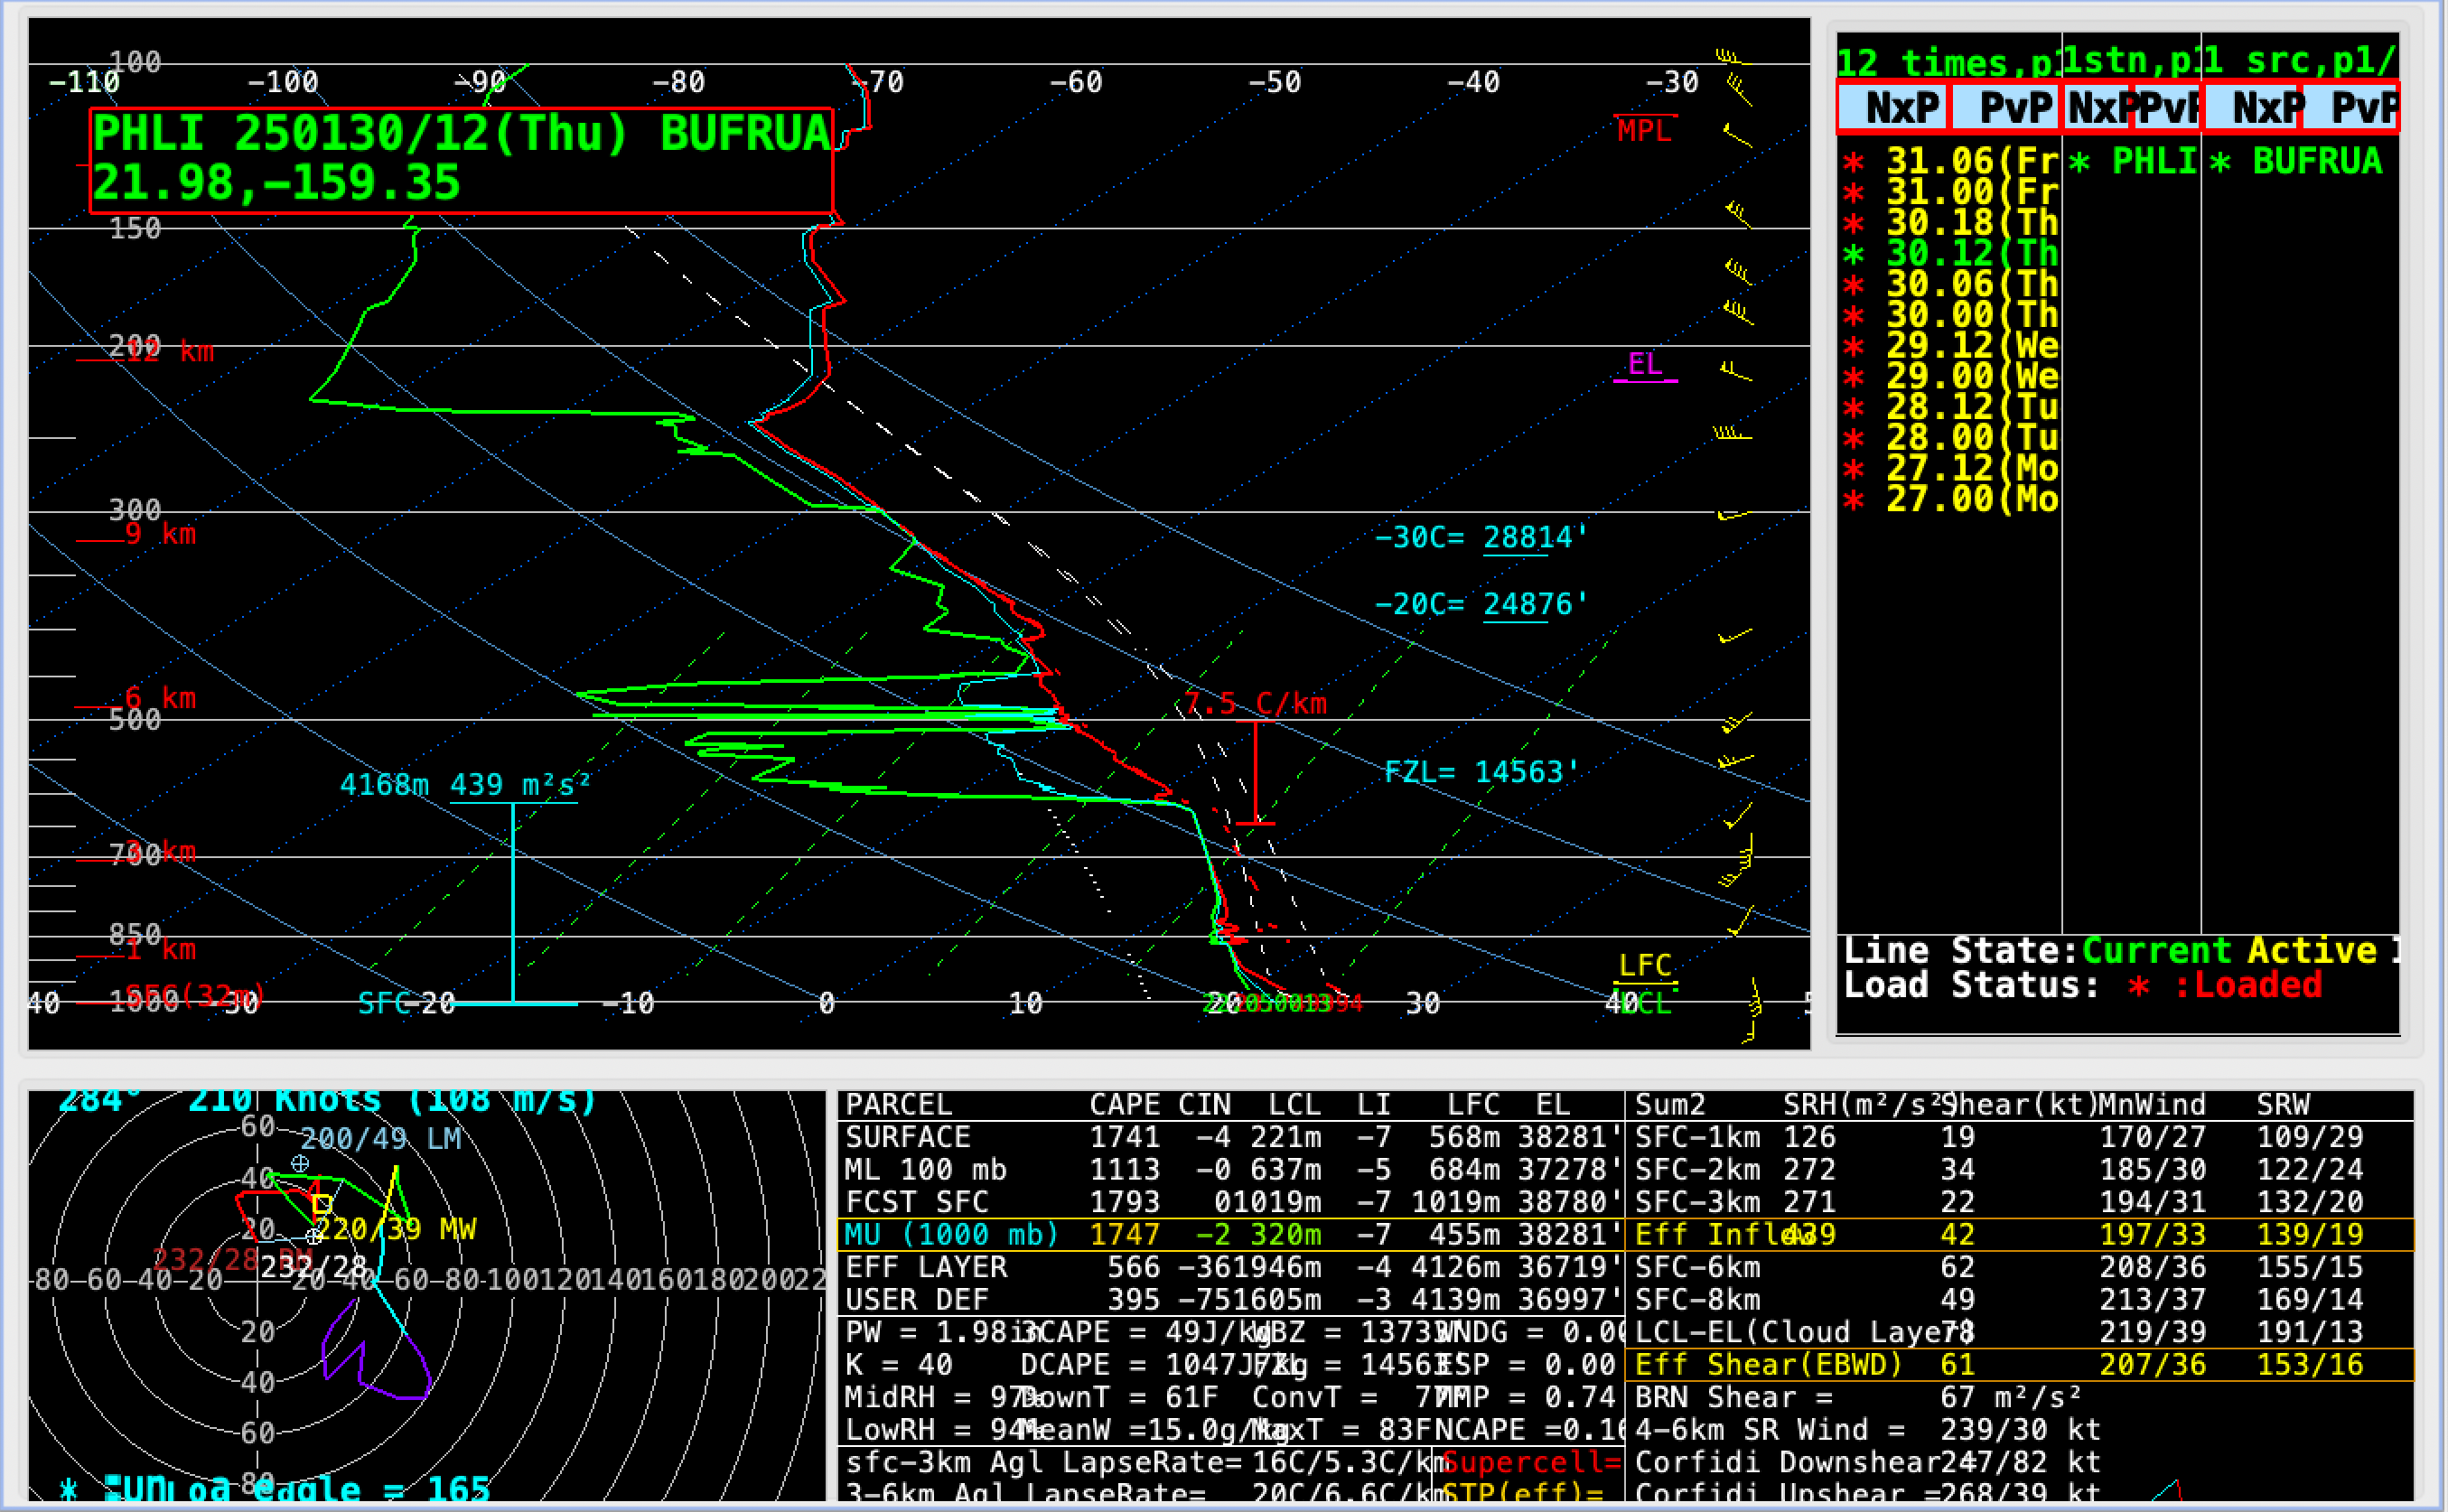
Plot of Lihue rawinsonde data at 1200 UTC on 30th January [click to enlarge]
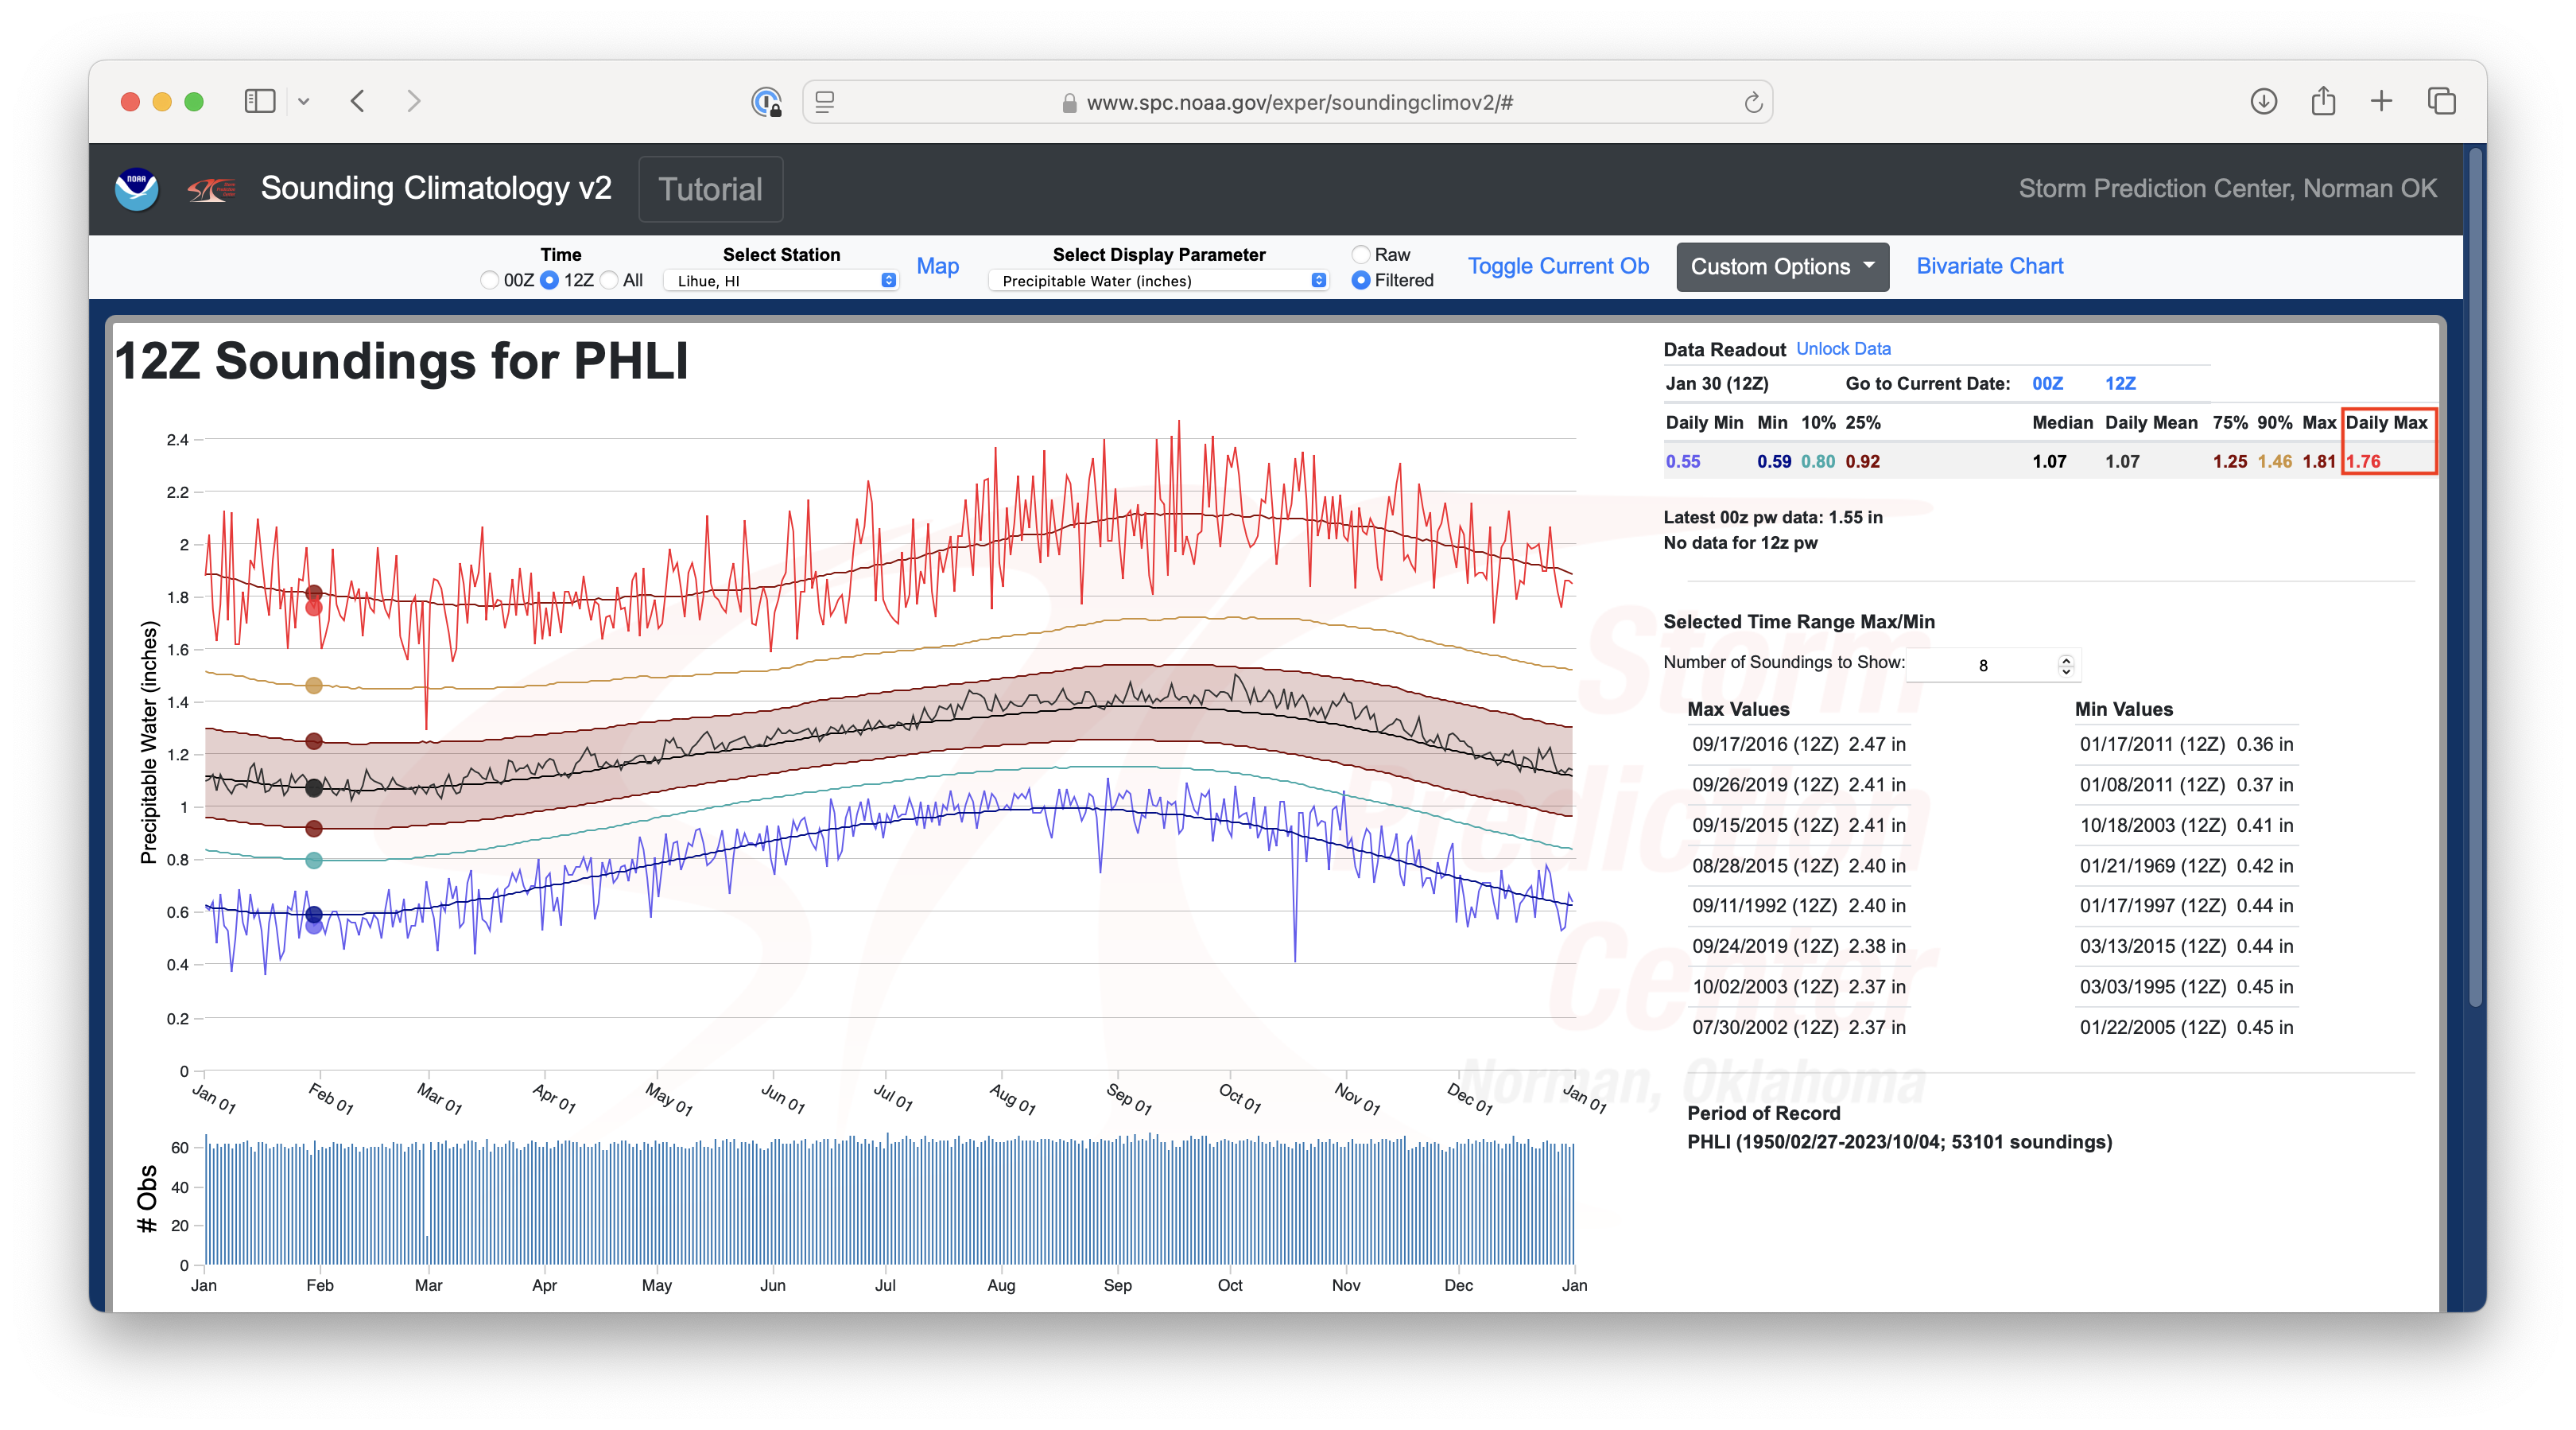
Climatology of Total Precipitable Water for Lihue at 1200 UTC on 30th January [click to enlarge]

Plot of Lihue rawinsonde data at 1800 UTC on 30th January [click to enlarge]