1-minute GOES-18 imagery to monitor Flash Flooding potential across American Samoa
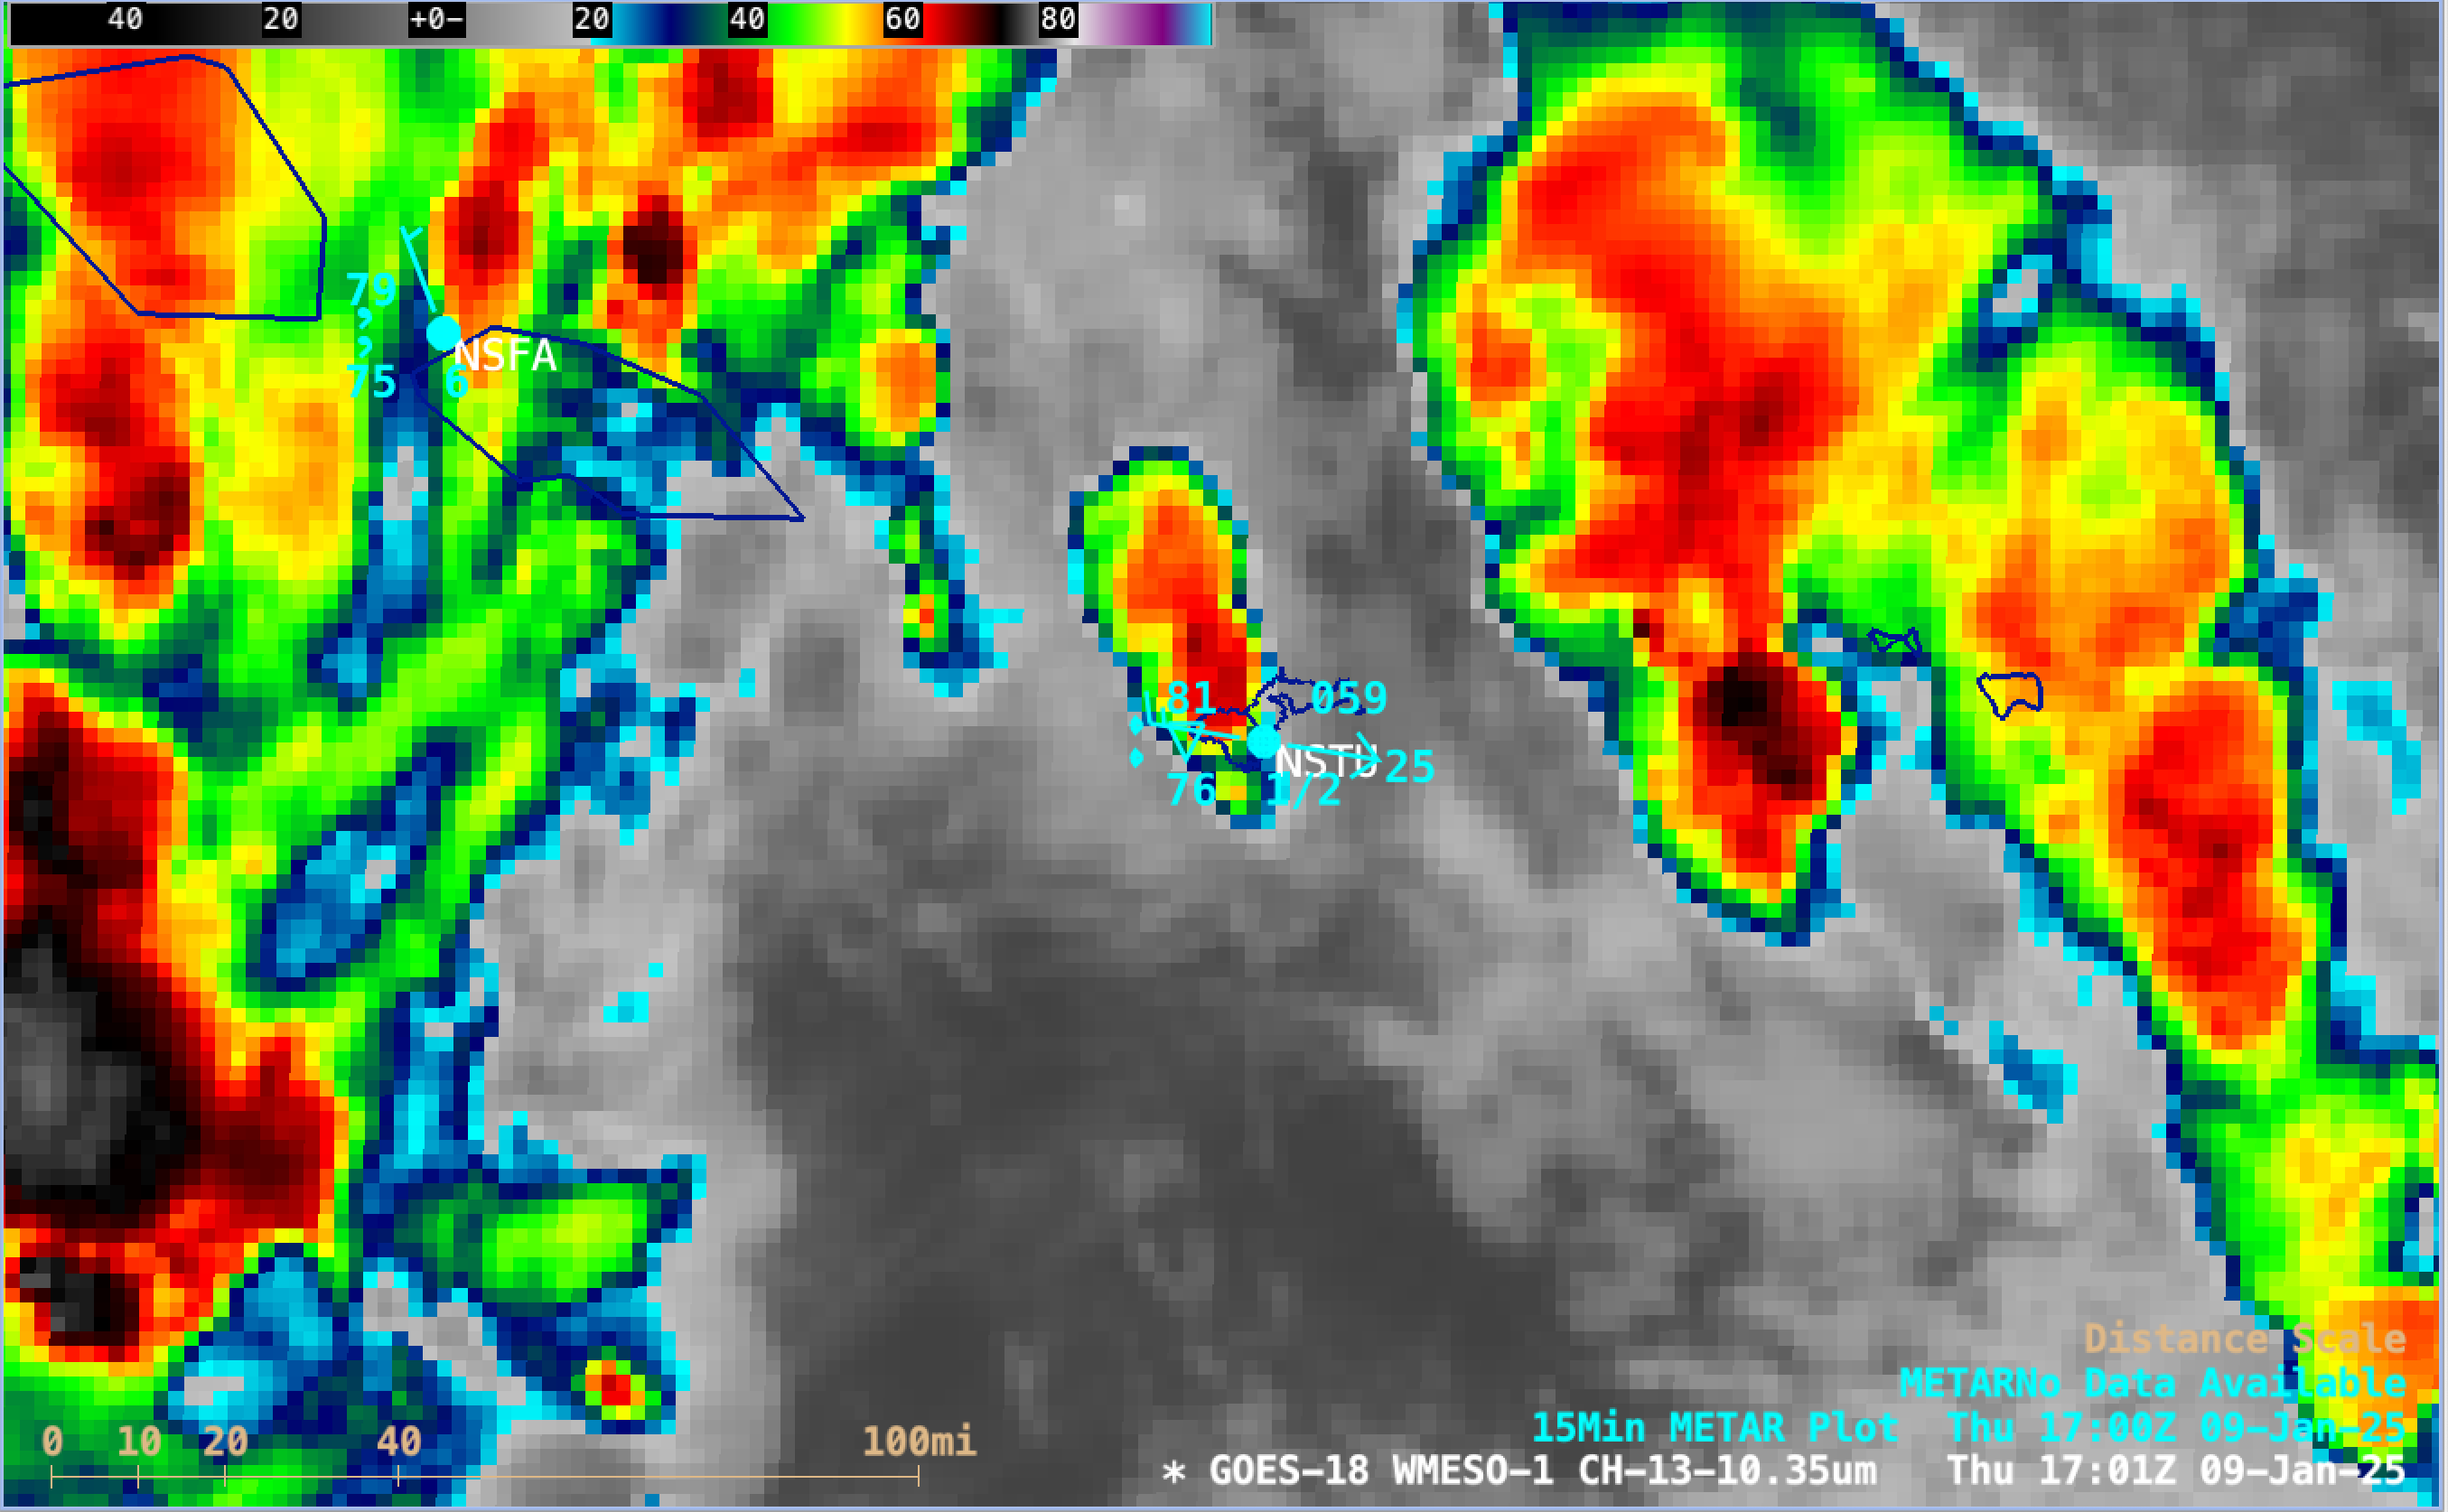
1-minute GOES-18 Clean Infrared Window (10.3 µm) images, from 0300-2300 UTC on 9th January [click to play MP4 animation]
The GOES-18 Infrared image at 2100 UTC (below) included cursor samples of the Cloud Top Temperature, Cloud Top Height and Rain Rate Level 2 derived products for an area of convection that was approaching the island of Tutuila.
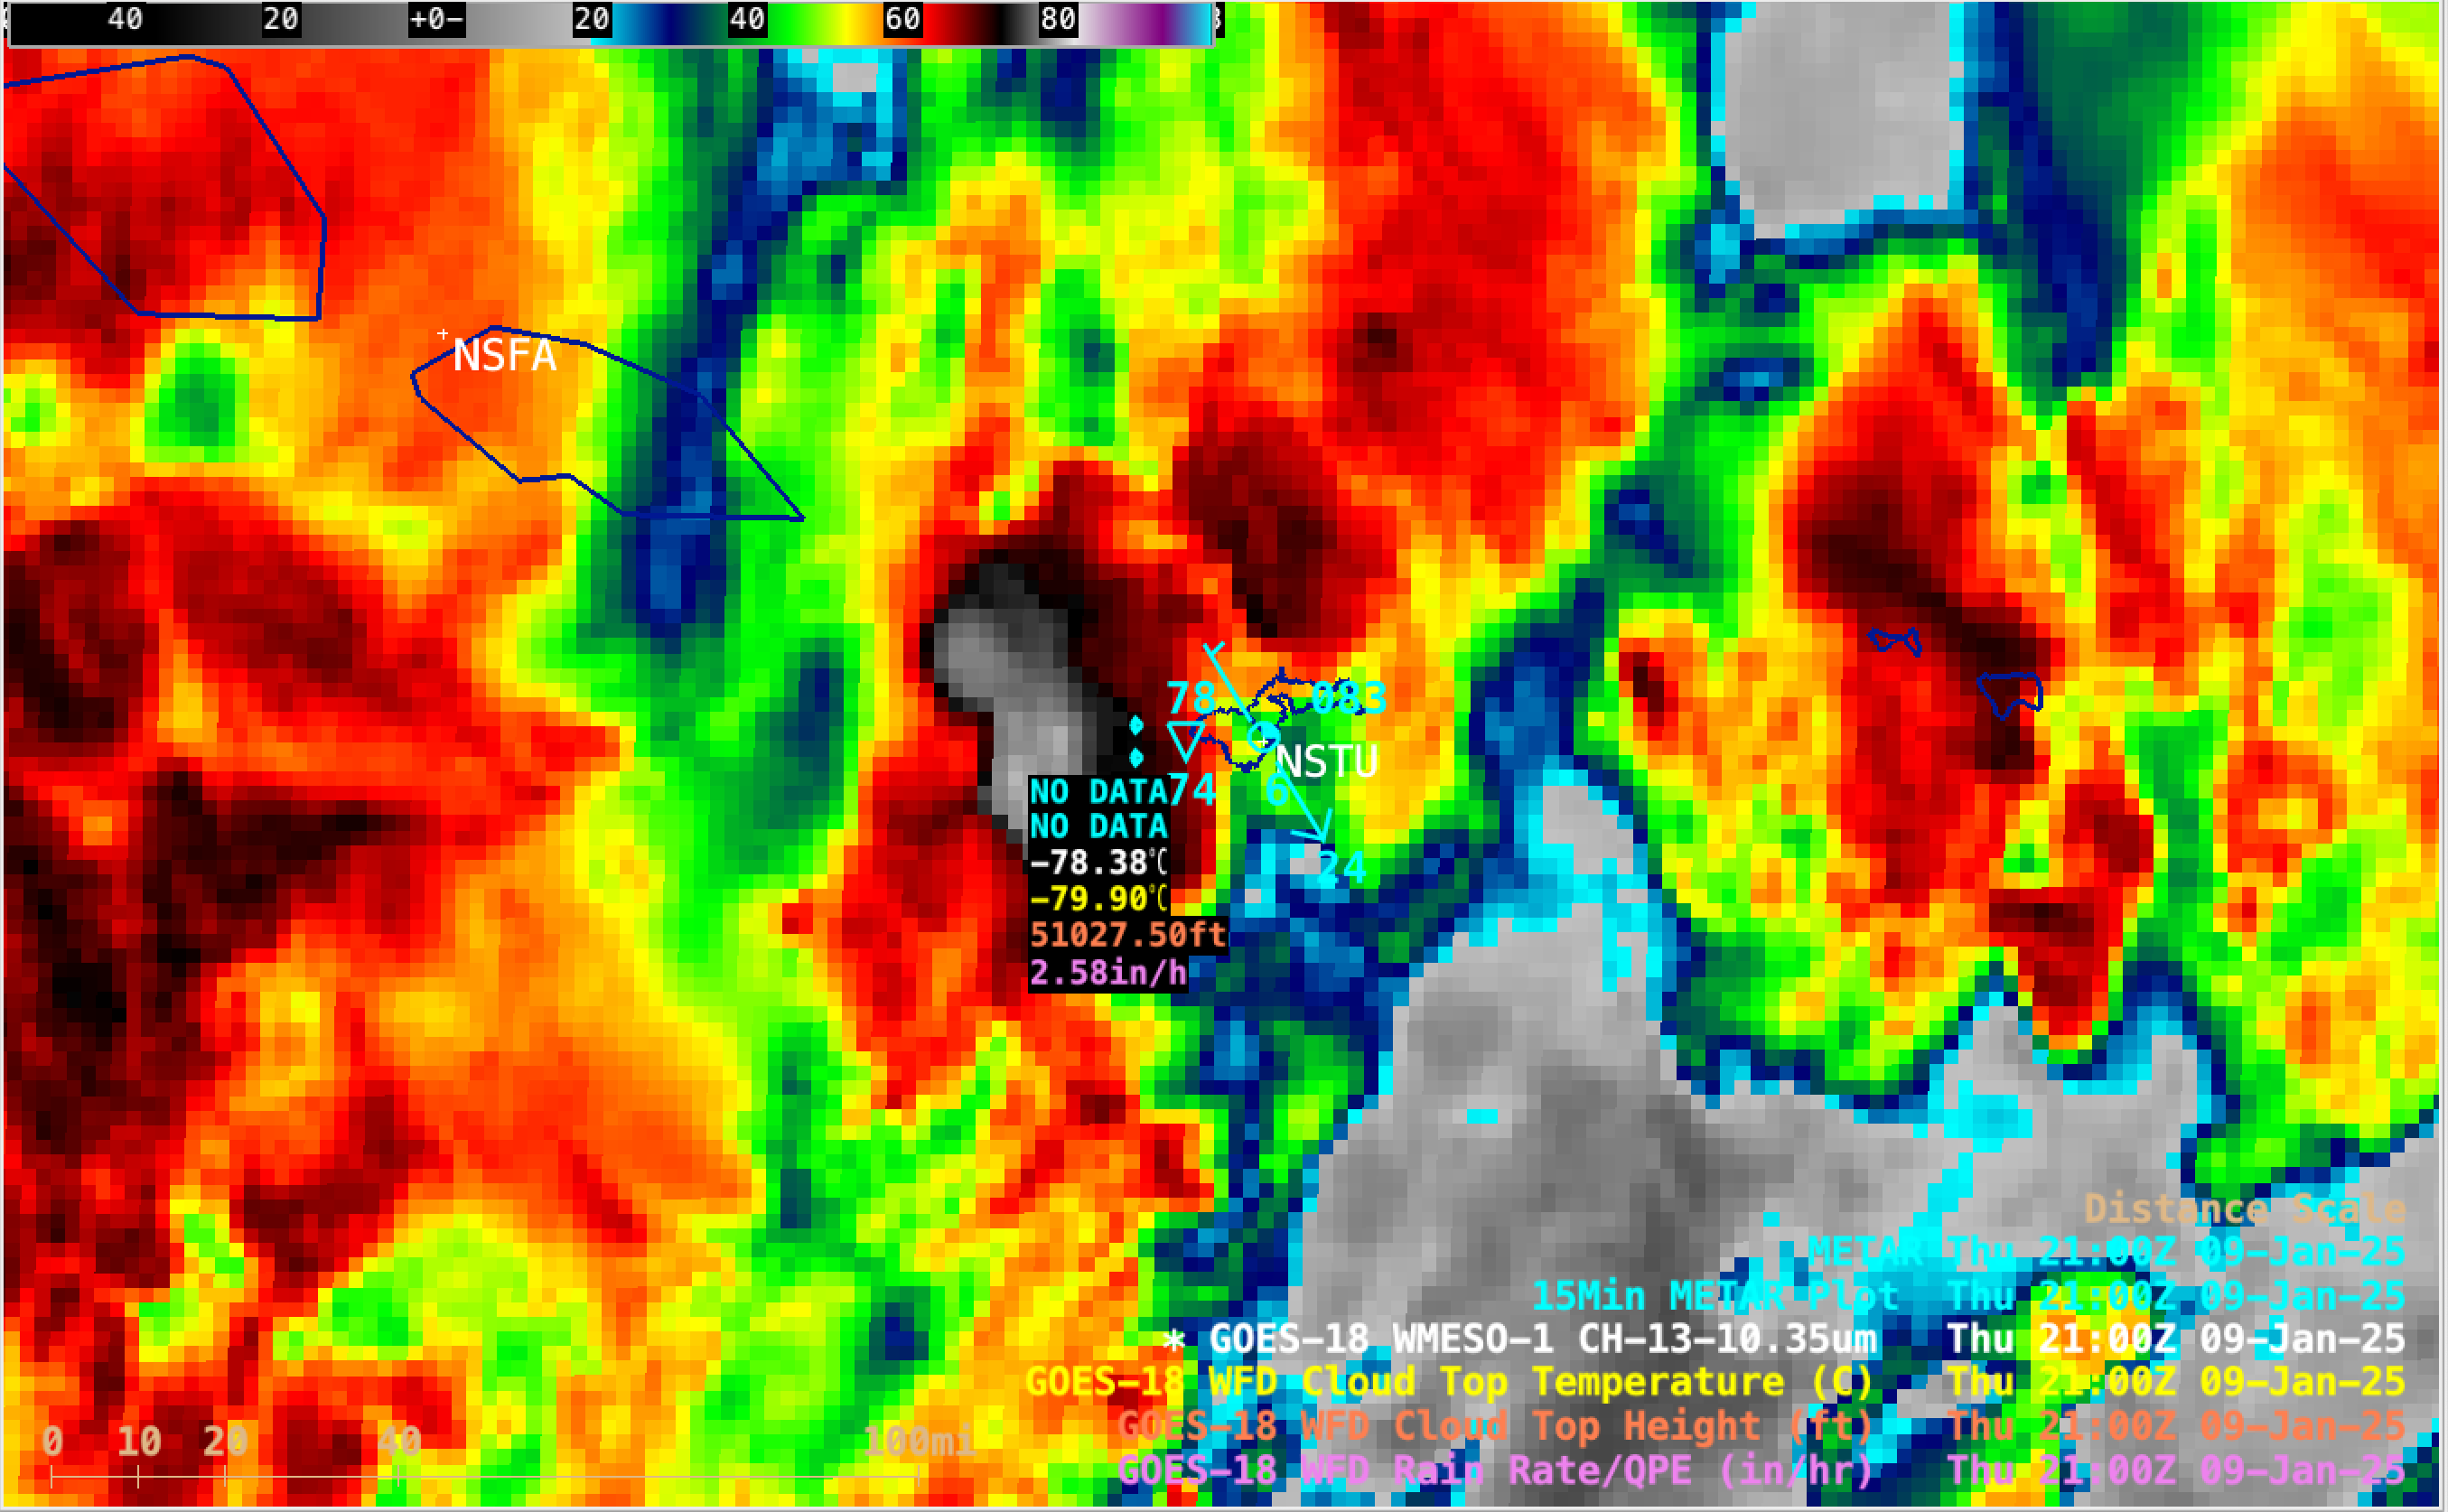
GOES-18 Infrared image at 2100 UTC, with cursor samples of the Cloud Top Temperature, Cloud Top Height and Rain Rate derived products for an area of convection that was approaching American Samoa [click to enlarge]
A toggle between plots of rawinsonde data from Pago Pago (below) depicted an atmosphere with deep moisture throughout the troposphere (Total Precipitable Water values of 2.45-2.49 in) and modest instability (CAPE values of 1242-1642 J/kg, and Lifted Index values of -3ºC).
Plots of rawinsonde data from Pago Pago at 0000 UTC and 1100 UTC on 9th January [click to enlarge]