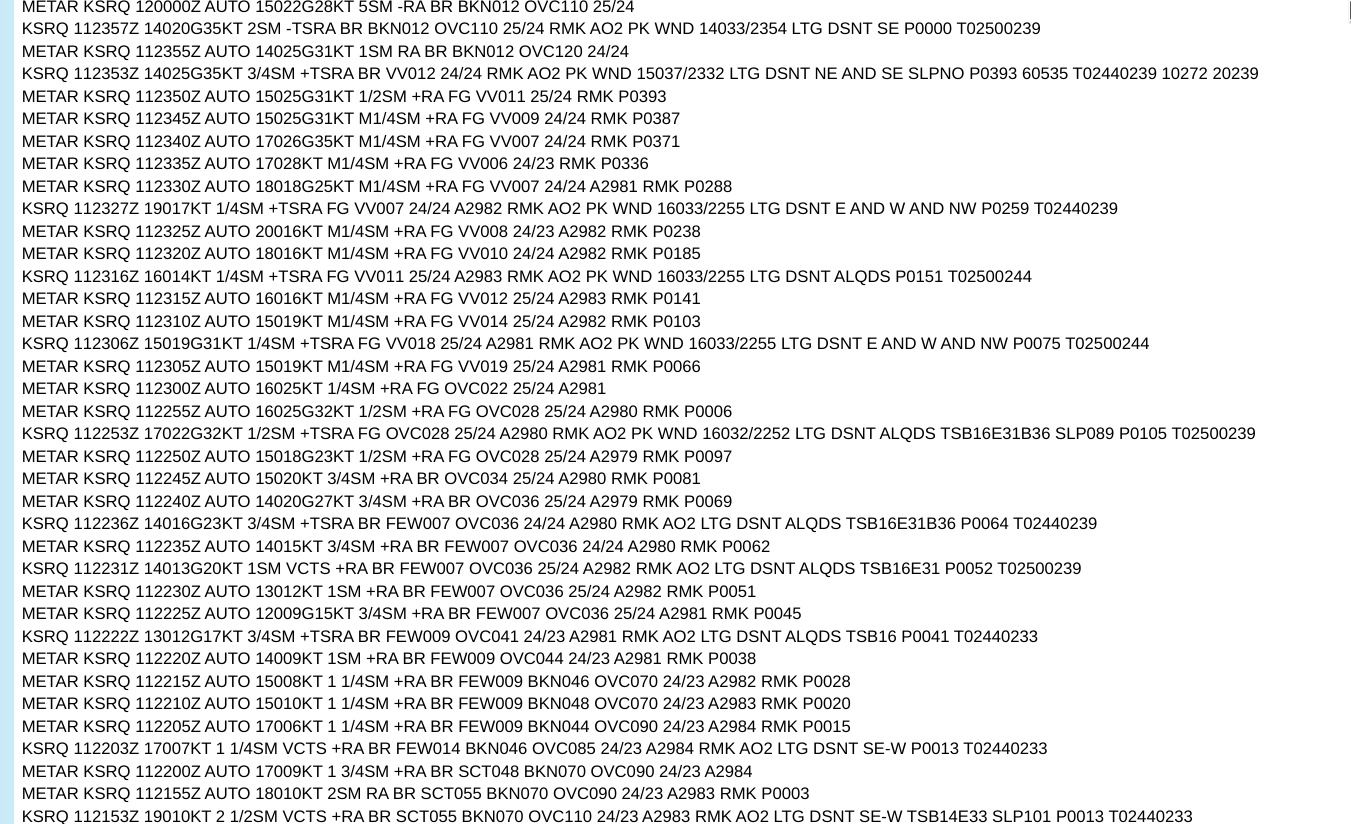
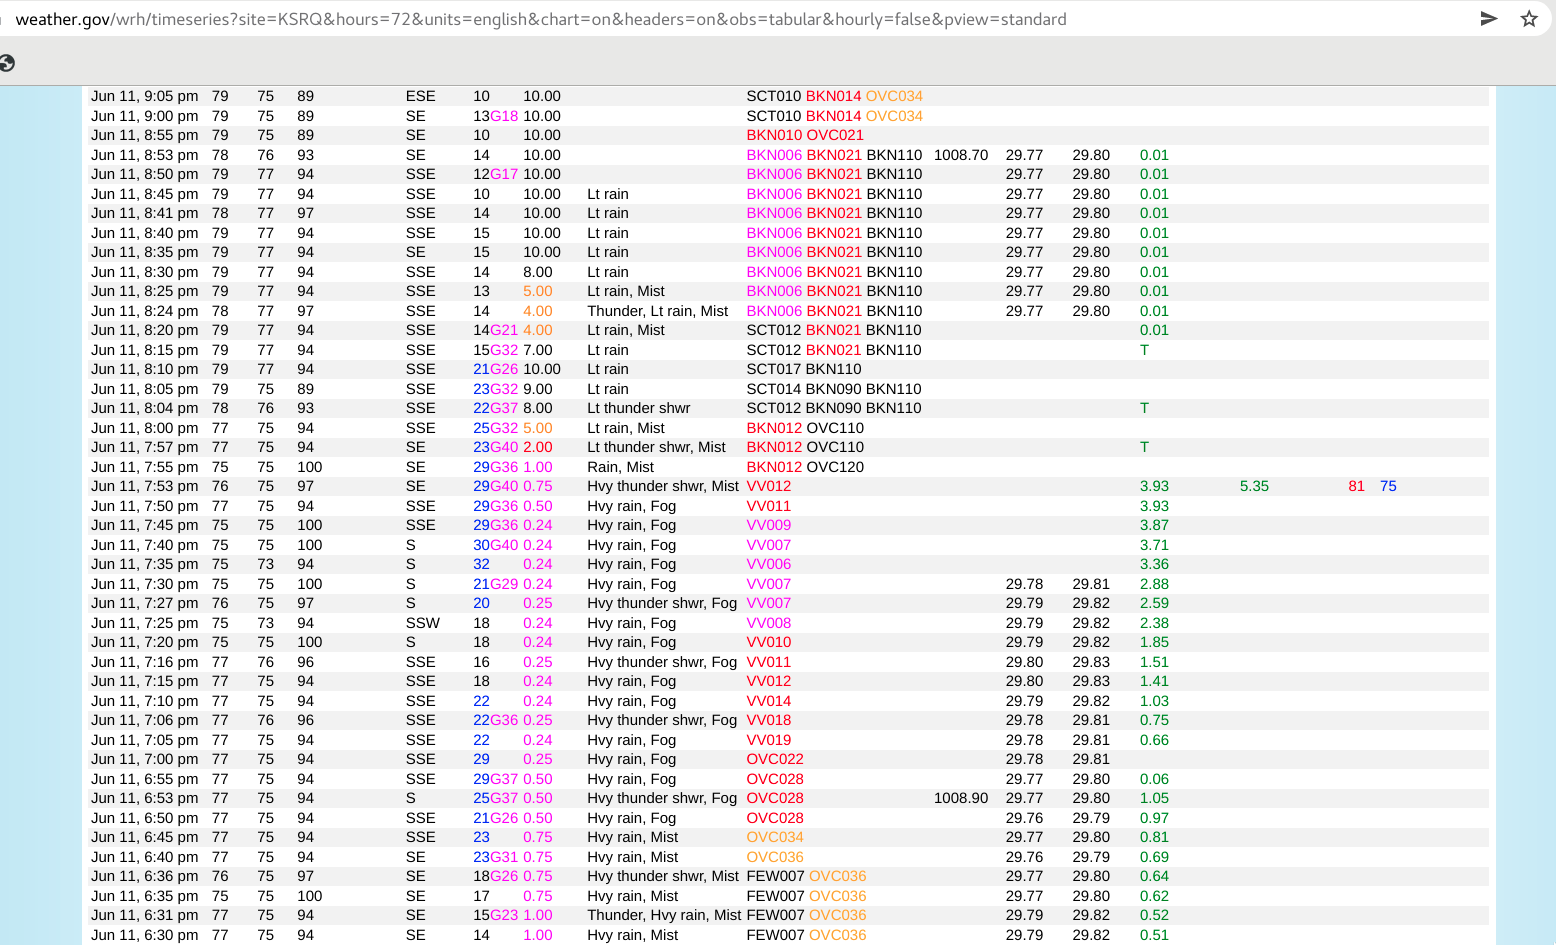
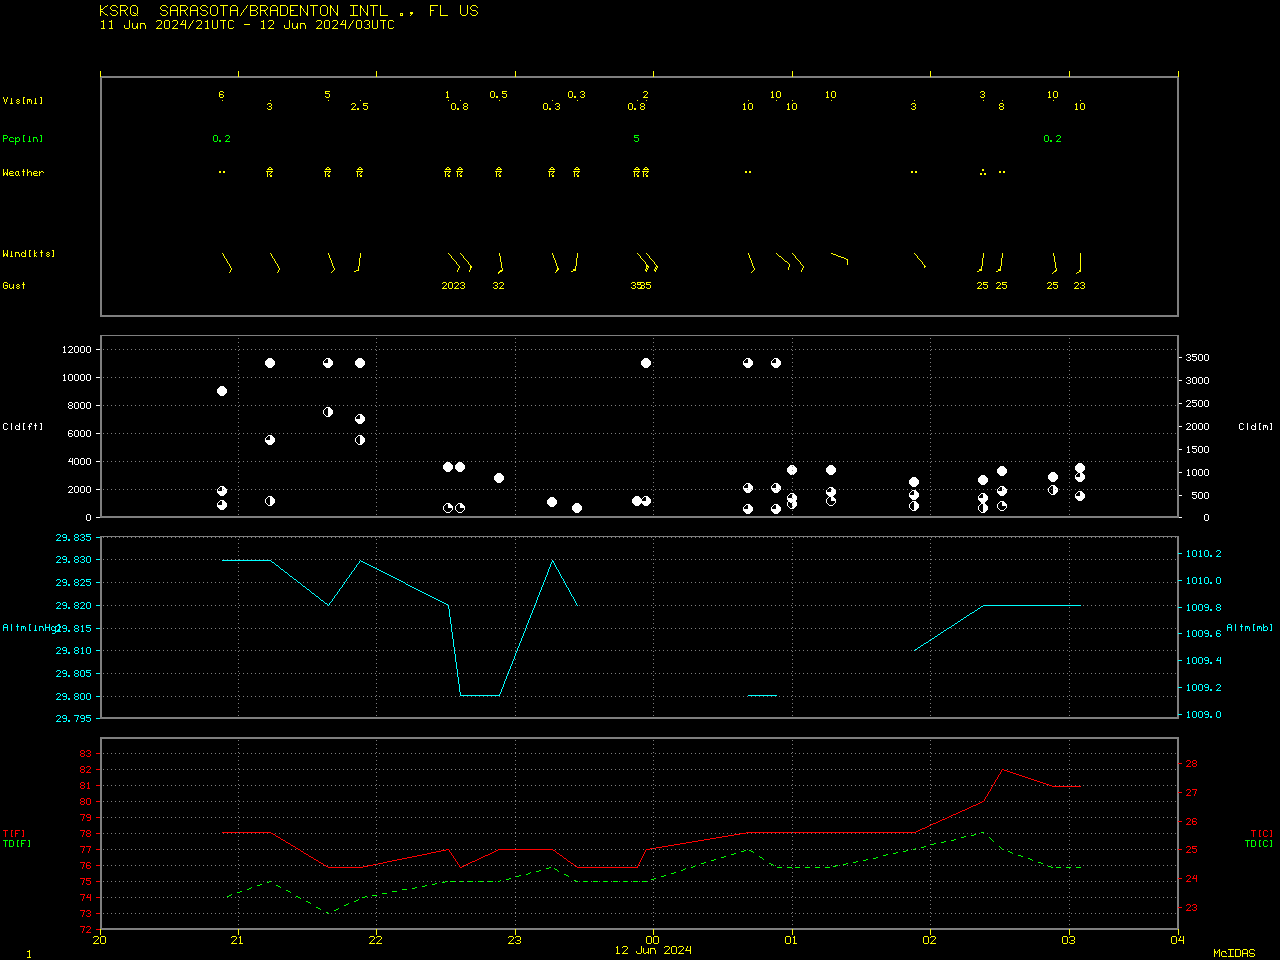
Record 1-hour rainfall accumulation at Sarasota, Florida
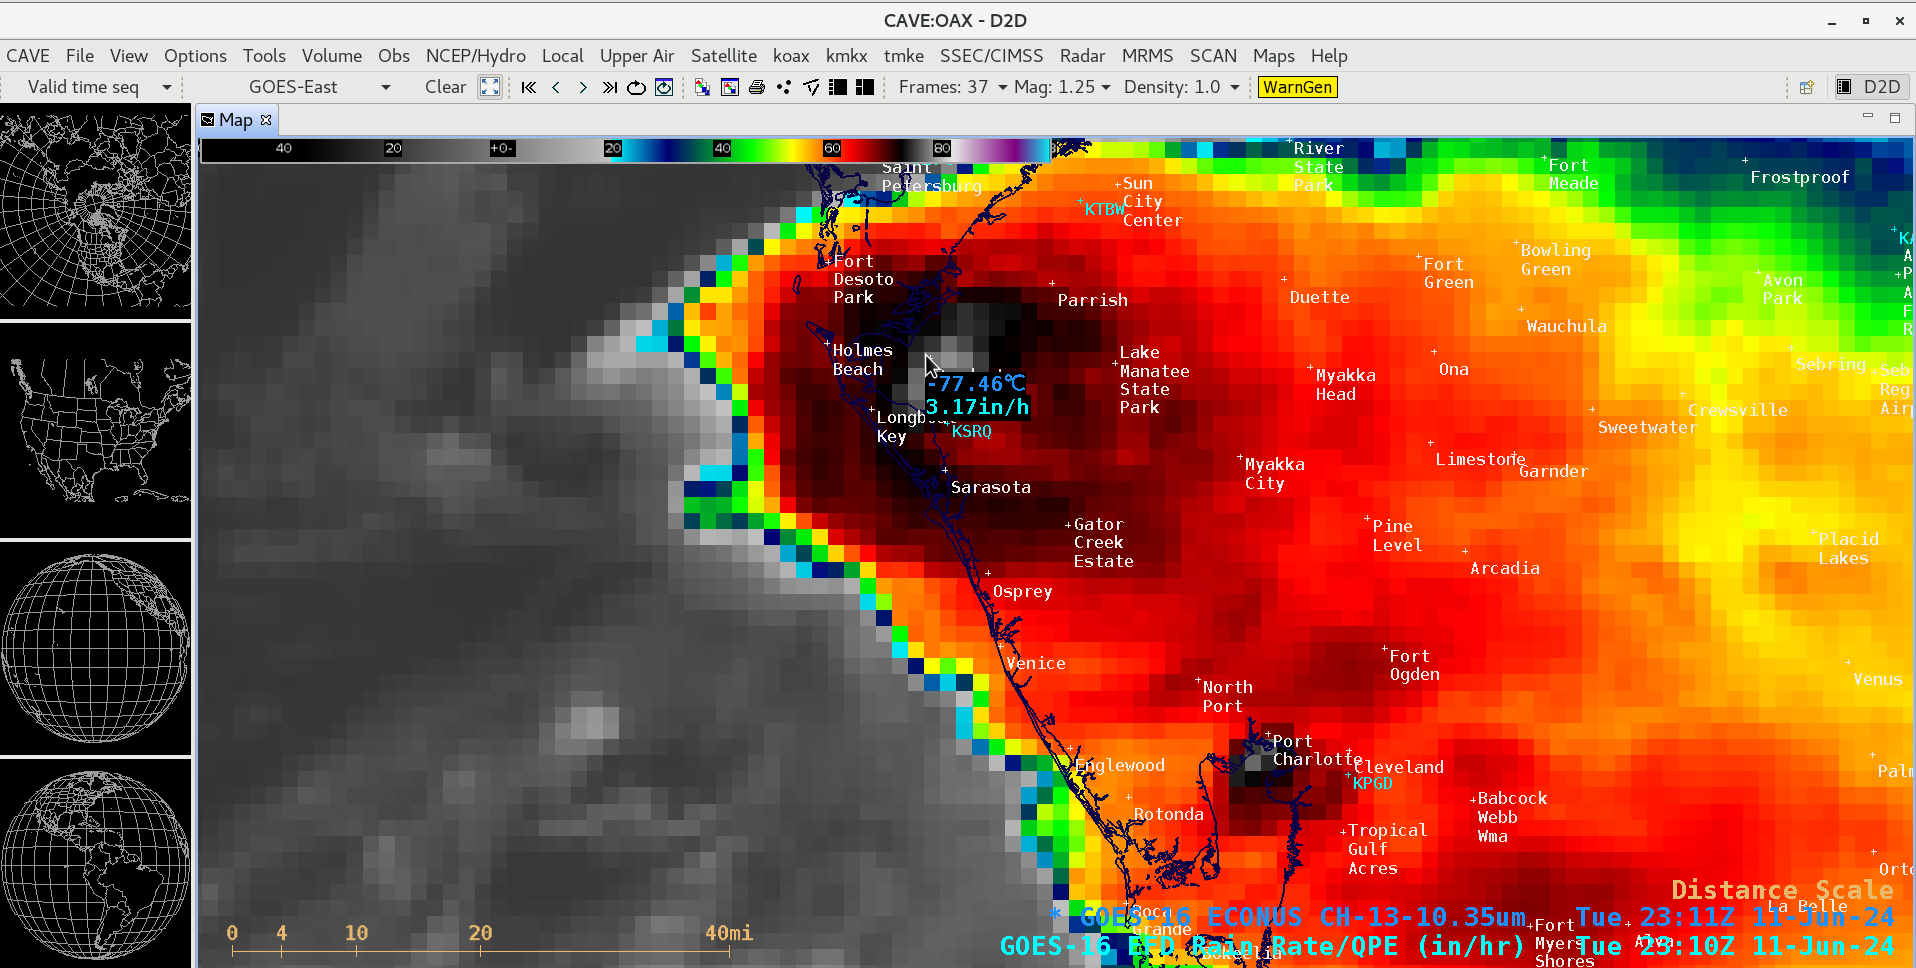
5-minute GOES-16 “Clean” Infrared Window (10.3 µm) images, from 2001 UTC on 11 June to 0101 UTC on 12 June; KSRQ denotes the location of Sarasota/Bradenton International Airport [click to play animated GIF | MP4]
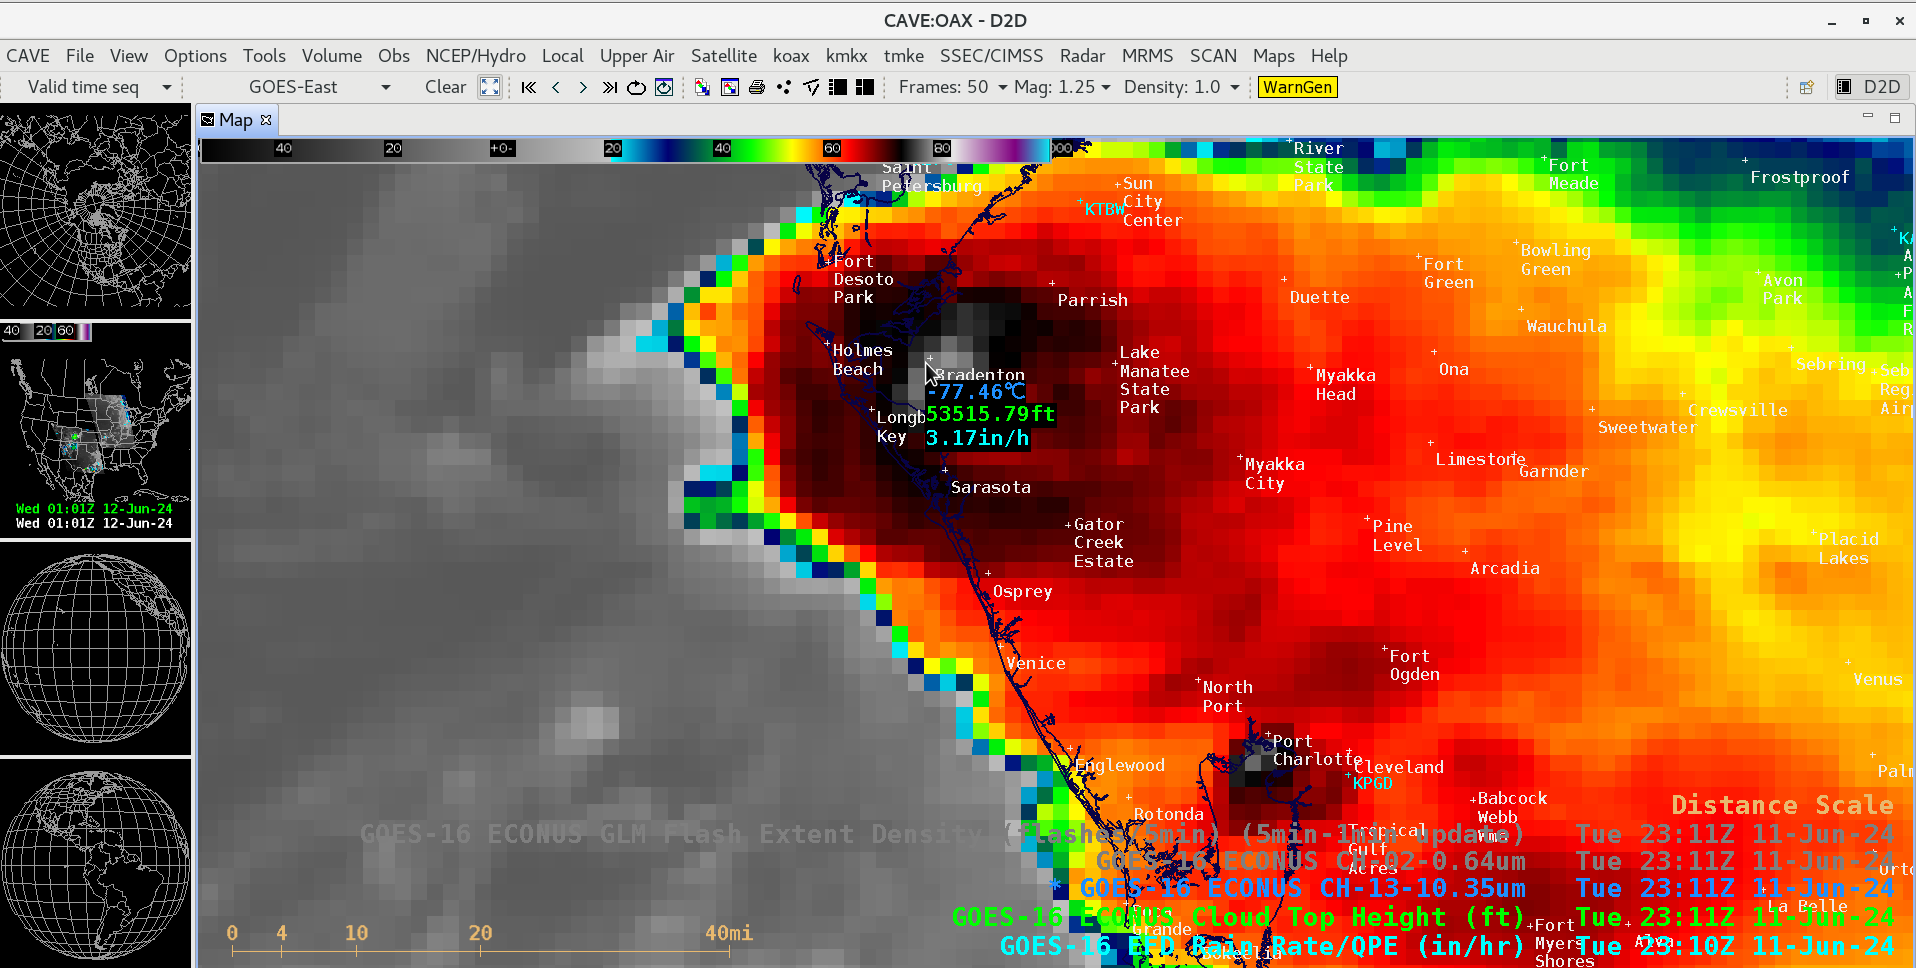
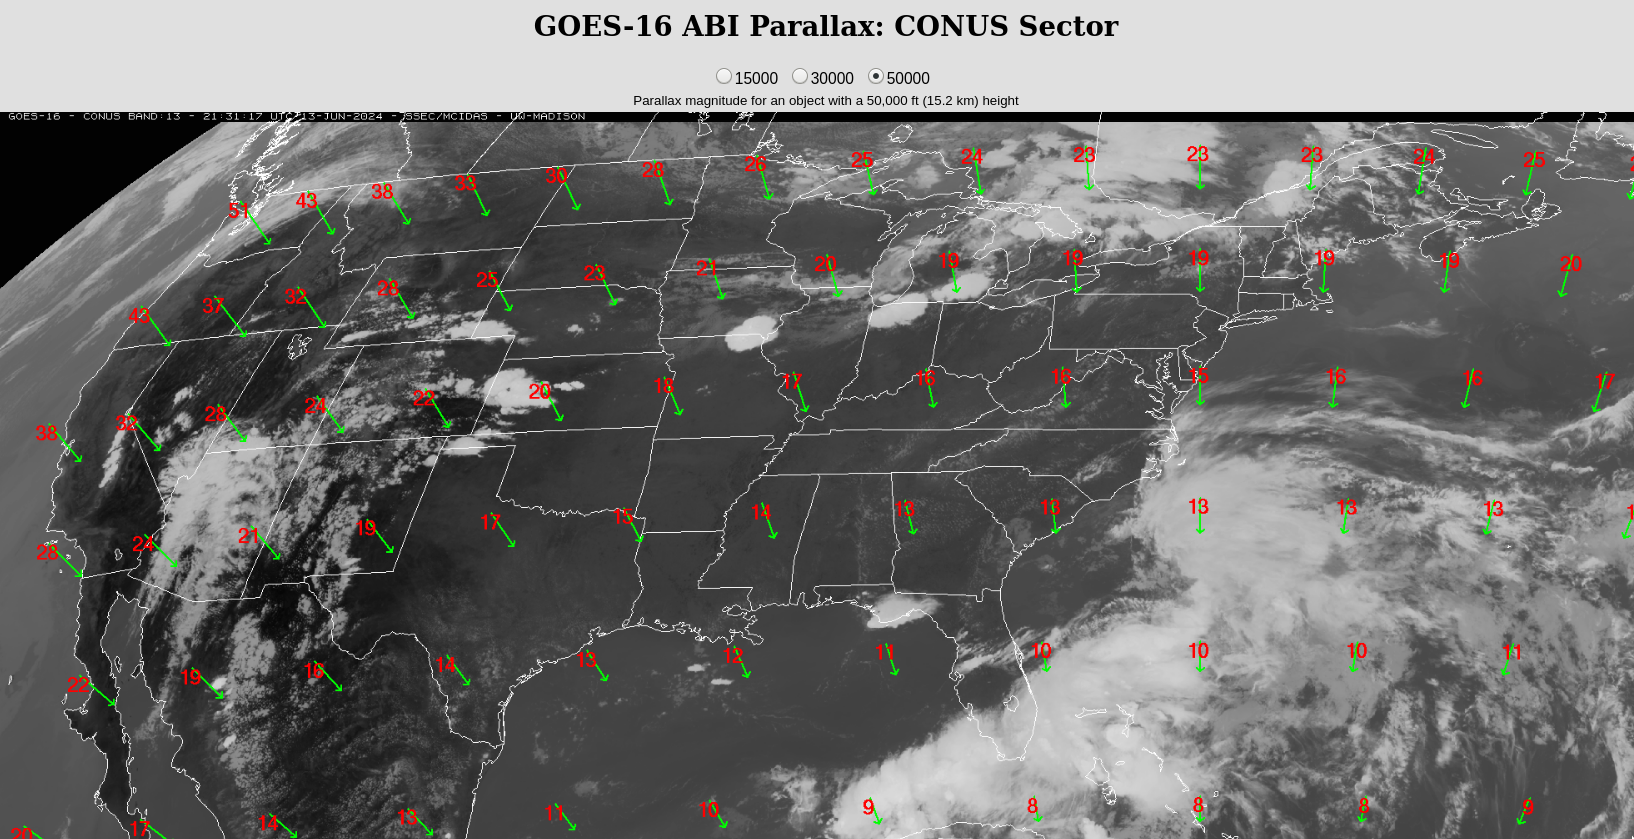
A GOES-16 Infrared image showing a cold thunderstorm overshooting top at 2311 UTC (below) included a cursor sample of the associated GOES-16 Rain Rate derived product — which was 3.17 in/hr, compared to the 3.93 in observed at Sarasota/Bradenton for the hour ending at 2353 UTC. Note that the cold overshooting top and high rain rate were displaced about 6 mi northwest of KSRQ — for a Cloud Top Height around 50 kft, this is consistent with the parallax adjustment of ~10 km with GOES-East imagery over Florida.
GOES-16 “Clean” Infrared Window (10.3 µm) image showing a cold thunderstorm overshooting top at 2311 UTC on 11 June, which included a cursor sample of the associated GOES-16 Rain Rate (cyan) derived product [click to enlarge]
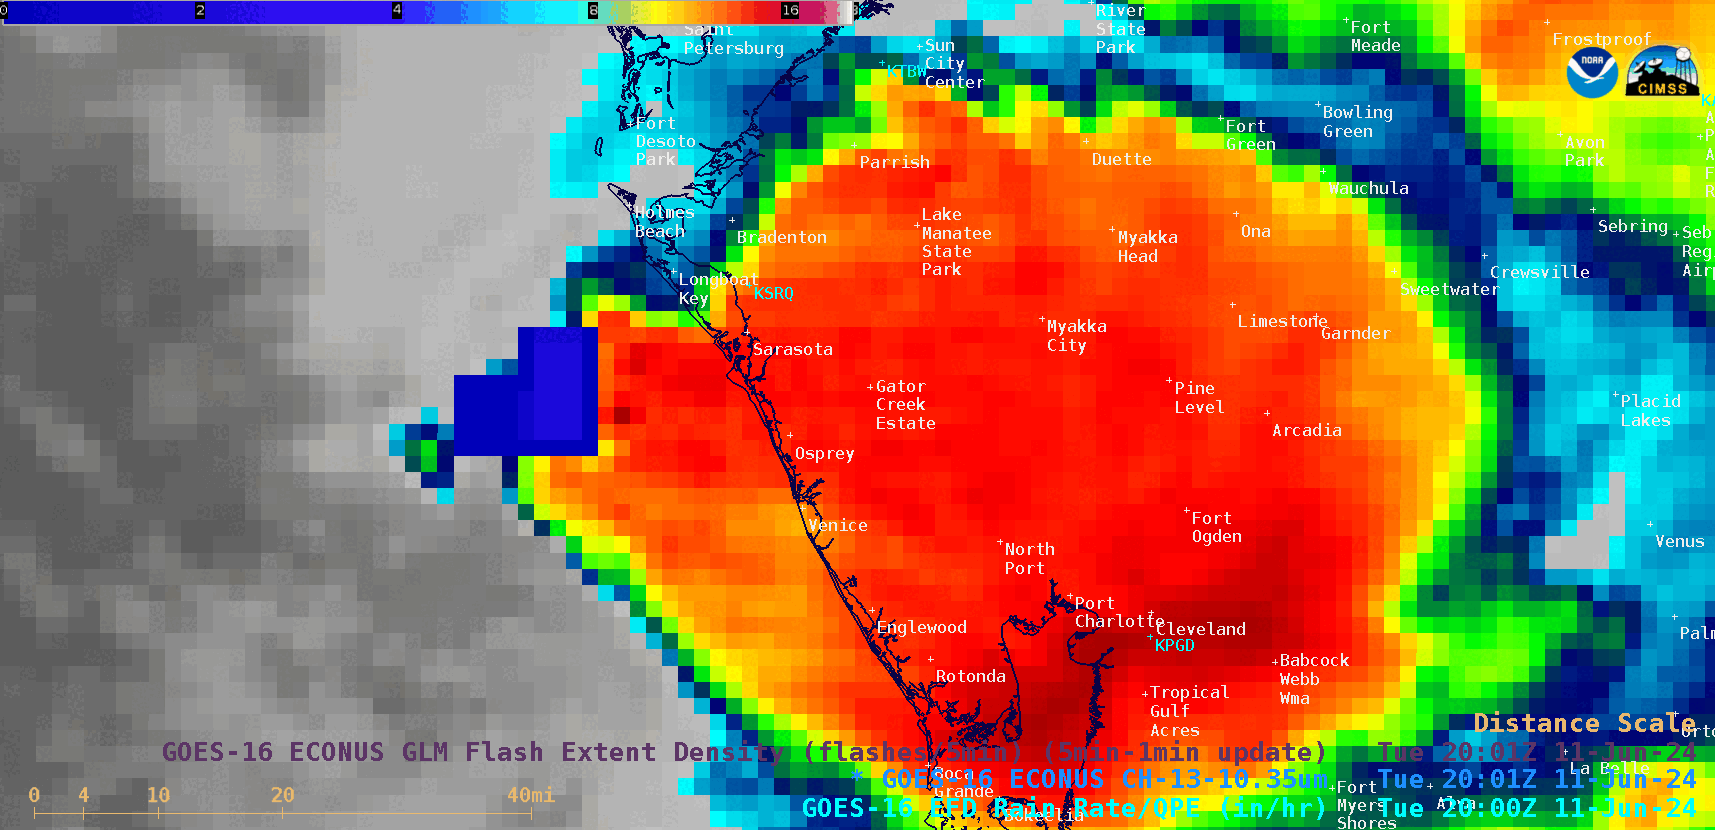
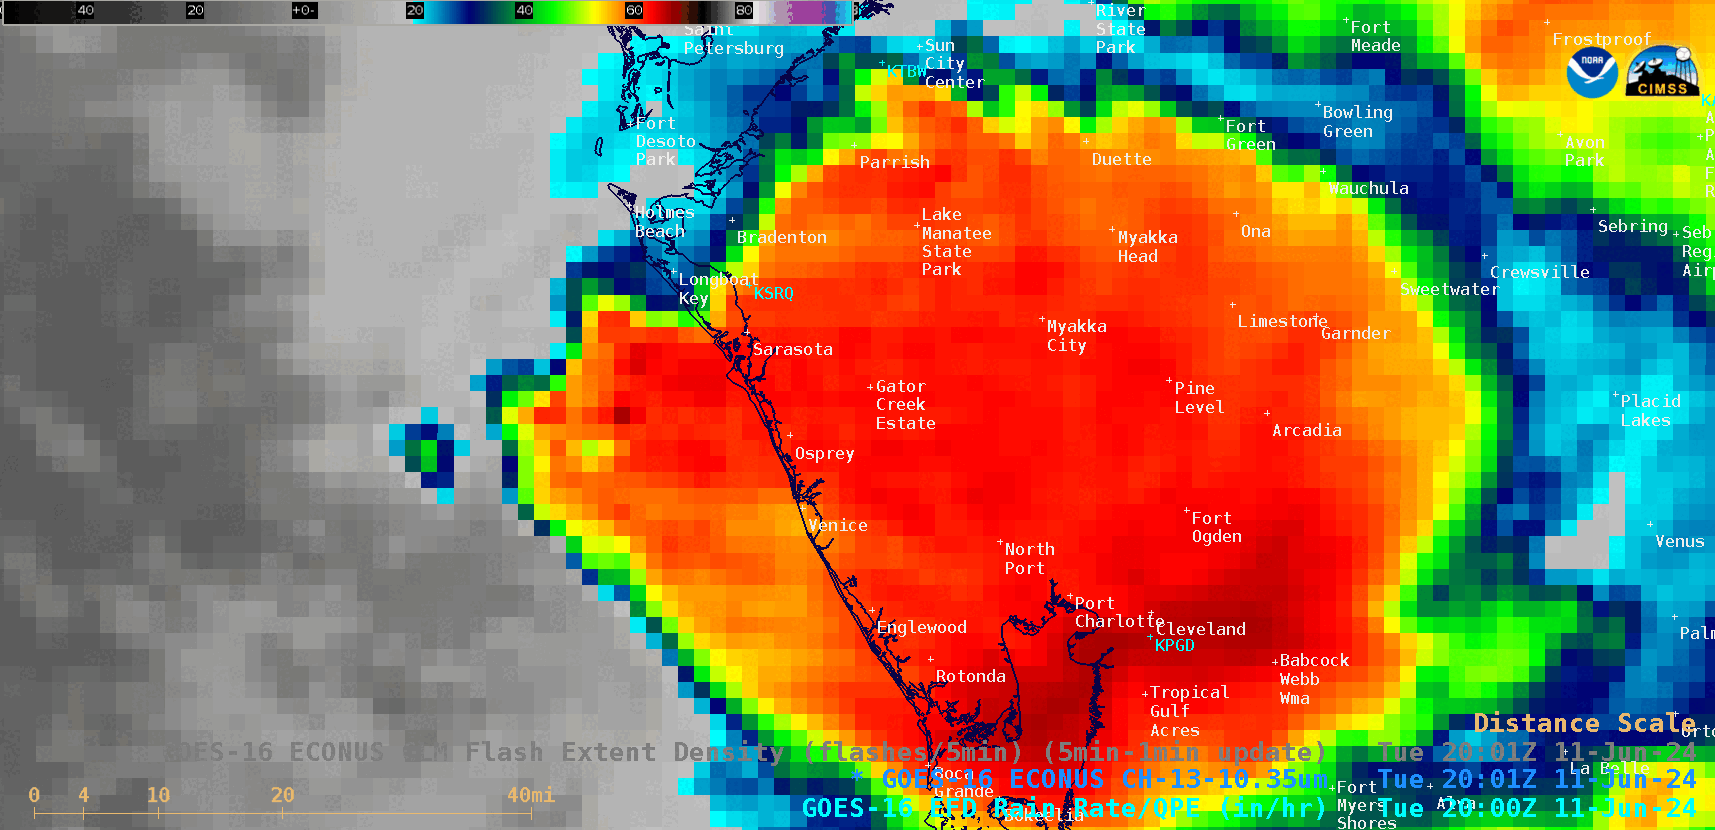
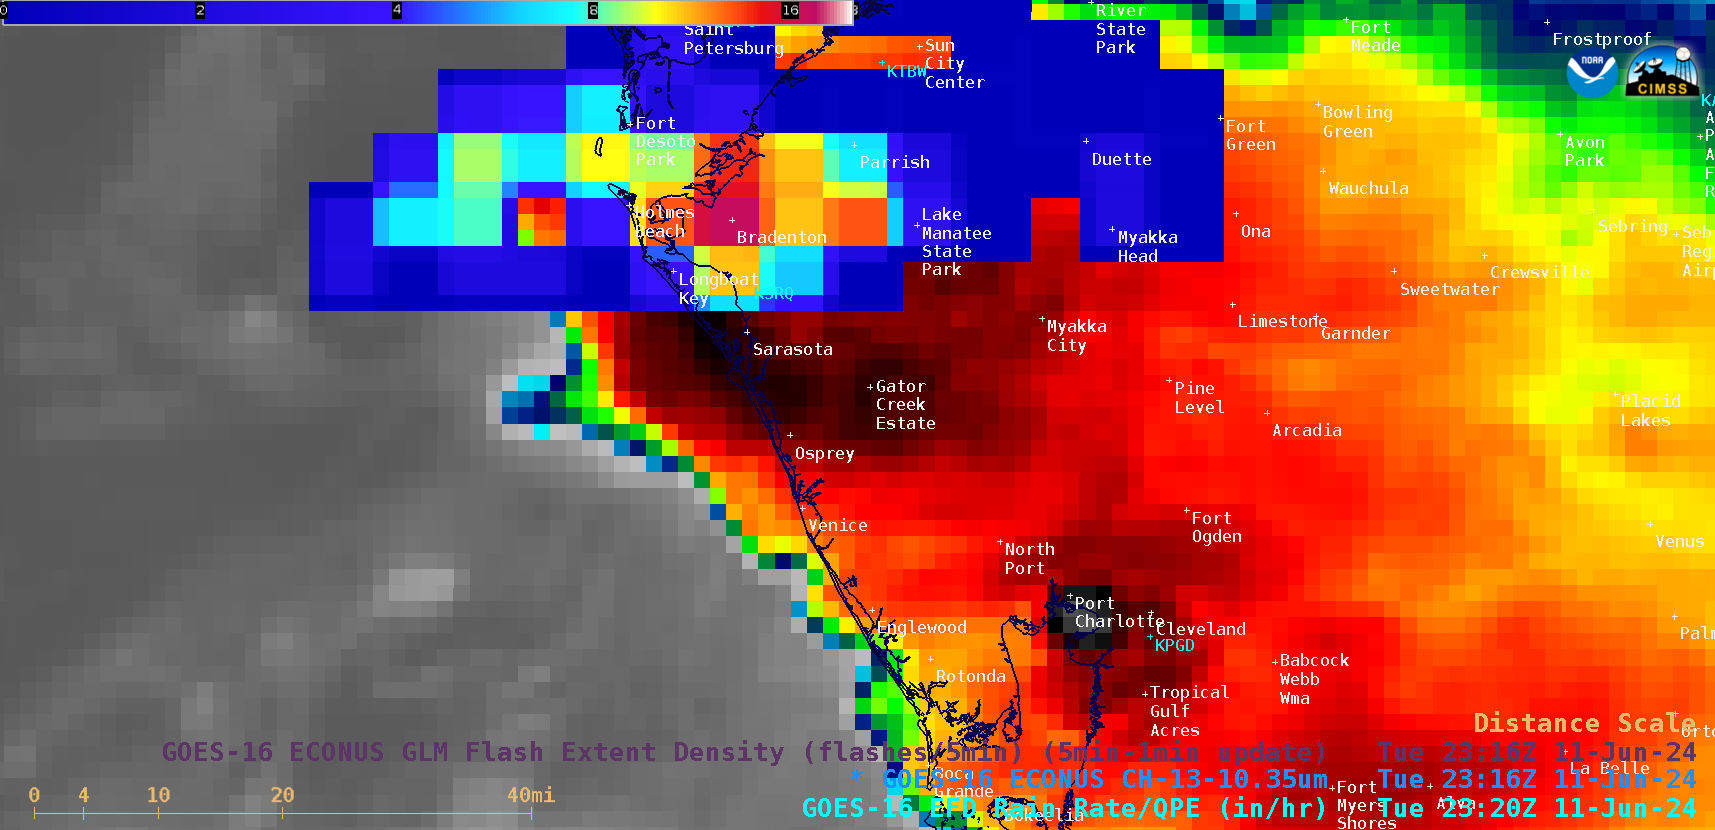
5-minute GOES-16 “Clean” Infrared Window (10.3 µm) images, with an overlay of GLM Flash Extent Density, from 2001 UTC on 11 June to 0101 UTC on 12 June [click to play animated GIF | MP4]
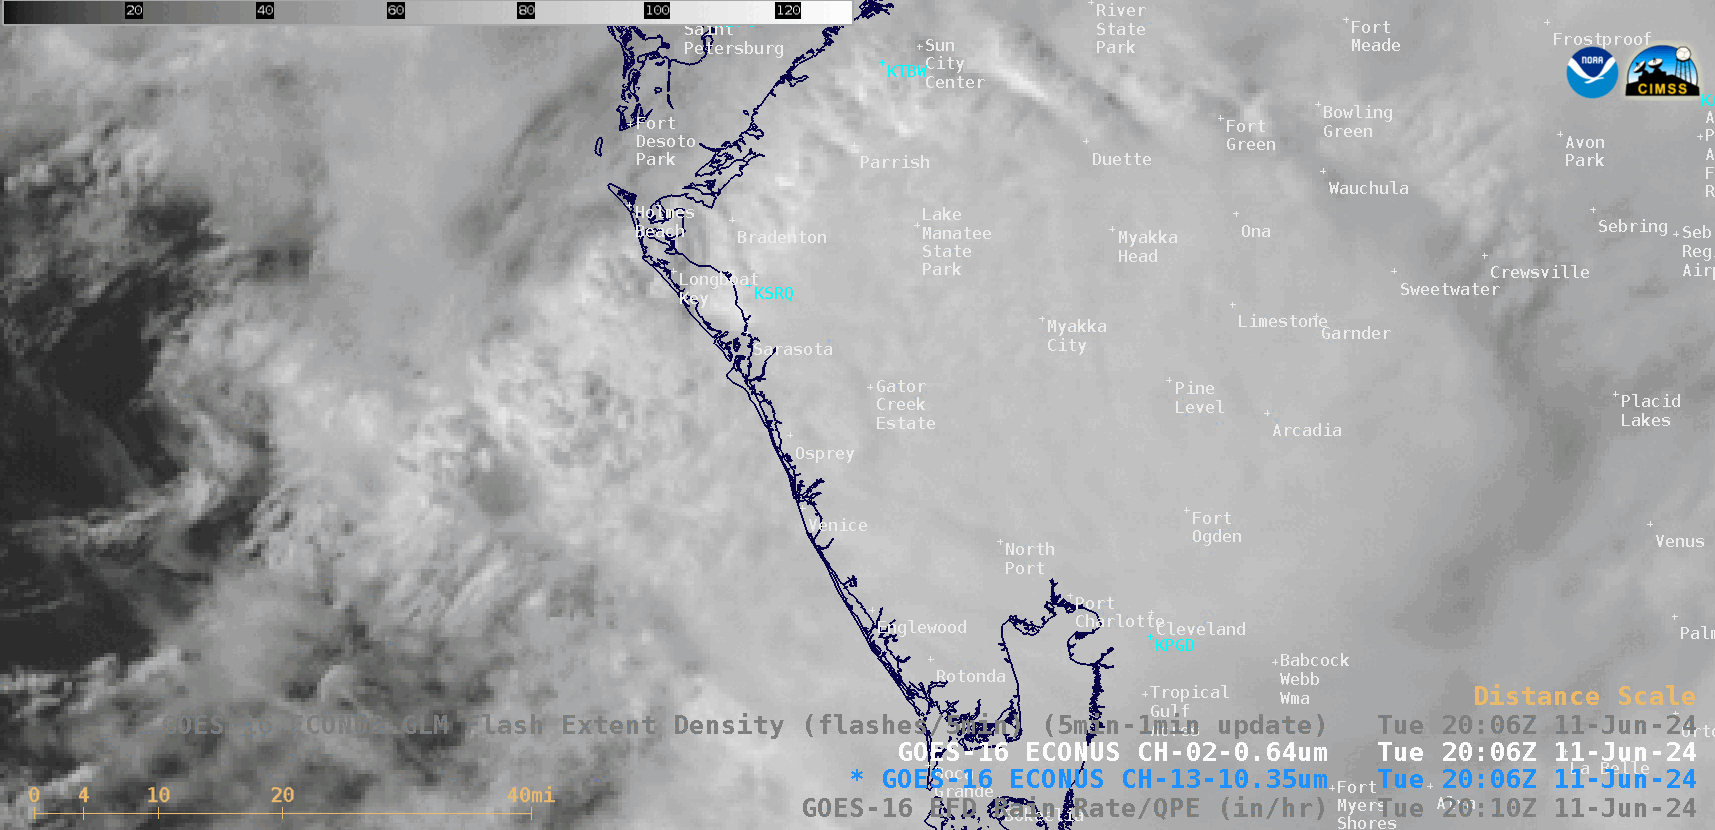
5-minute GOES-16 “Red” Visible (0.64 µm) images, from 2001 UTC on 11 June to 0011 UTC on 12 June; KSRQ denotes the location of Sarasota/Bradenton International Airport [click to play animated GIF | MP4]