Turbulence near the axis of a strong subtropical jet stream

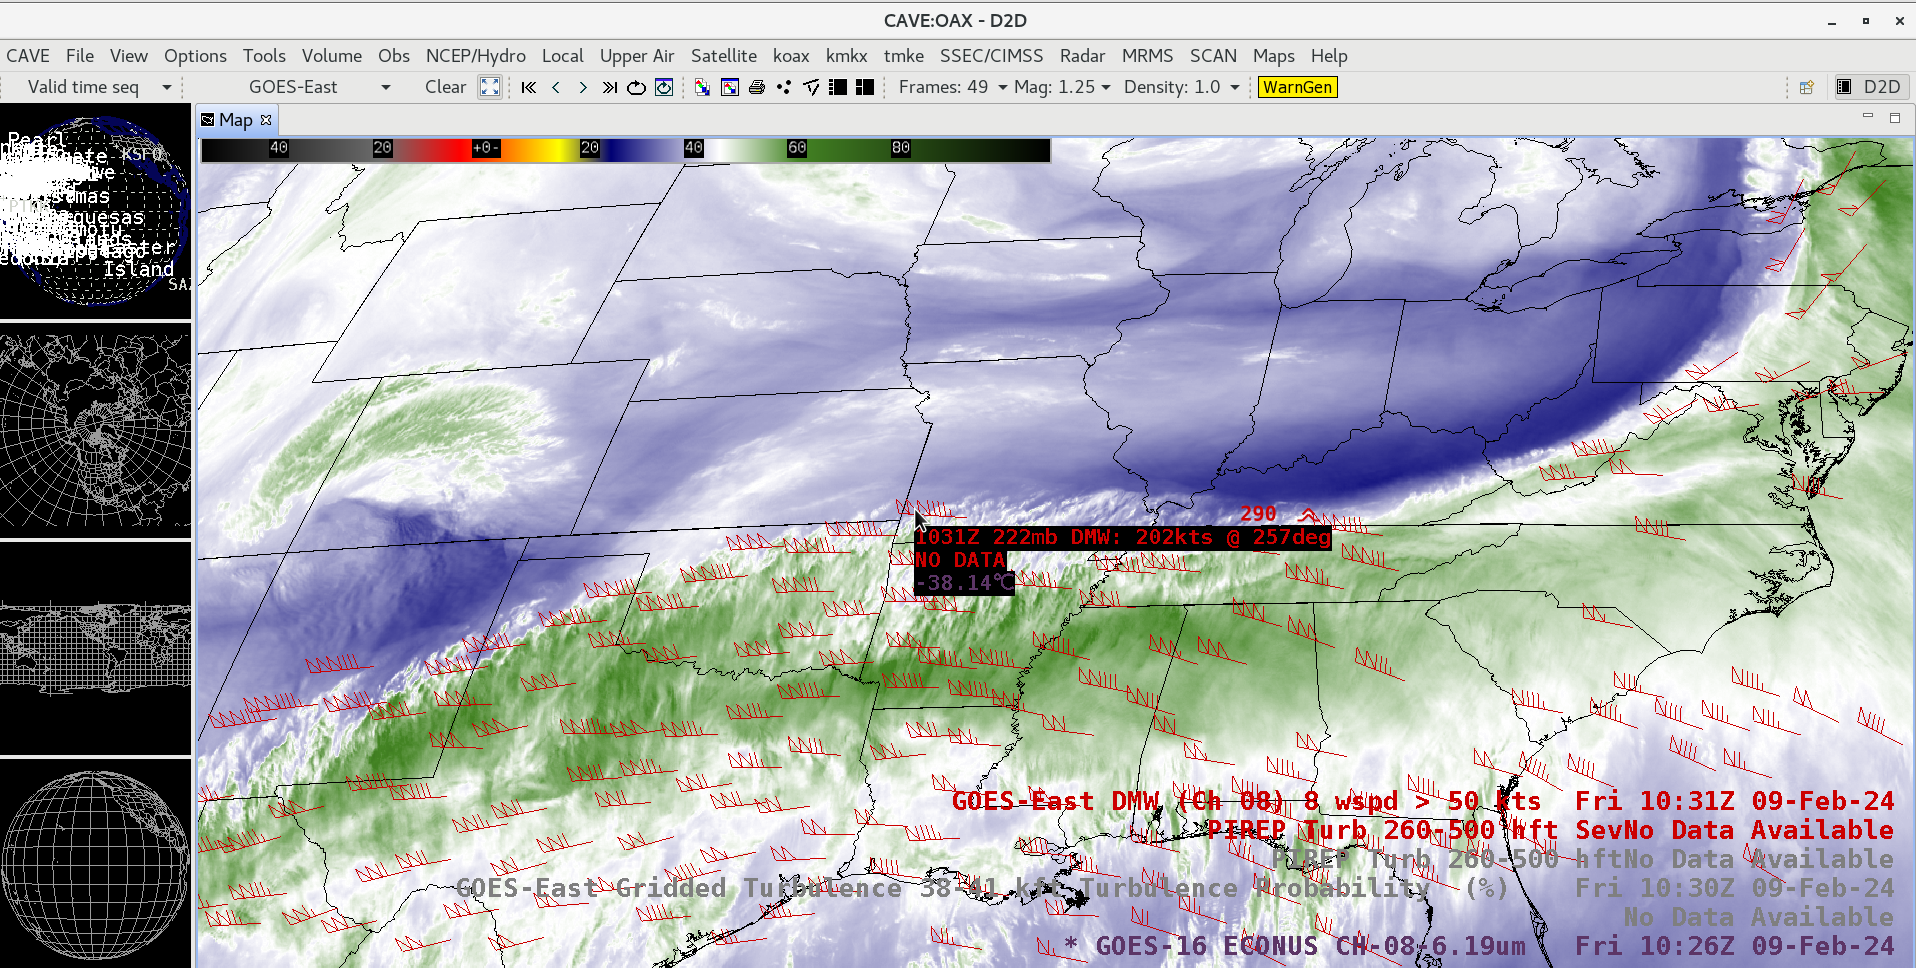
GOES-16 Upper-level Water Vapor (6.2 µm) images with plots of Derived Motion Winds (red), Pilot Reports of Light to Moderate turbulence (blue) and Severe turbulence (bold red), from 0801-2201 UTC on 09 February [click to play animated GIF | MP4]
There were 4 pilot reports of Severe turbulence during the 14-hour period shown above: over Kentucky around 1026 UTC, over Virginia around 1500 UTC, over Oklahoma around 1700 UTC and over Illinois at 2144 UTC. According to GOES-16 Derived Motion Winds, speed shear was notable in the vicinity of those cases of Severe turbulence: 1501 UTC | 1701 UTC | 2146 UTC.
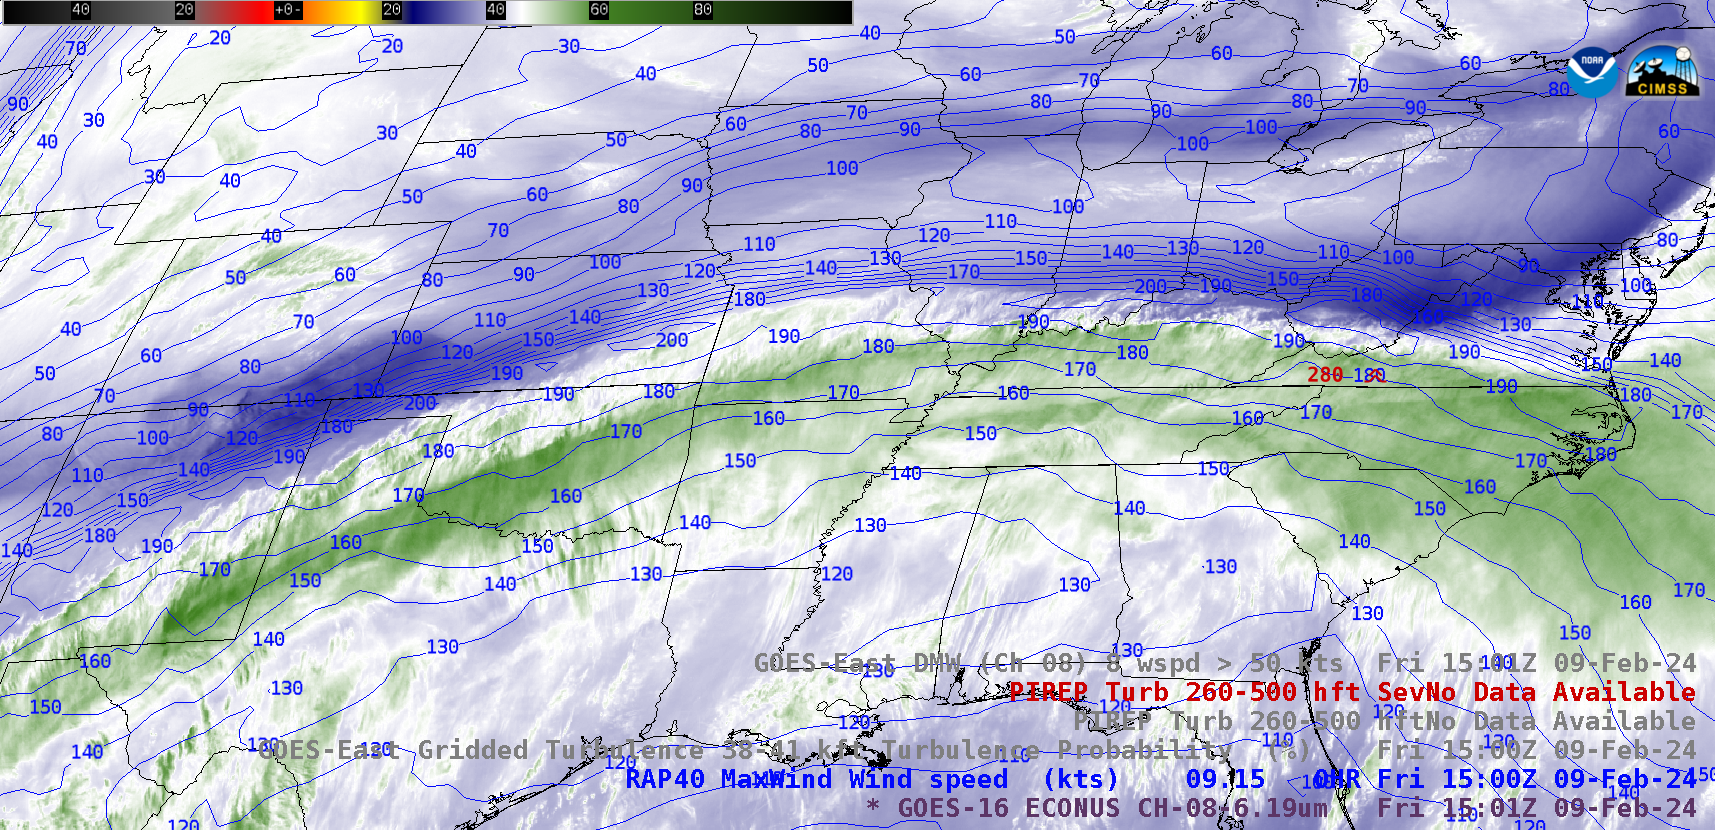
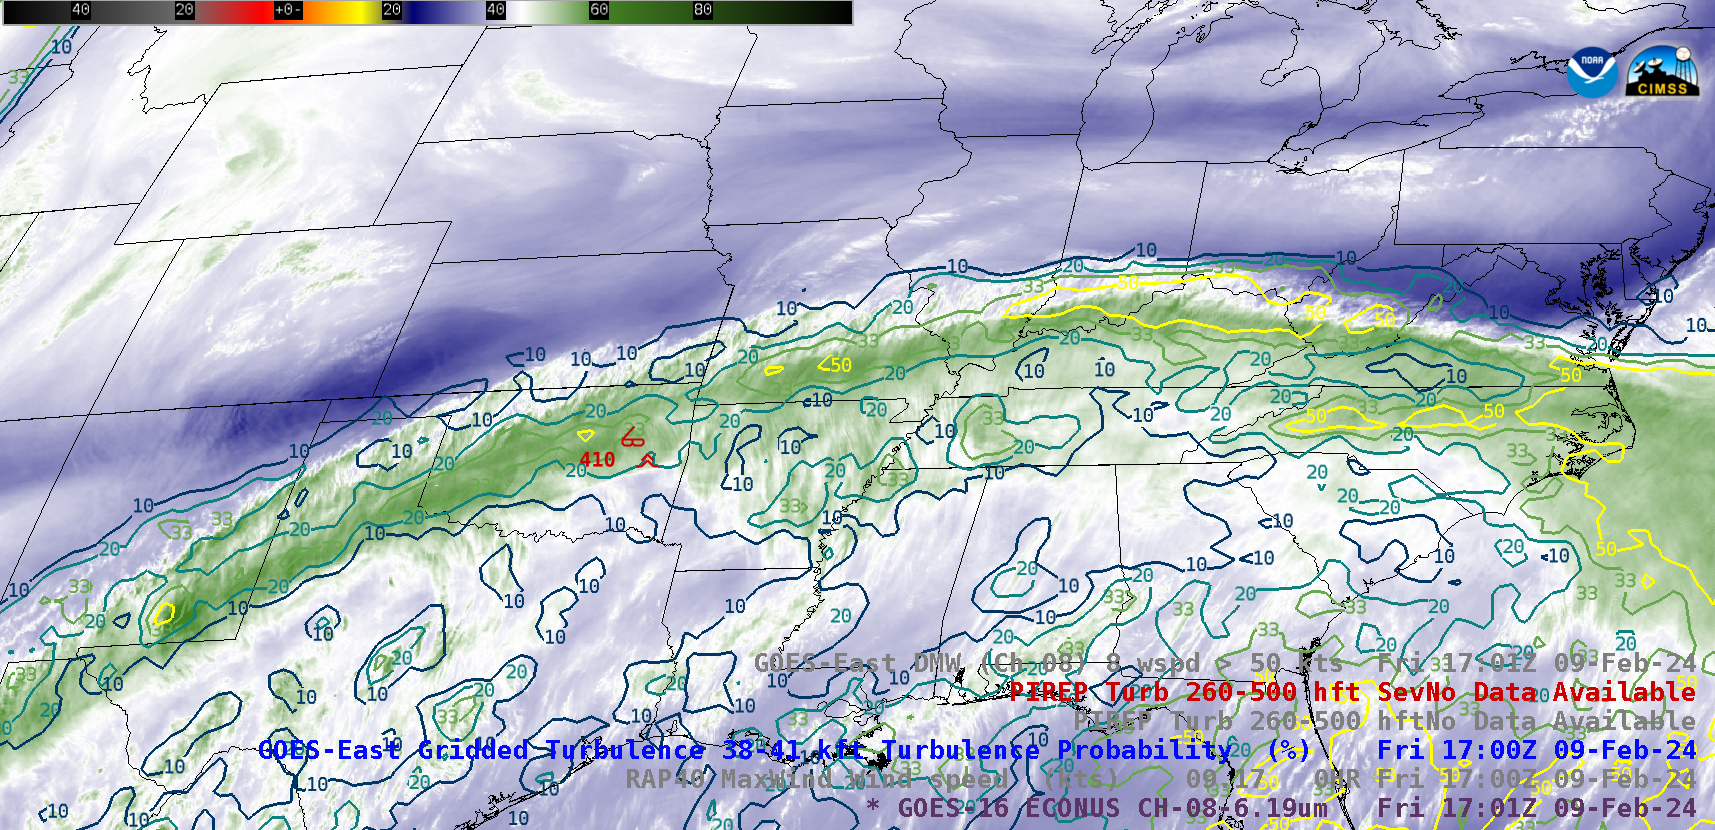
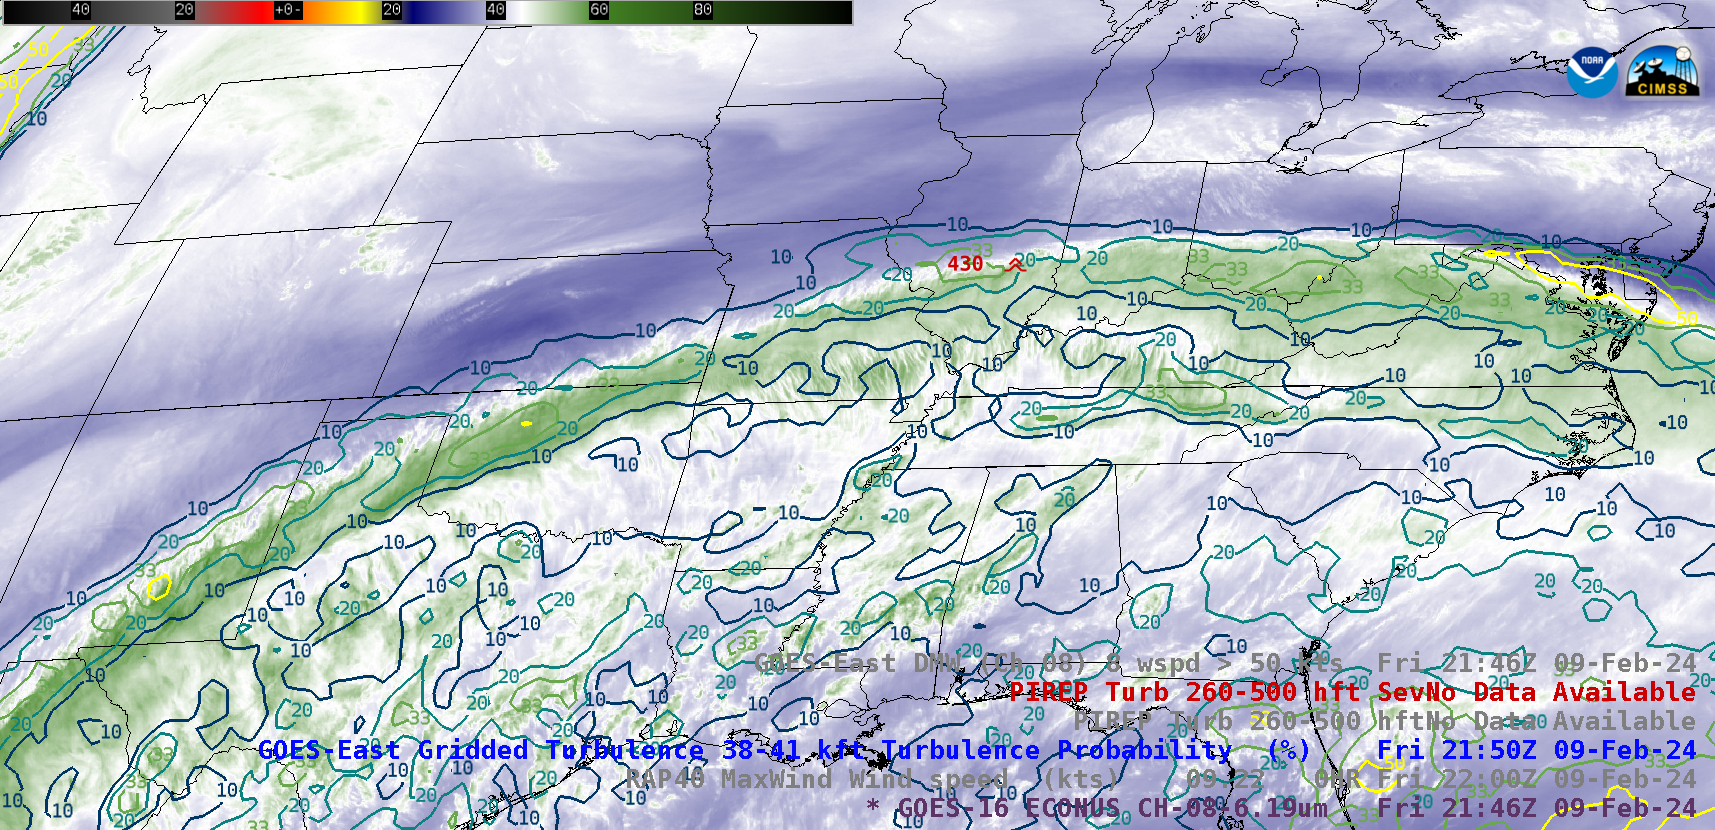
GOES-16 Upper-level Water Vapor images with contours of Moderate or Greater (MOG) Turbulence Probability within the 38-41 kft layer (below) depicted intermittent pockets of 33% (green) to 50% (yellow) probability along or near the axis of the subtropical jet — and the 2 high-altitude (41-43 kft) Severe turbulence PIREPs occurred in the general proximity of MOG Probability contours in the 33-50% range (1701 UTC | 2146 UTC).

GOES-16 Upper-level Water Vapor (6.2 µm) images with contours of Turbulence Probability within the 38-41 kft layer, from 0801-2201 UTC on 09 February [click to play animated GIF | MP4]