1-minute imagery to monitor convection across the Samoan Islands

1-minute GOES-18 “Clean” Infrared Window (10.3 µm) images, from 0600-1200 UTC on 04 February [click to play animated GIF| MP4]
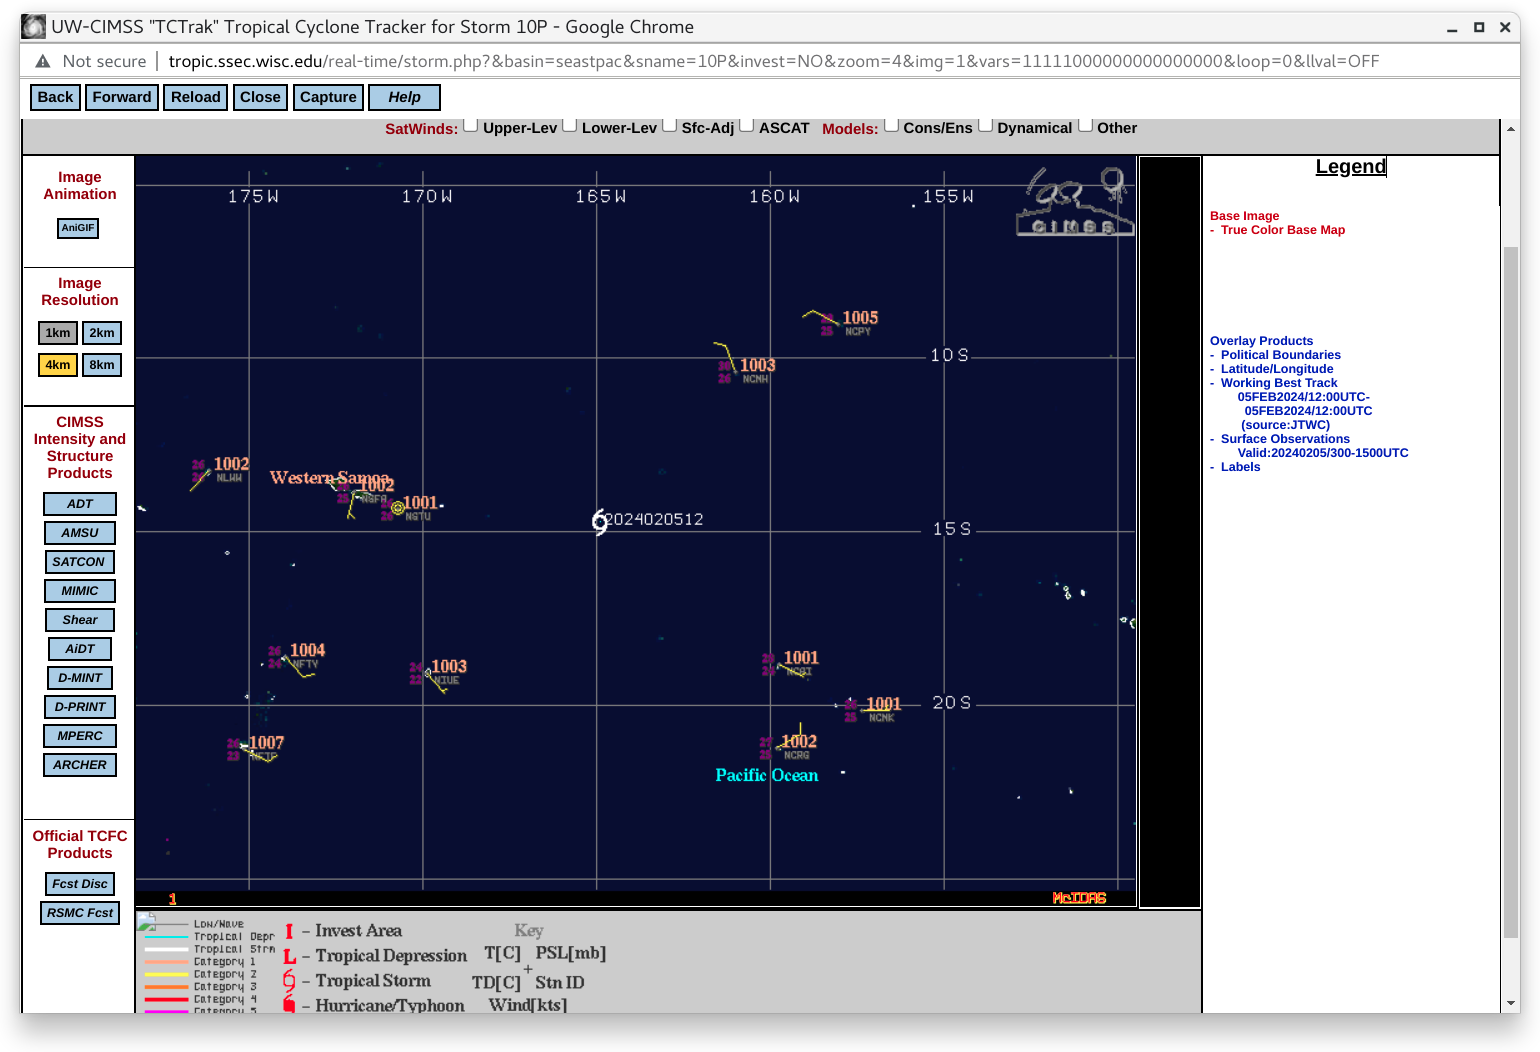
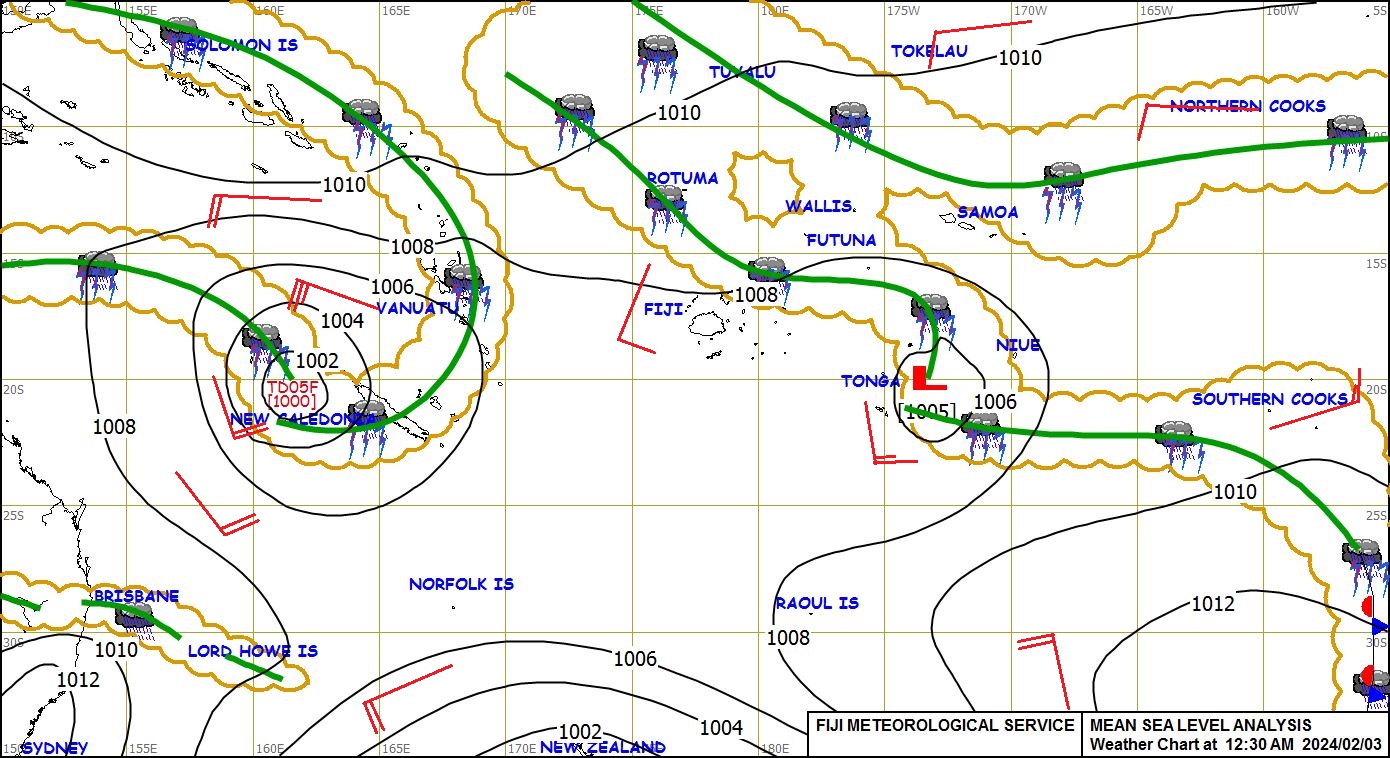
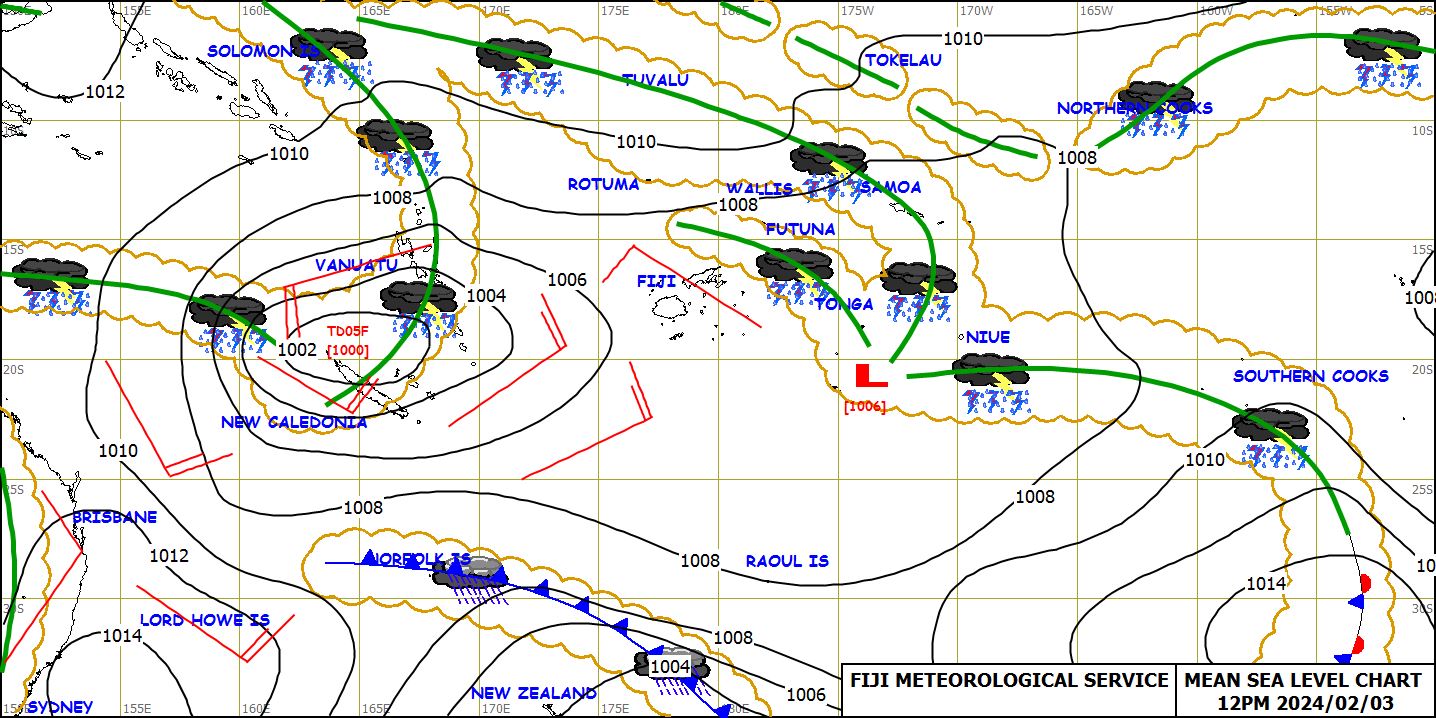
These convective bursts developed as Tropical Disturbance TD06F was slowly approaching American Samoa (Fiji Meteorological Service surface analyses: 0300 UTC | 0600 UTC | 1200 UTC); TD06F continued to organize and intensify, eventually becoming Tropical Storm Nat at 1200 UTC on the following day (see this blog post for more information).
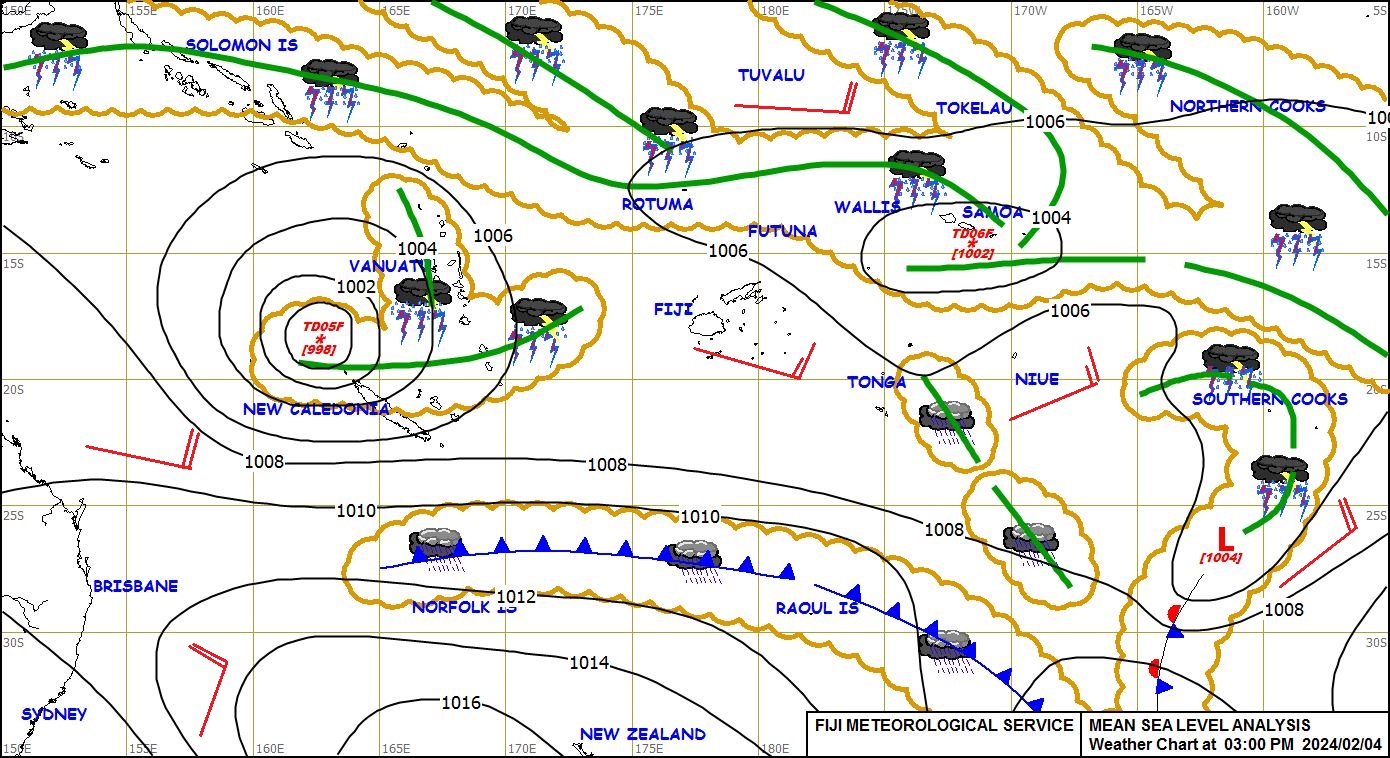
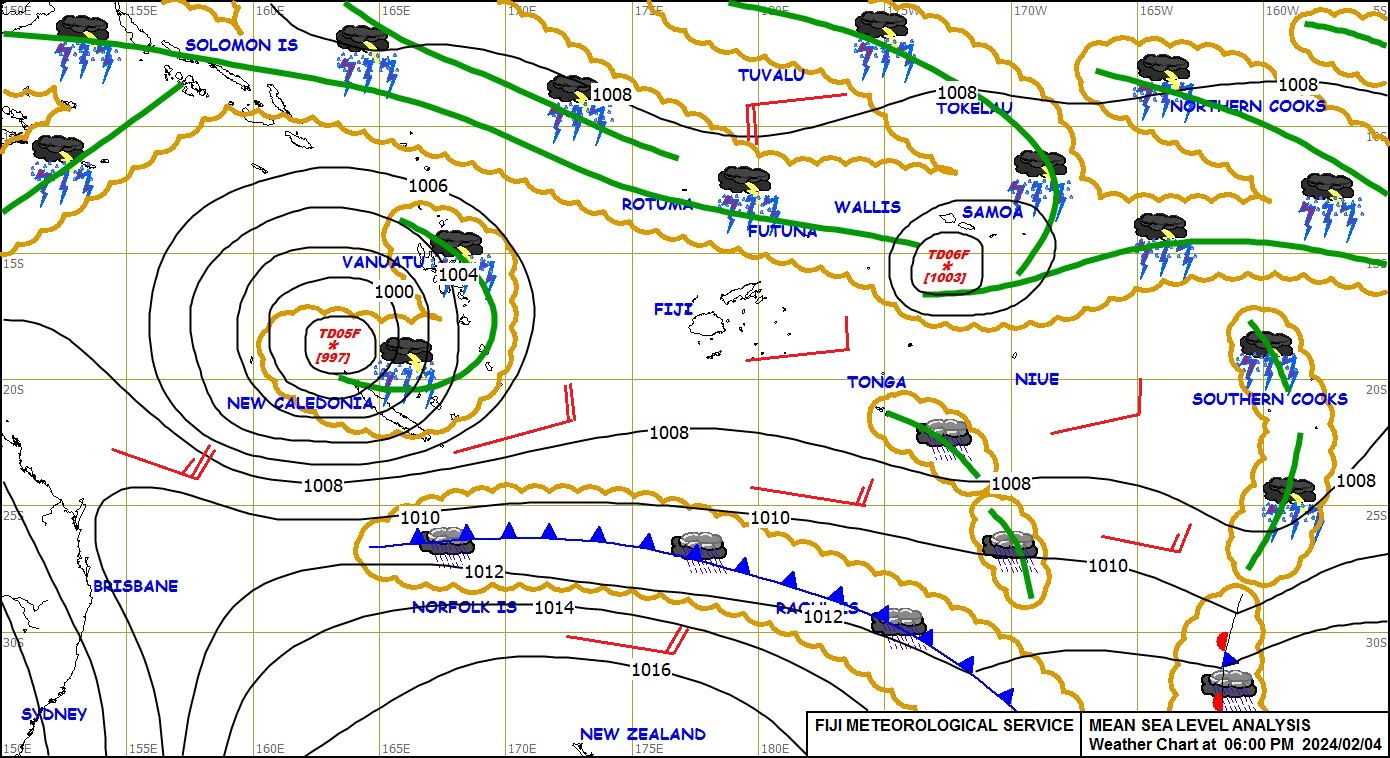
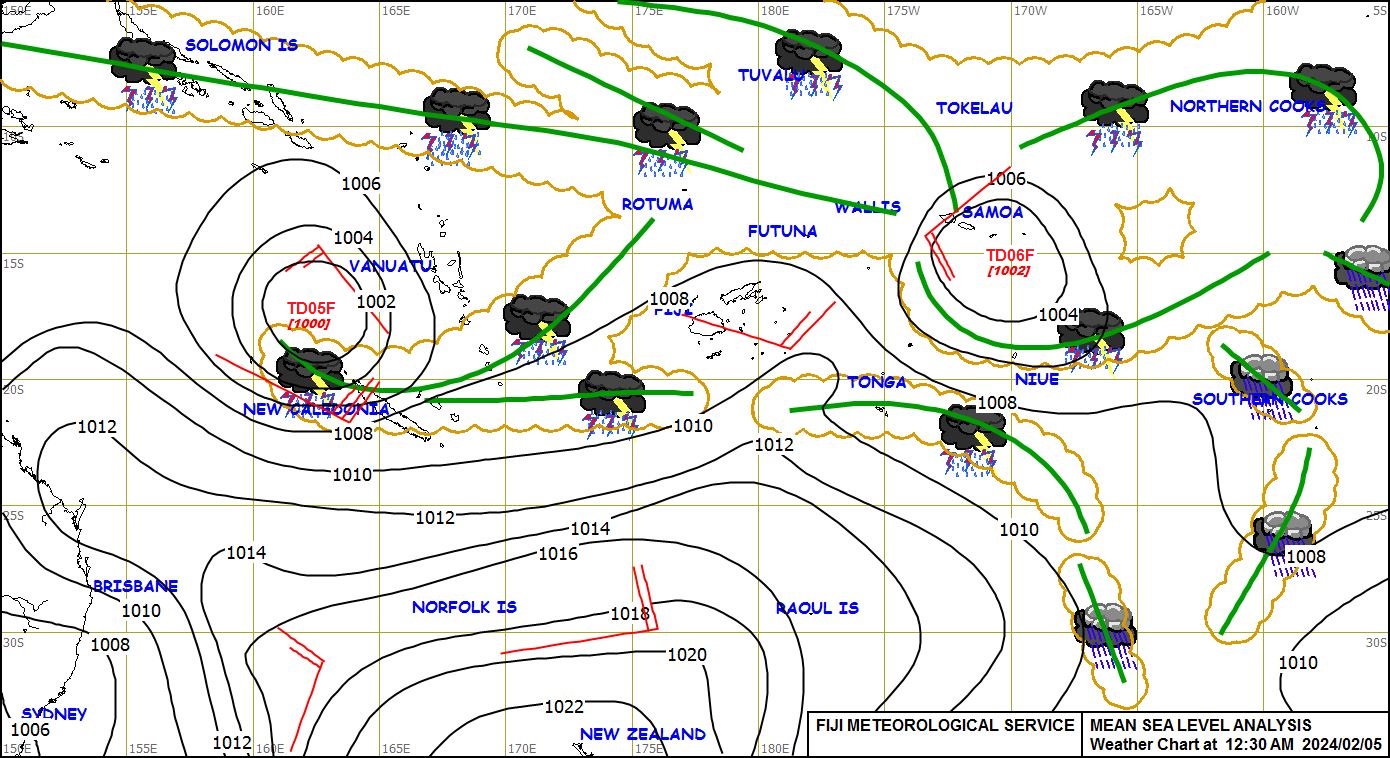
A GOES-18 Infrared image at 0710 UTC (below) included cursor sampling of the associated Level 2 derived product Rain Rate, Cloud Top Phase and Cloud Top Height — the derived Rain Rate at that cold (-92ºC) overshooting top was 3.94 inches per hour.
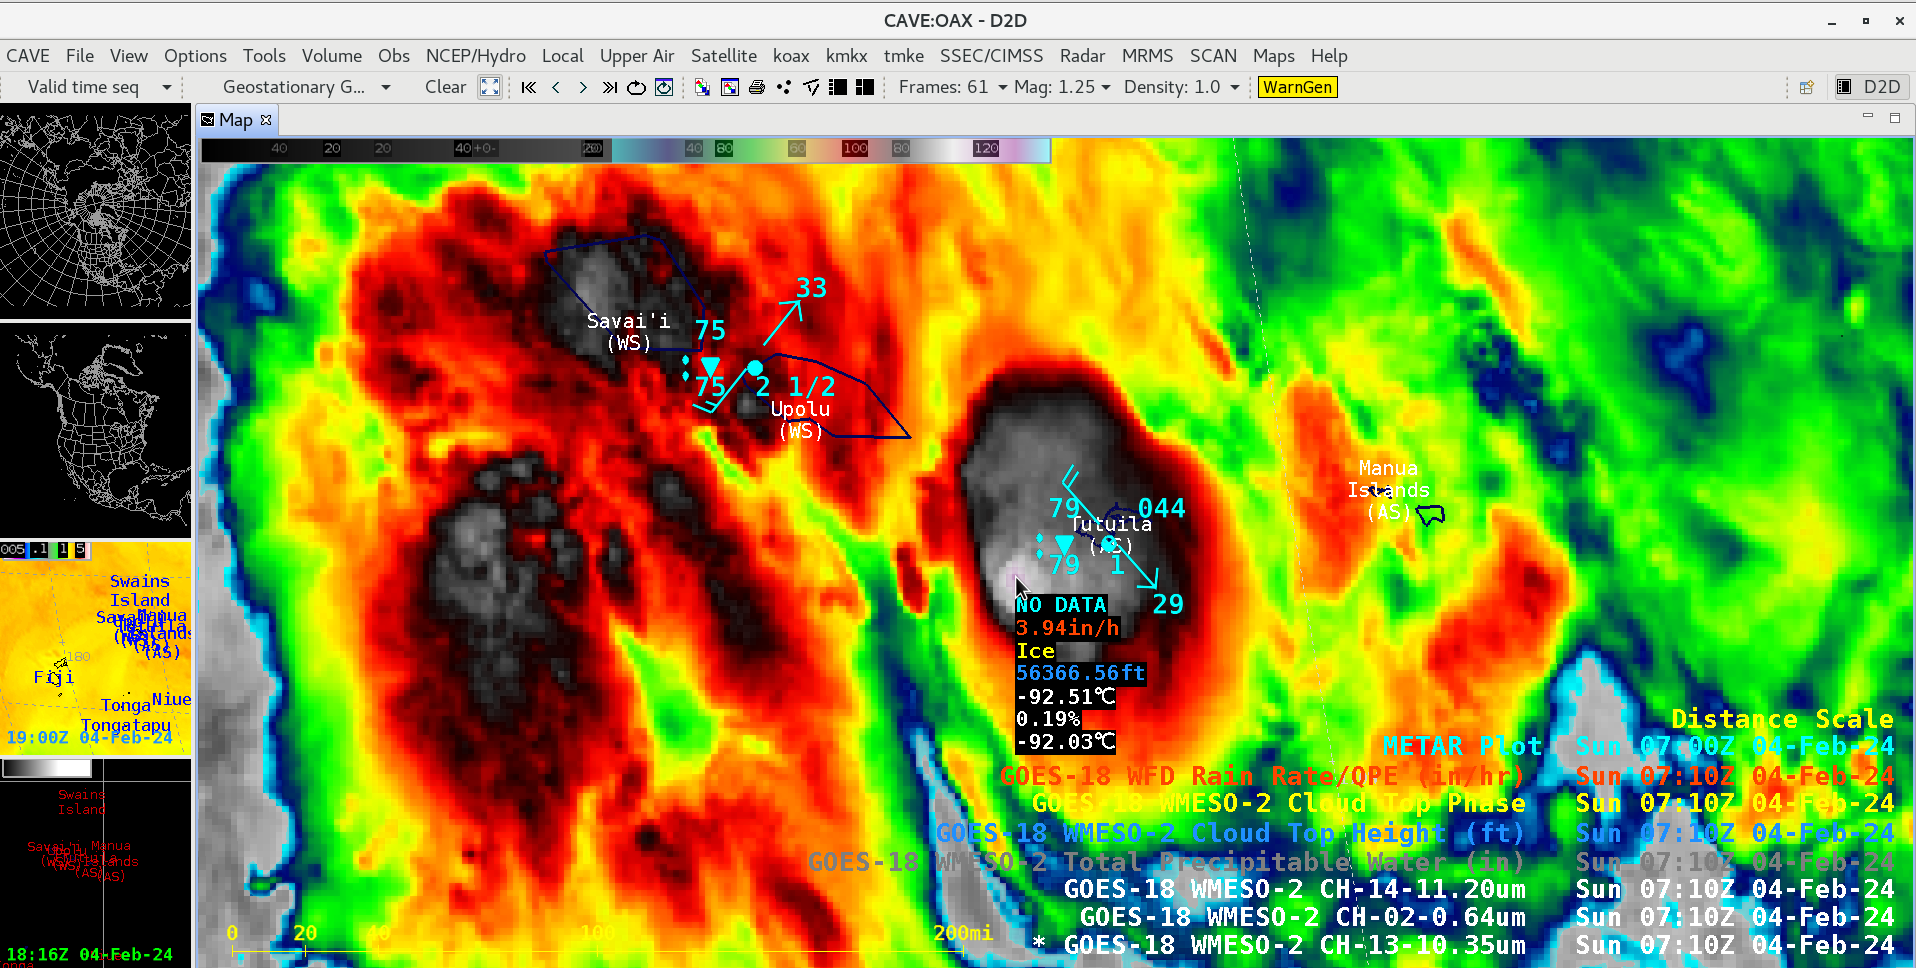
GOES-18 Infrared image at 0710 UTC on 04 February, with cursor sampling of the associated Level 2 Rain Rate, Cloud Top Phase and Cloud Top Height [click to enlarge]
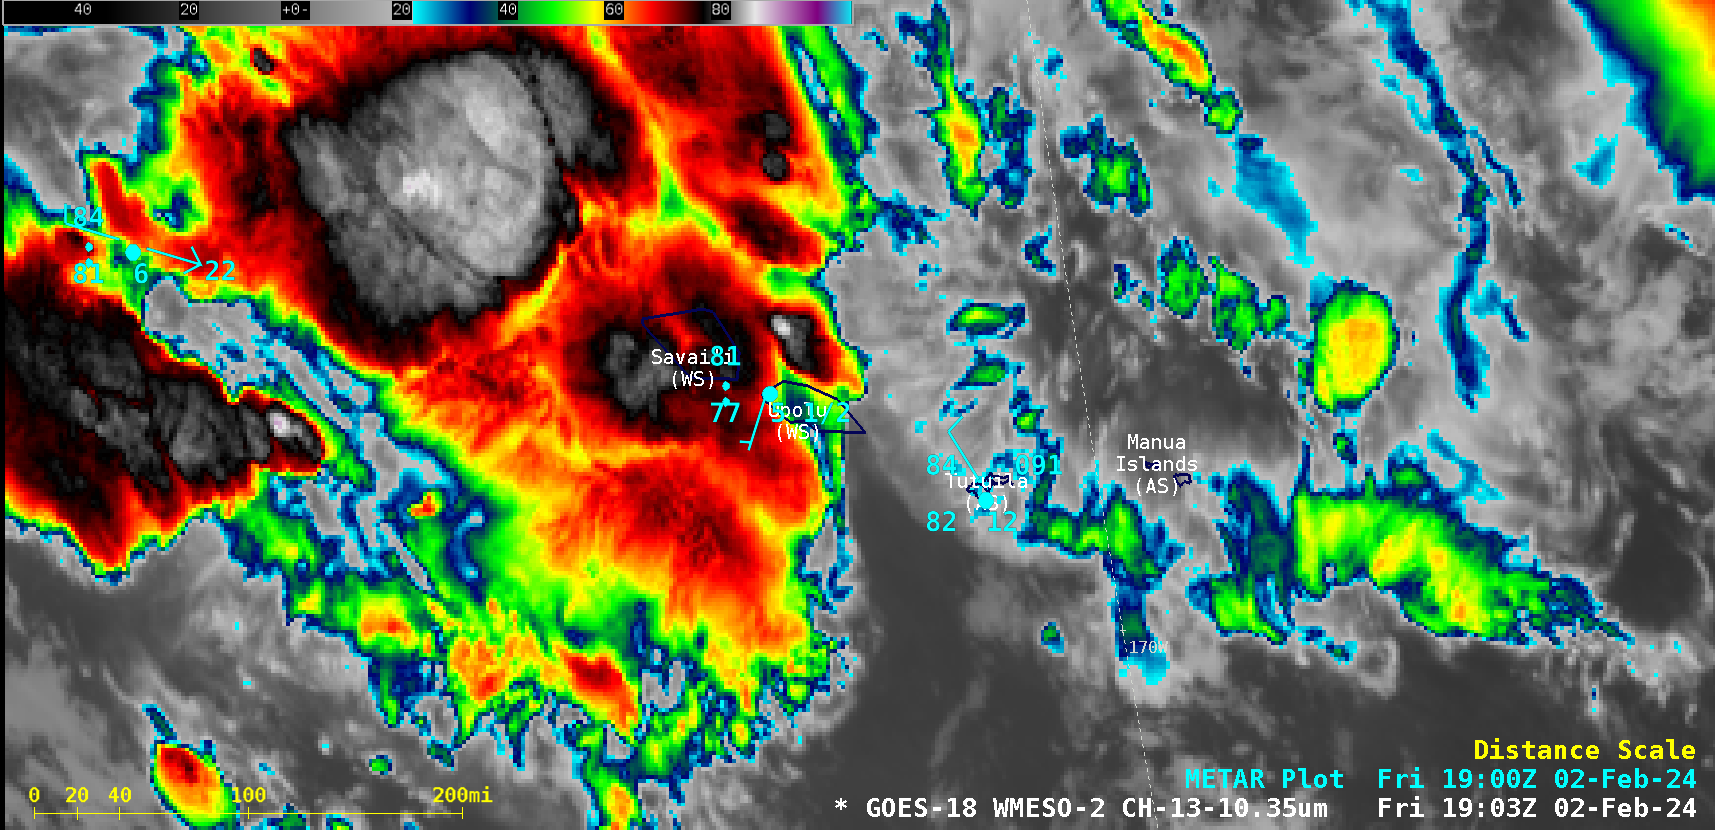
1-minute GOES-18 Infrared images, from 1200 UTC on 02 February to 1959 UTC on 04 February [click to play MP4 animation]