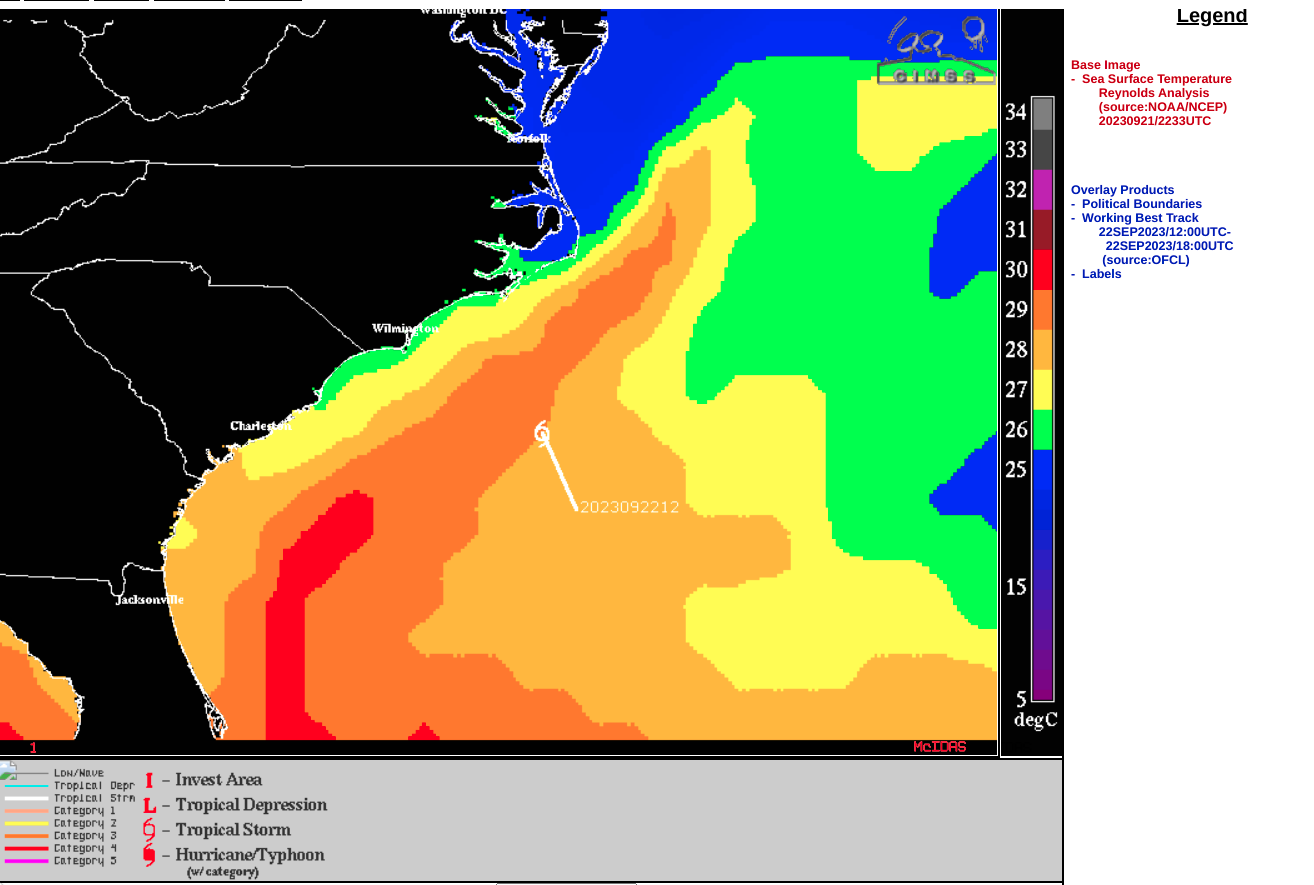
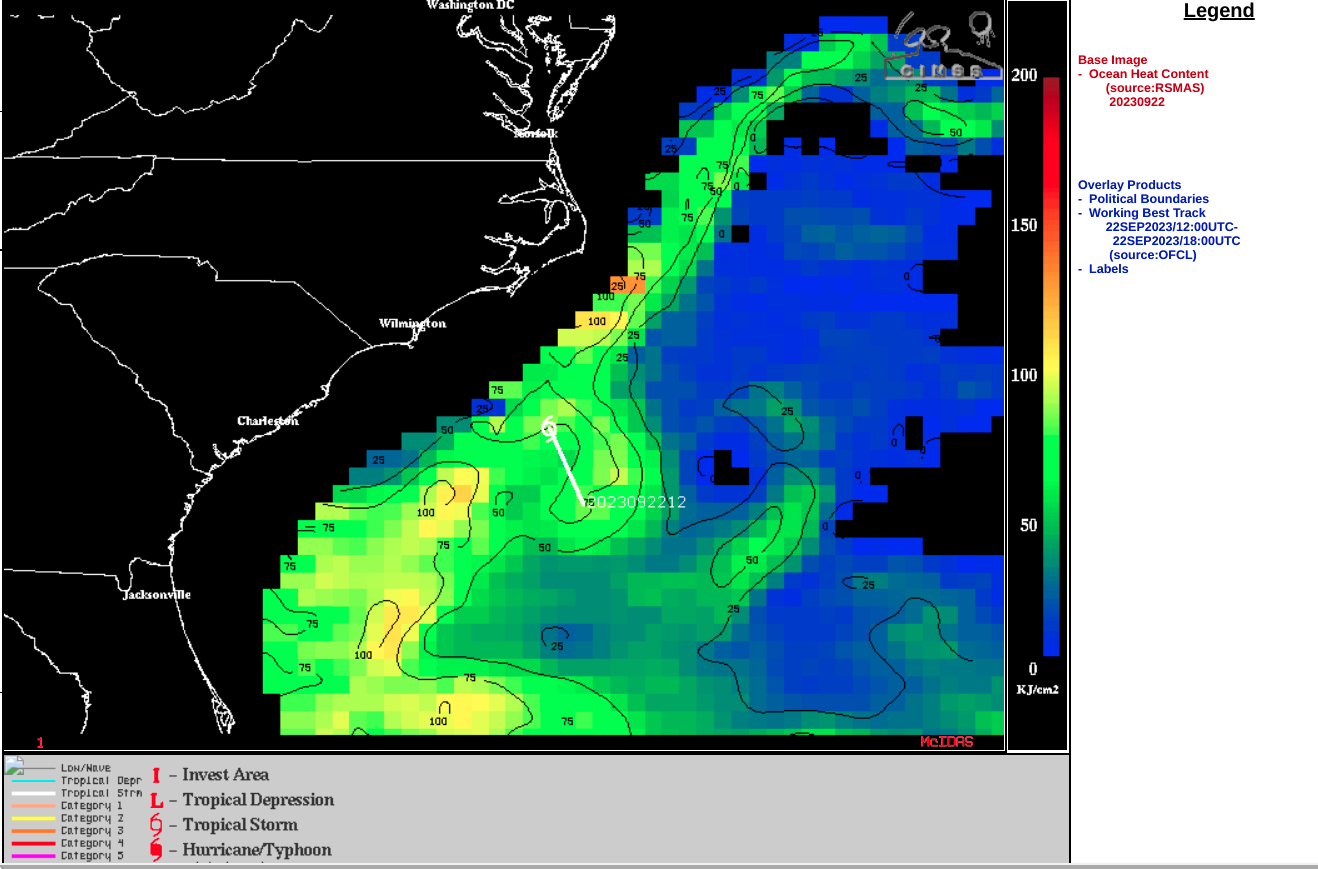
Tropical Storm Ophelia makes landfall in North Carolina

GOES-16 “Red” Visible (0.64 µm) and “Clean” Infrared Window (10.3 µm) images, from 1700-2250 UTC on 22 September [click to play animated GIF | MP4]
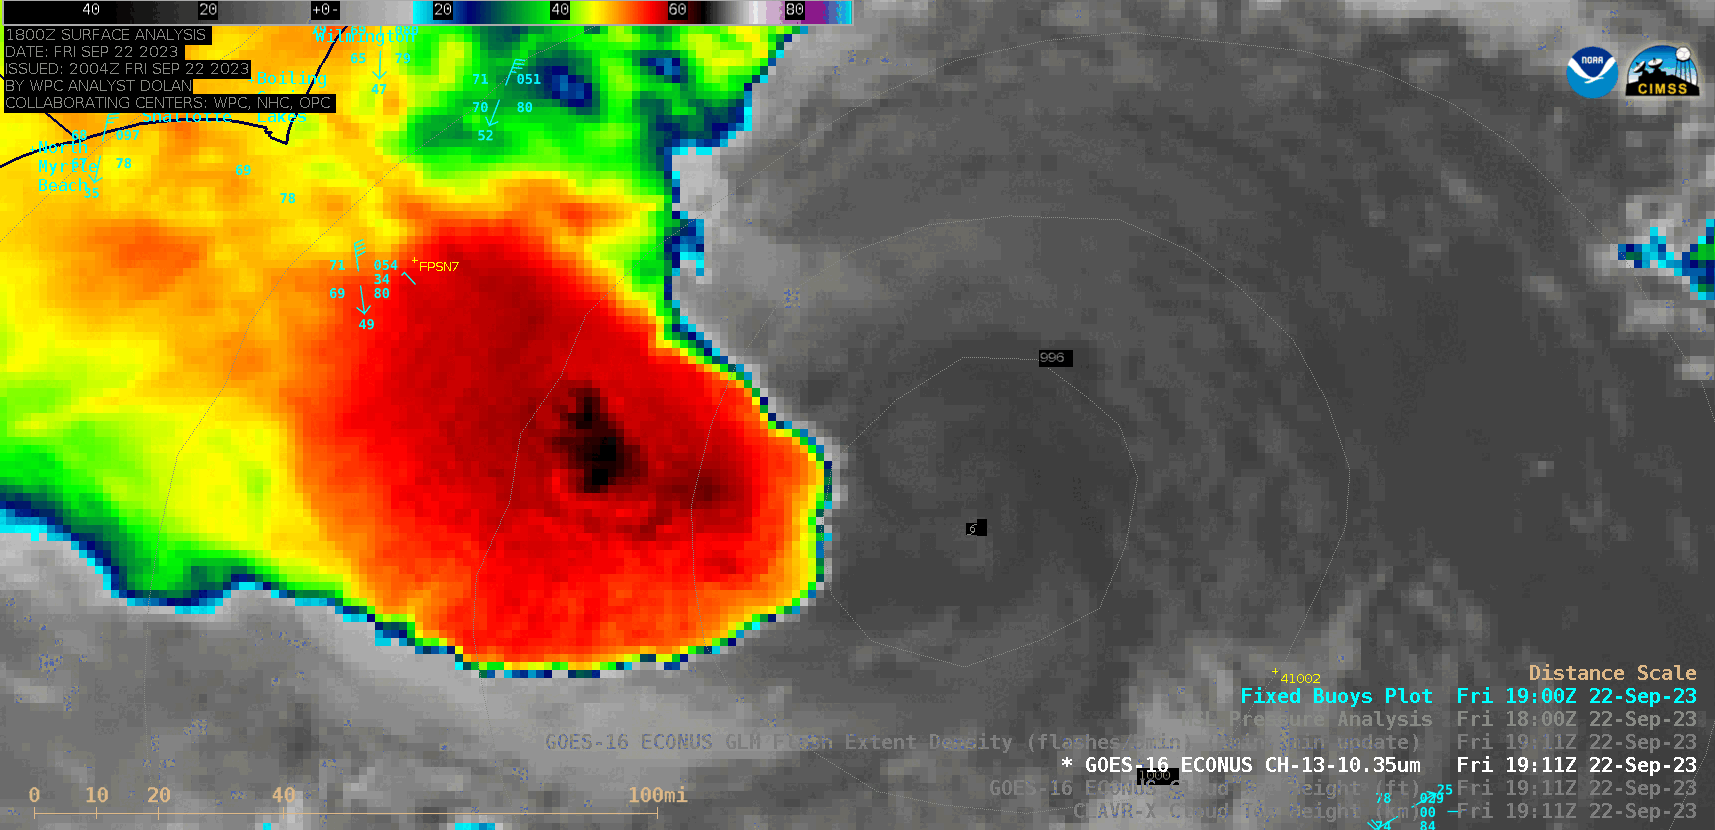
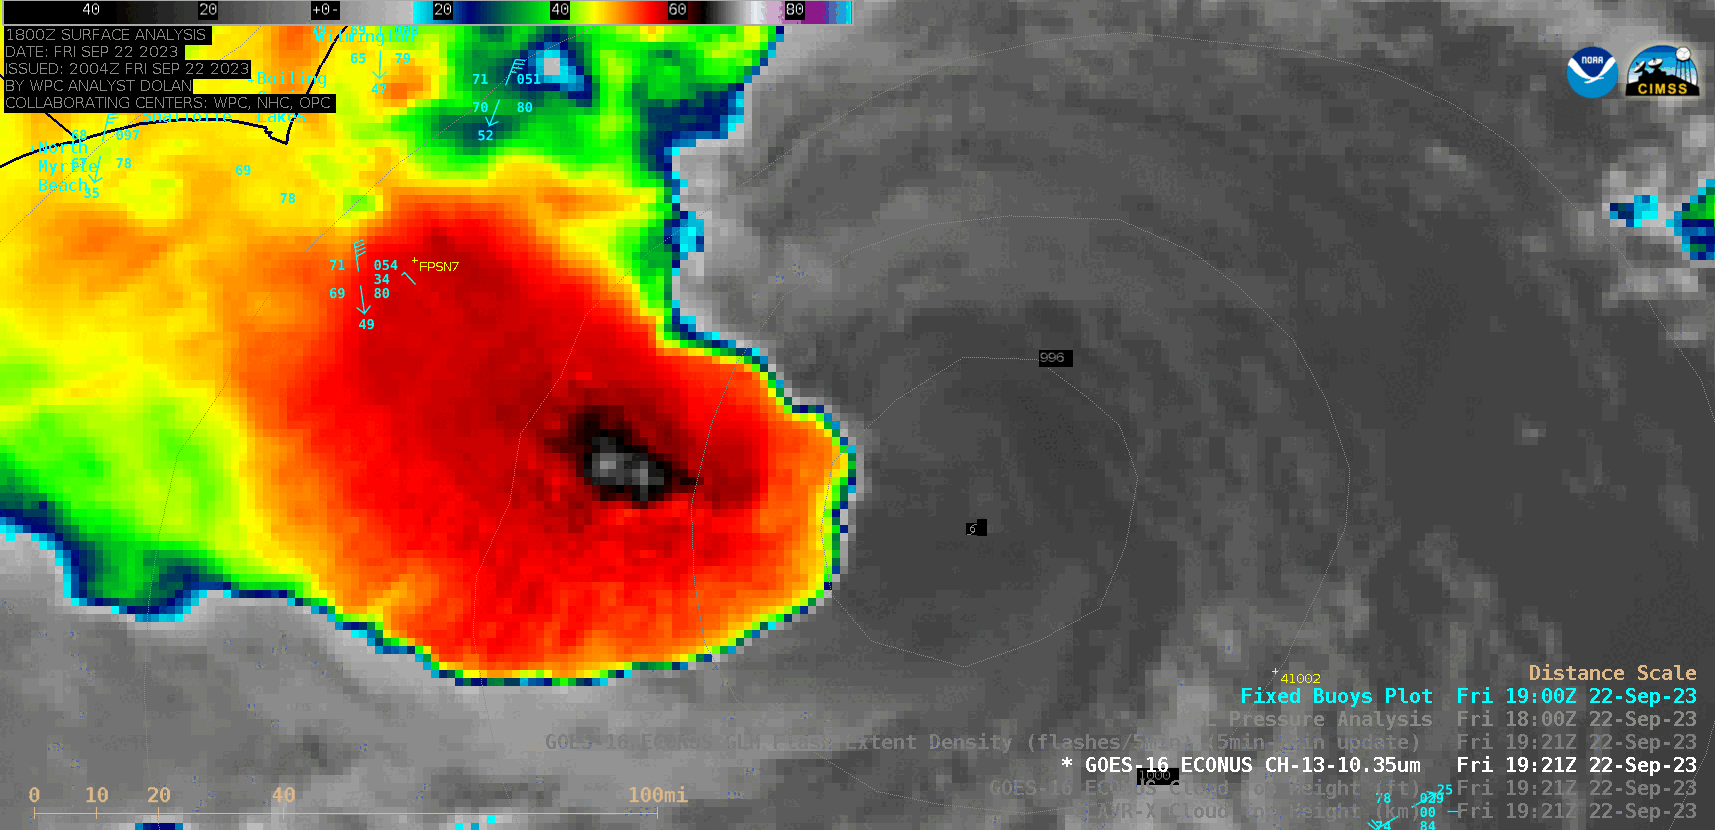
1-minute GOES-16 Infrared images with/without an overlay of GLM Flash Extent Density (below) indicated that lightning activity began to increase around 1900 UTC, as smaller-scale pulses of embedded convection started to exhibit cloud-top infrared brightness temperatures around -70ºC. A notable lightning jump was evident from 1925-1945 UTC.

GOES-16 “Clean” Infrared Window (10.3 µm) images, with/without an overlay of GLM Flash Extent Density, from 1700-2259 UTC on 22 September [click to play animated GIF | MP4]
GOES-16 “Clean” Infrared Window (10.3 µm) images, with/without an overlay of GLM Flash Extent Density, from 1911-1951 UTC on 22 September [click to play animated GIF | MP4]
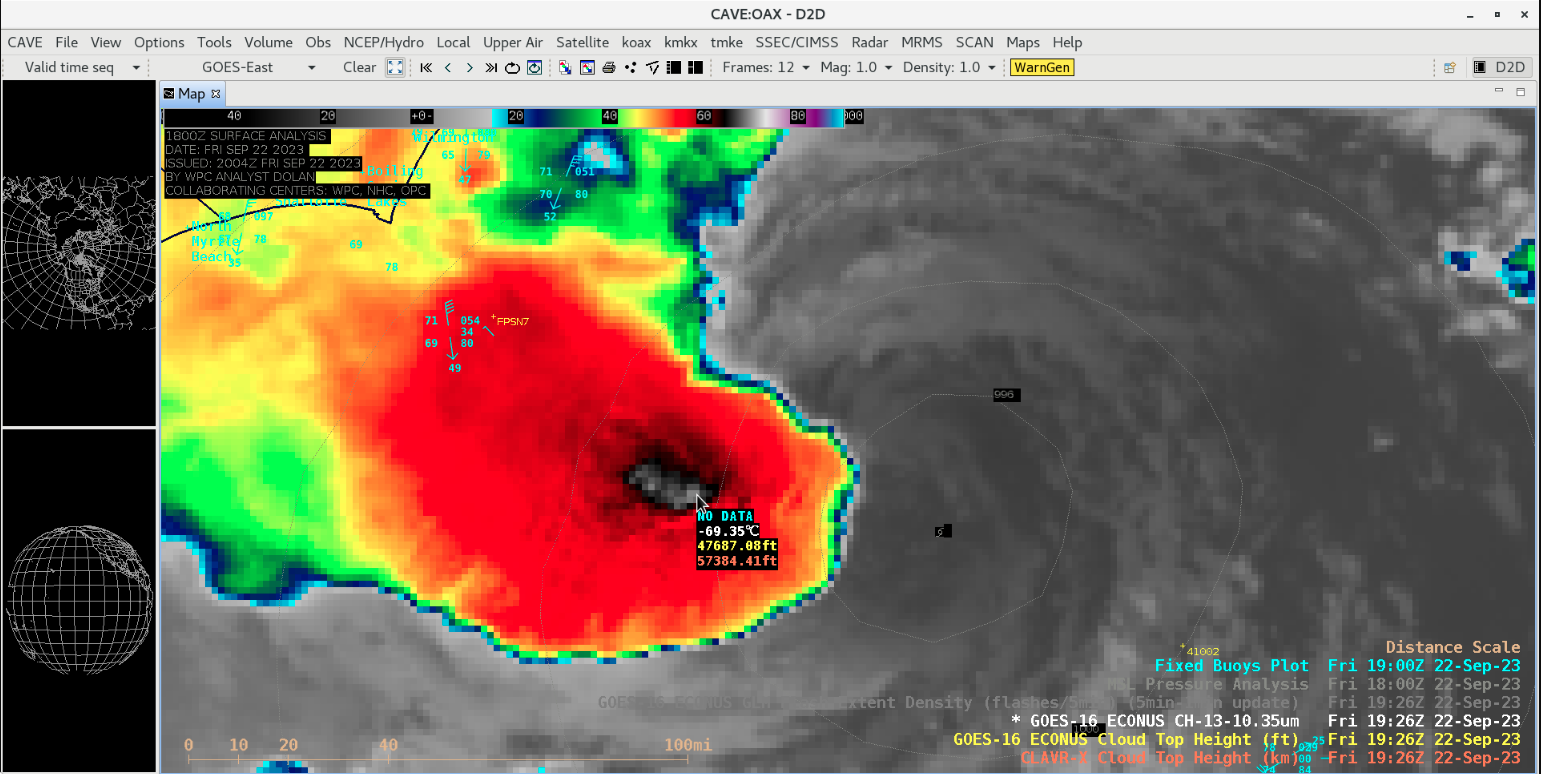
GOES-16 Infrared (10.3 µm), CLAVR-x Cloud Top Height and Operational Cloud Top Height derived products at 1921 UTC [click to enlarge]

GOES-16 Infrared (10.3 µm), CLAVR-x Cloud Top Height and Operational Cloud Top Height derived products at 1926 UTC [click to enlarge]

GOES-16 “Clean” Infrared Window (10.3 µm) images, with/without an overlay of GLM Flash Extent Density, from 0500-1100 UTC on 23 September [click to play animated GIF | MP4]
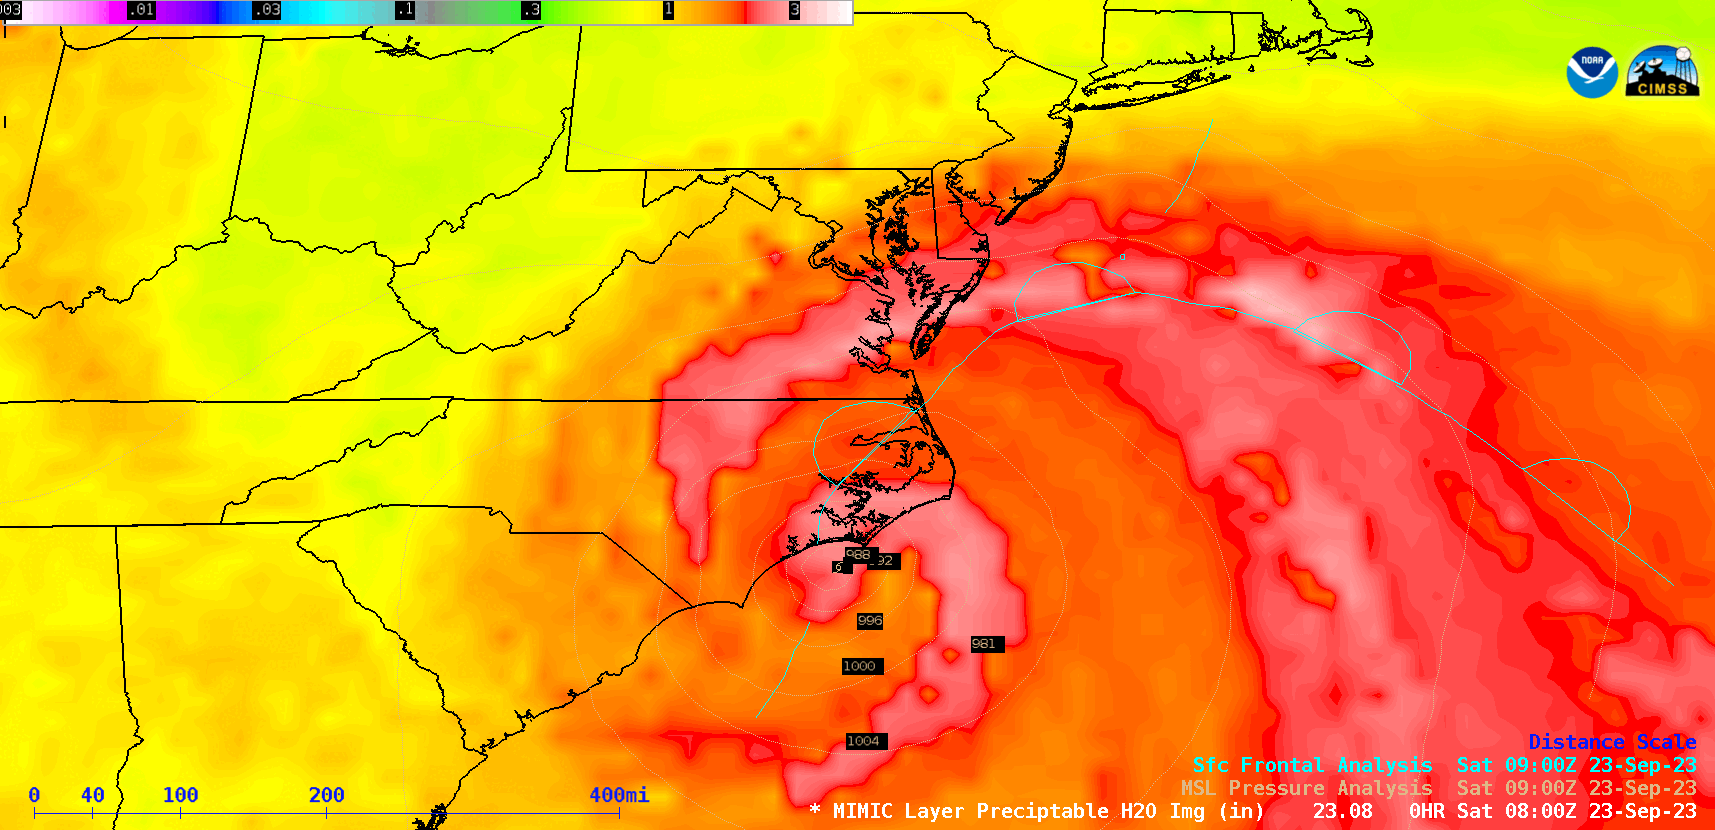
MIMIC Total Precipitable Water product, from 0800 UTC on 23 September to 0100 UTC on 24 September [click to play animated GIF | MP4]