Hurricane Idalia makes landfall along the Big Bend coast of Florida

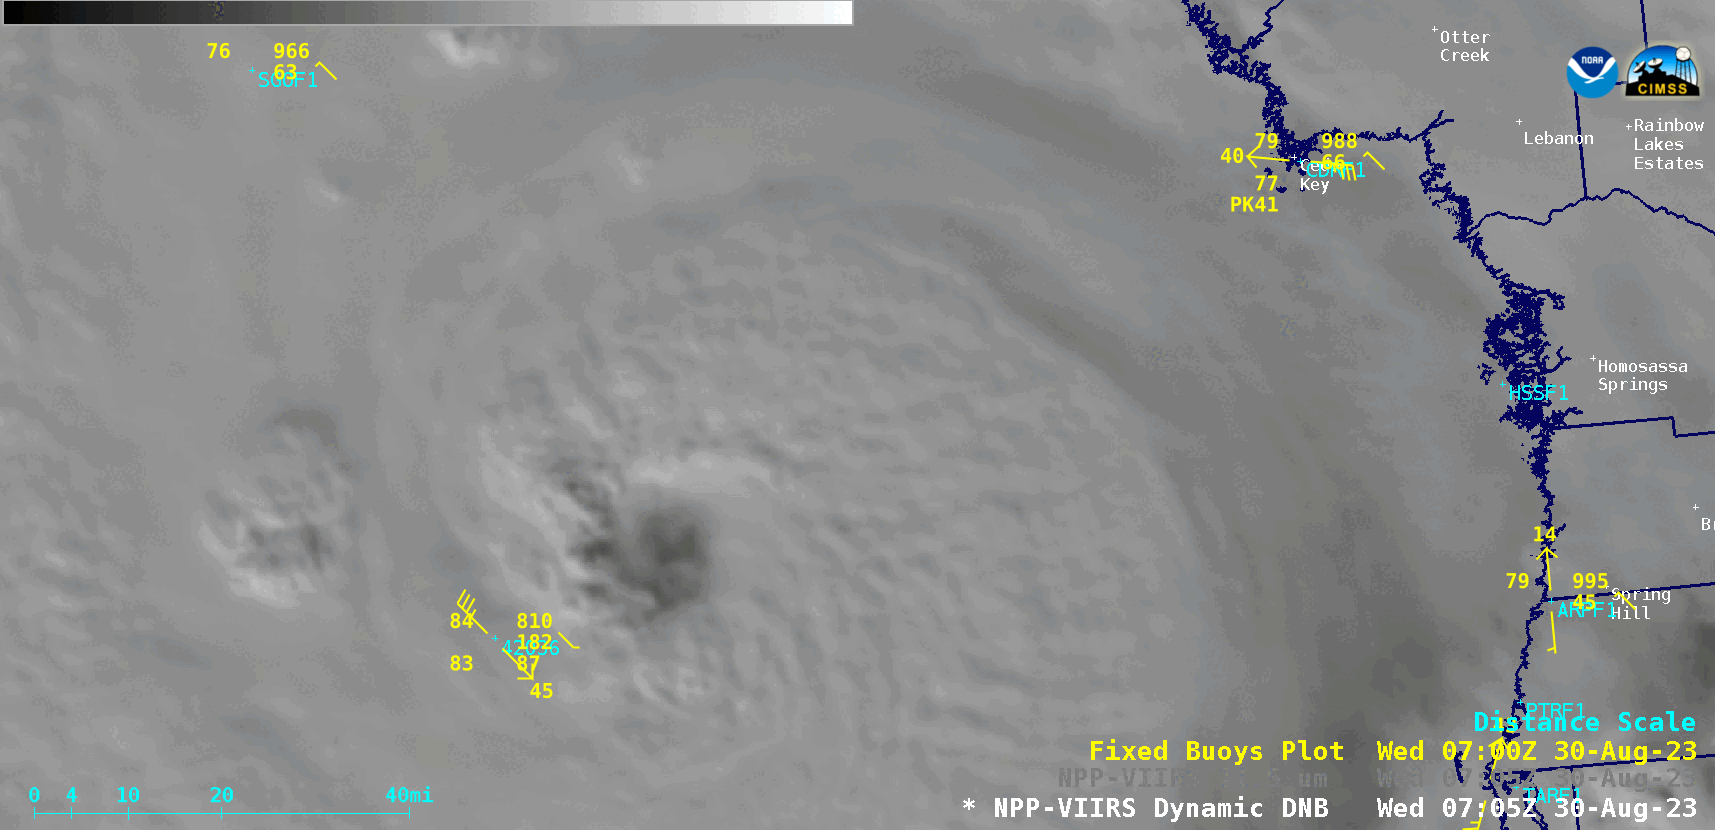
30-second GOES-16 “Red” Visible (0.64 µm, top) and “Clean” Infrared Window (10.3 µm, bottom) images (with/without an overlay of GLM Flash Extent Density) from 1000-1300 UTC, which include plots of 15-minute METAR surface reports (cyan) and hourly Fixed Buoy reports (green) [click to play animated GIF | MP4]
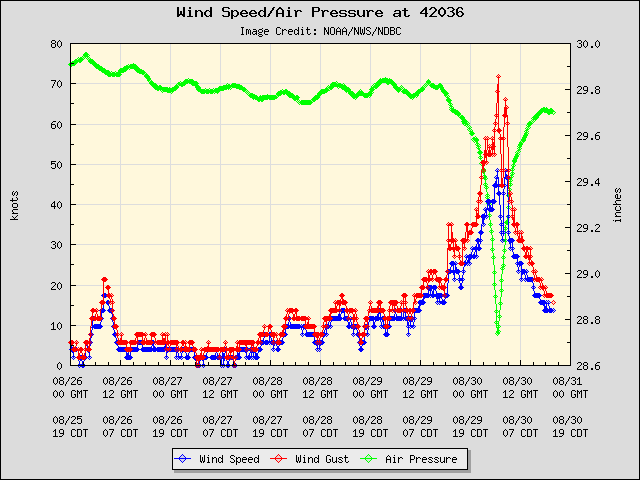
Note that the peak wind gust at the Keaton Beach buoy (KTNF1, located along the coast near the center of the GOES-16 images) was 72 knots at 1100 UTC — then the wind speed dropped to 0 knots (calm) at 1200 UTC as the eye of Idalia moved over that buoy location upon making landfall (below). The raw surface report data indicated that the continuous wind speed was 37.1 m/s (65 knots) at 1120 UTC.
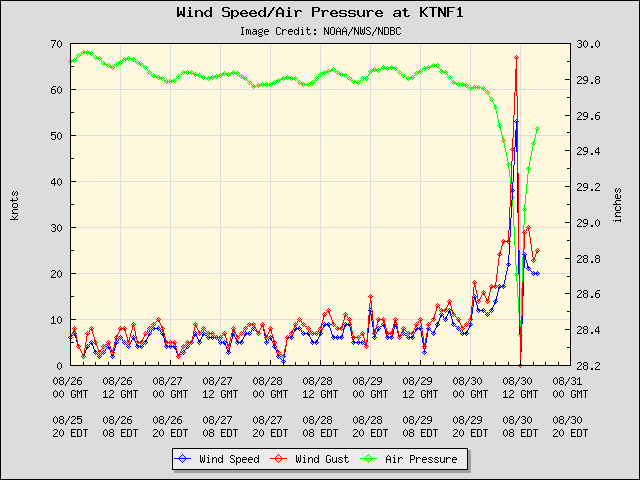
Plots of Pressure (green), wind speed (blue) and wind gust (red) at Buoy KTNF1 (Keaton Beach).
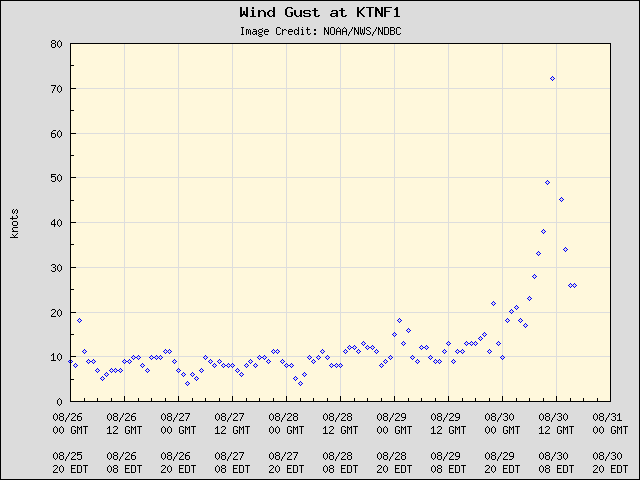
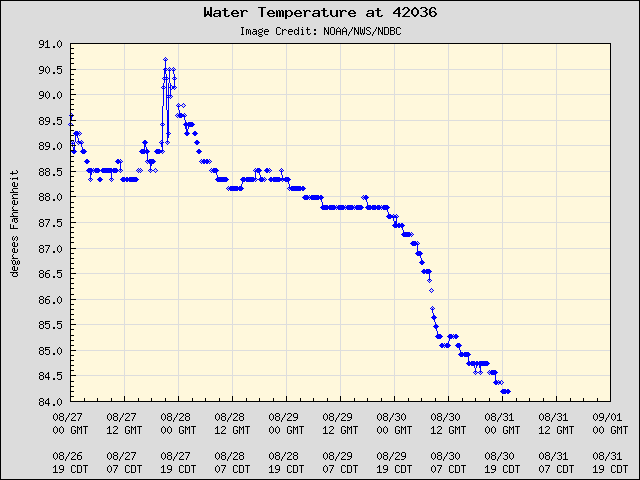
Plot of peak wind gusts at Buoy KTNF1 (Keaton Beach).
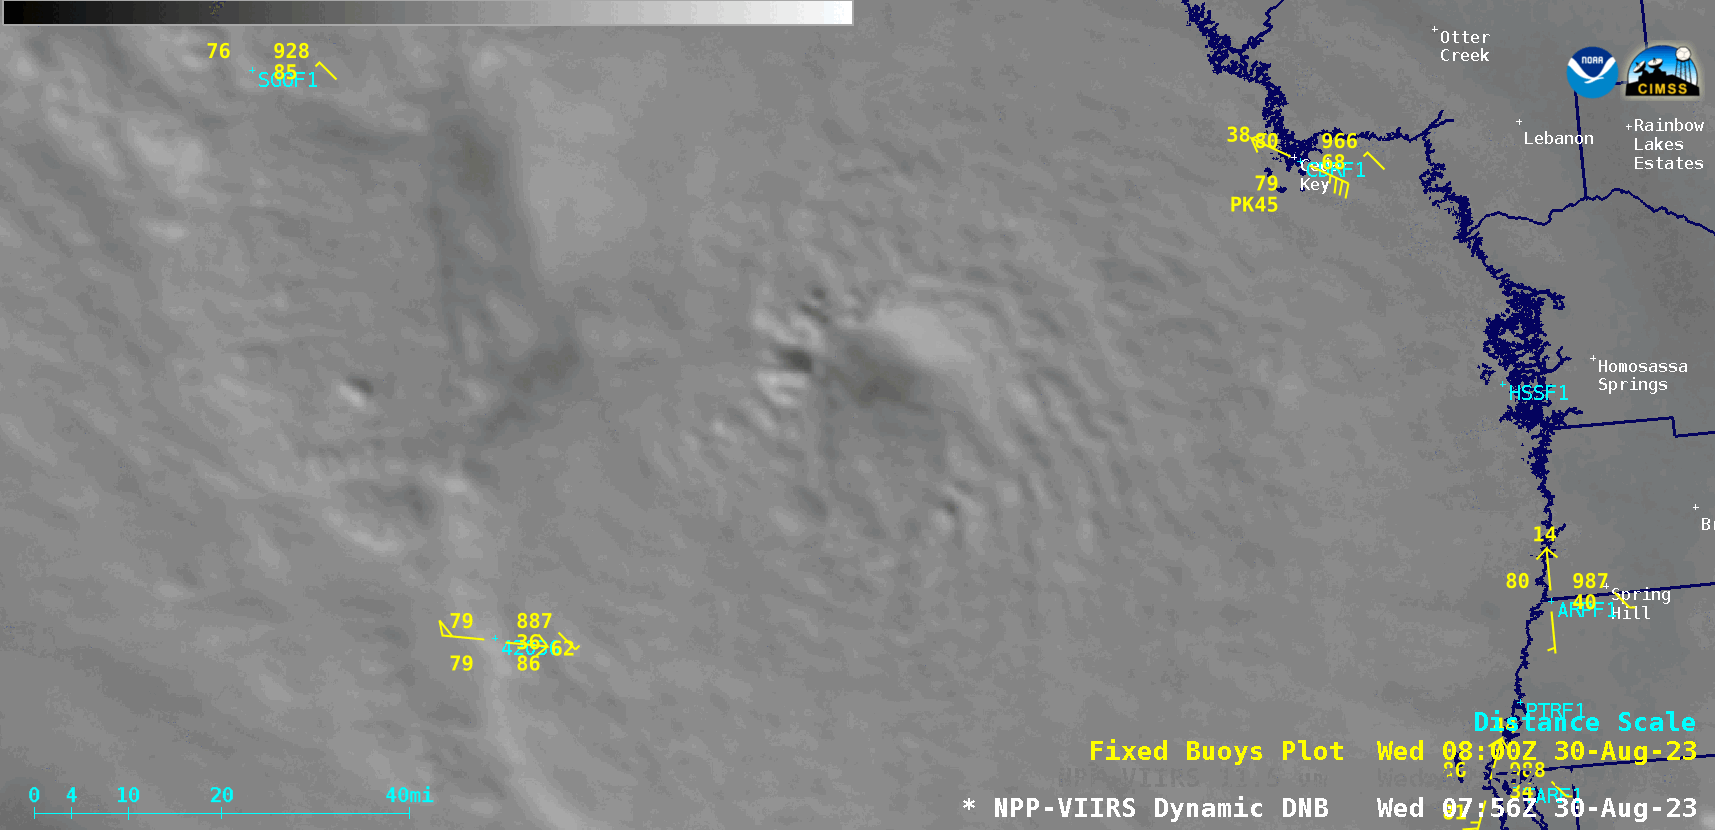
An image (source) of RCM-1 Synthetic Aperture Radar (SAR) winds at 1140 UTC (just prior to the time of landfall) is shown below.
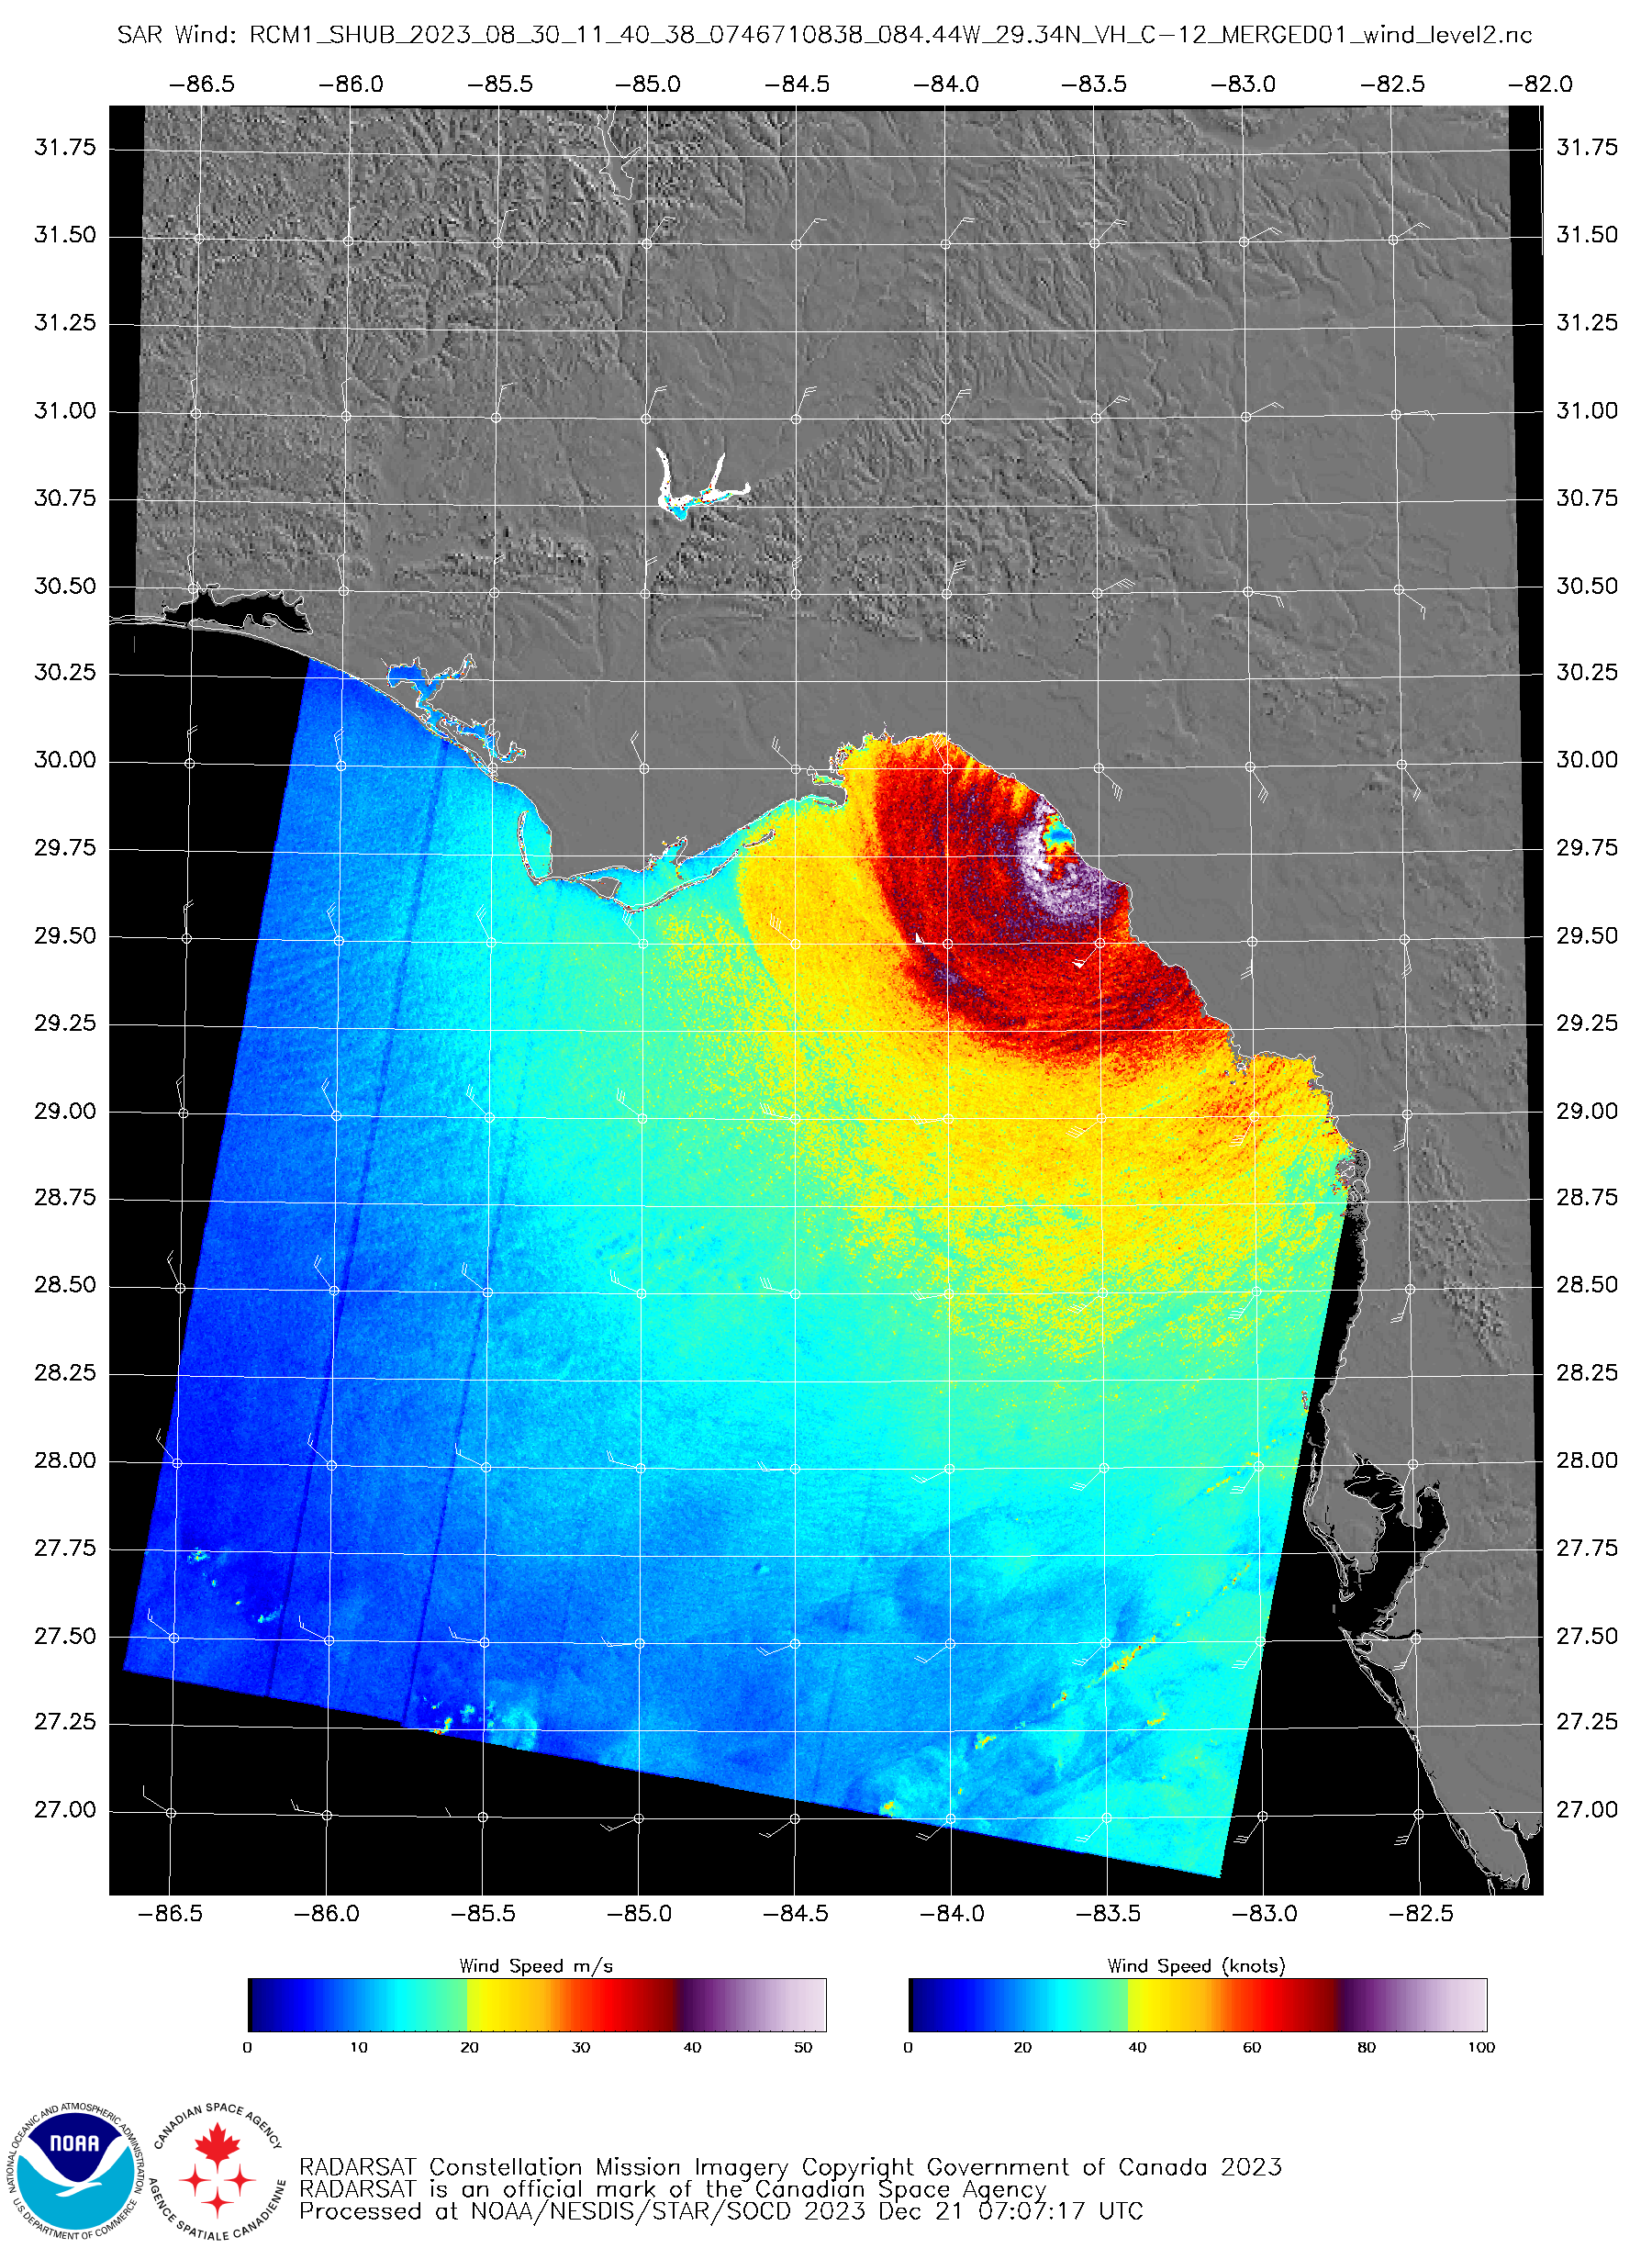
RCM-1 SAR winds at 1140 UTC [click to enlarge]

30-second GOES-16 “Clean” Infrared Window (10.3 µm) images from 0430-1200 UTC, with hourly Fixed Buoy reports plotted in white [click to play animated GIF | MP4]
NOAA-20 VIIRS Day/Night Band (0.7 µm) and Infrared Window (11.45 µm) images valid at 0715 UTC [click to enlarge]
Suomi-NPP VIIRS Day/Night Band (0.7 µm) and Infrared Window (11.45 µm) images valid at 0805 UTC [click to enlarge]