Heavy rainfall and flash flooding across North Texas

GOES-16 Visible/Infrared Sandwich RGB images, with hourly surface precipitation amounts plotted in white [click to play animated GIF | MP4]
1-minute Mesoscale Domain Sector GOES-16 (GOES-East) Visible/Infrared Sandwich RGB images from 1300-1800 UTC (above) included plots of 1-hour surface precipitation amounts — and showed clusters of thunderstorms moving across North Texas and the greater Dallas/Fort Worth area early in the day on 22 August 2022. These storms were focused along a quasi-stationary surface front that was draped across the region; heavy rainfall during this 5-hour period caused additional flash flooding in locations that had already received substantial precipitation within the previous 24 hours.
A GOES-16 Visible/Infrared Sandwich RGB image at 1410 UTC (below) displayed cursor readouts of the 3 RGB components along with the available Level 2 Derived Products — cloud-top infrared brightness temperatures were colder than -80ºC, Cloud-Top Heights were greater than 54,000 feet and Rainfall Rates were nearly 3.7 inches per hour just south of Terrell, Texas. The Dallas/Fort Worth airport received a record 3.01 inches of rain in 1 hour (tweet).
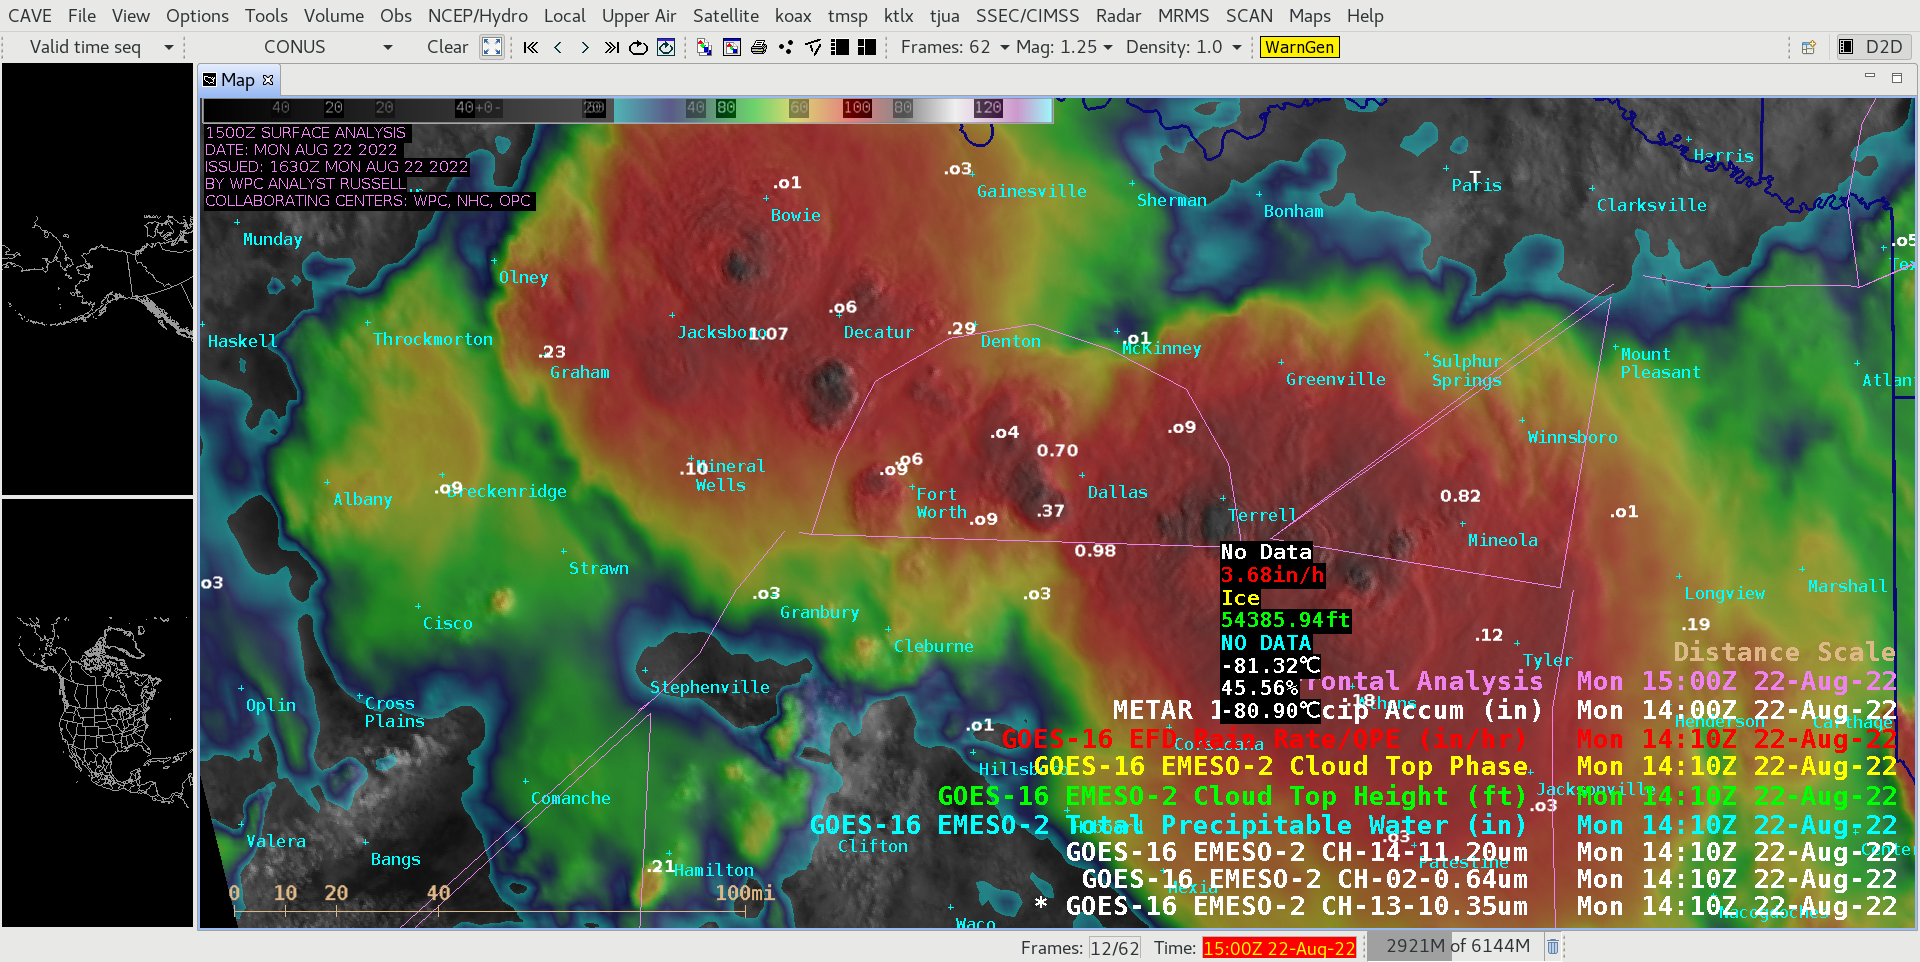
GOES-16 Visible/Infrared Sandwich RGB image at 1410 UTC, with cursor readouts of RGB components and Level 2 Derived Products [click to enlarge]
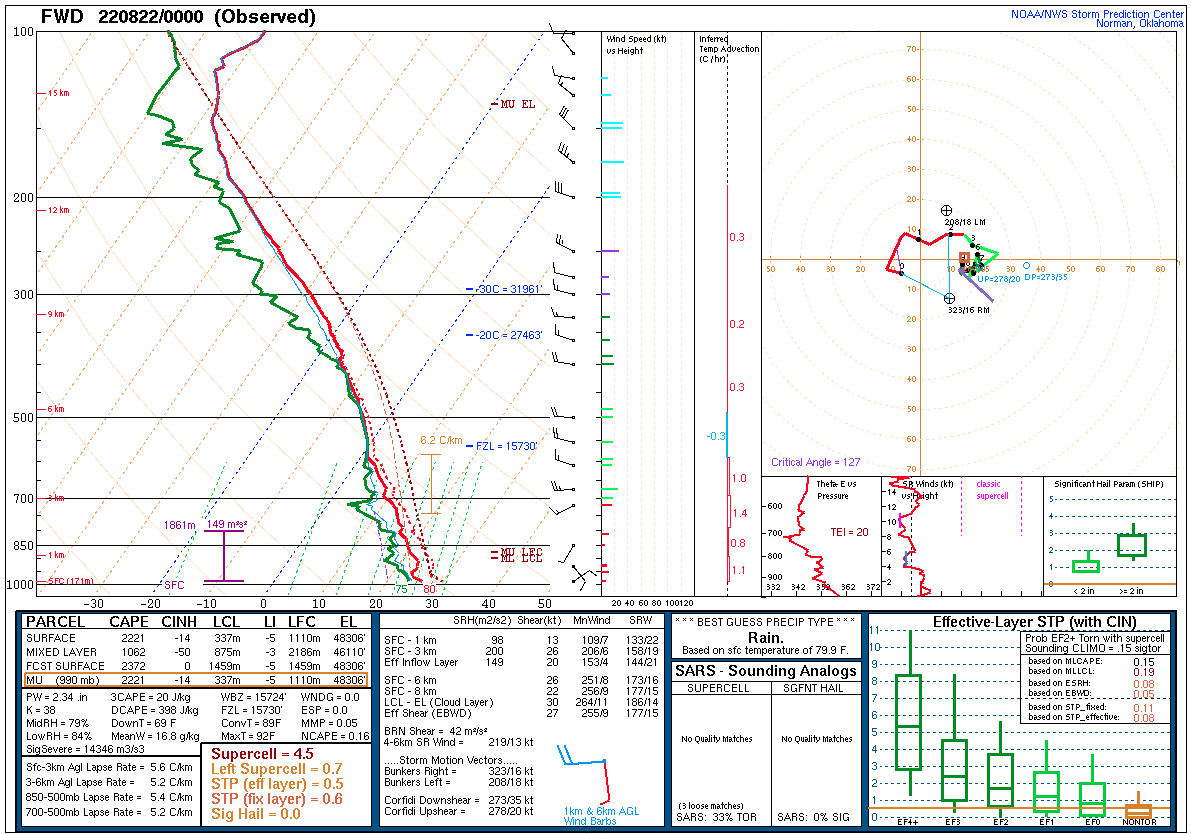
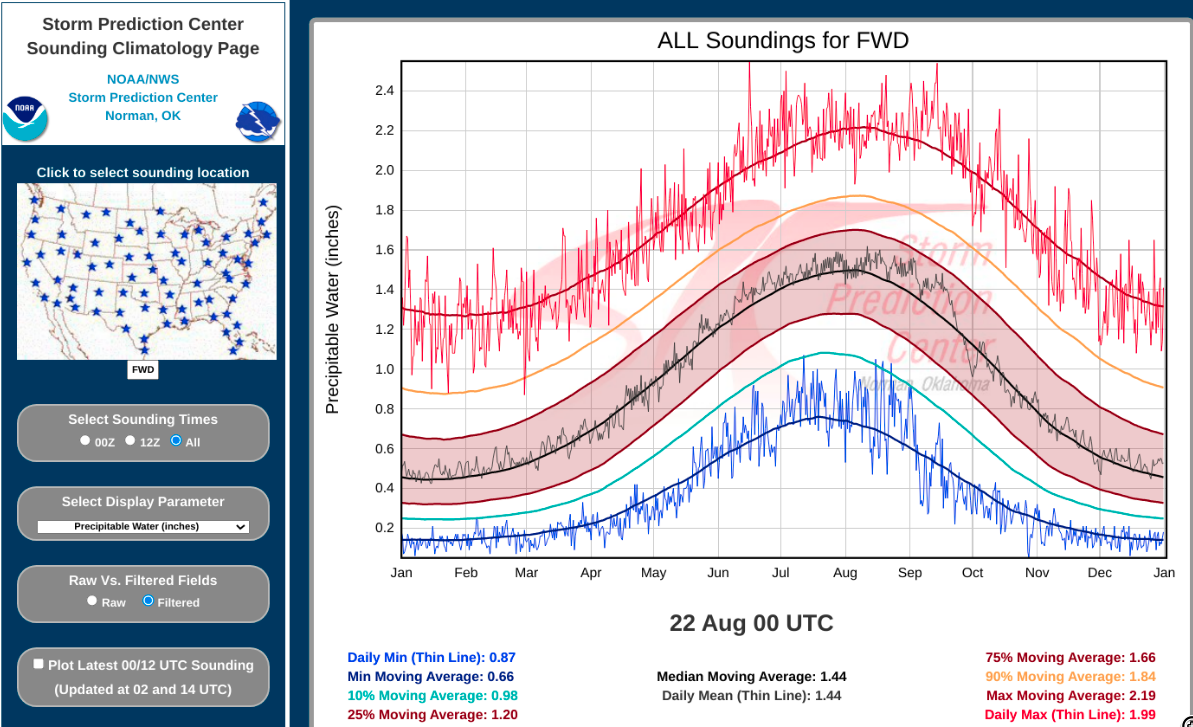
Hourly MIMIC Total Precipitable Water images viewed using RealEarth (below) depicted TPW values in the 60-70 mm (2.4-2.8 inches) range, with a peak value of 78 mm (3.1 inches). The 22 August / 00 UTC rawinsonde report from Fort Worth had a TPW value of 2.34 inches, which was a record maximum value for that date/time.
MIMIC Total Precipitable Water product [click to play animated GIF]
Additional satellite imagery and information about this event can be found on the Satellite Liaison Blog.