Eruption of the Kilauea volcano in Hawai’i
![GOES-17 Shortwave Infrared (3.9 µm) and "Clean" Infrared Window (10.35 µm) images [click to play animation | MP4]](https://cimss.ssec.wisc.edu/satellite-blog/images/2020/12/201221_goes17_shortwaveInfrared_infraredWindow_Kilauea_eruption_HI_anim.gif)
GOES-17 Shortwave Infrared (3.9 µm) and “Clean” Infrared Window (10.35 µm) images [click to play animation | MP4]
GOES-17 Near-infrared (1.61 µm and 2.24 µm) and Shortwave Infrared images (below) showed the variation in thermal signatures during the hours leading up to sunrise. The signature in Near-Infrared imagery was occasionally attenuated by the passage of trade wind cumulus clouds over the eruption site.
![GOES-17 Near-infrared (1.61 µm and 2.24 µm) and Shortwave Infrared (3.9 µm) images [click to play animation | MP4]](https://cimss.ssec.wisc.edu/satellite-blog/images/2020/12/201221_goes17_nearInfrared_shortwavenfrared_Kilauea_eruption_anim.gif)
GOES-17 Near-infrared (1.61 µm and 2.24 µm) and Shortwave Infrared (3.9 µm) images [click to play animation | MP4]
![Suomi NPP VIIRS Near-infrared (1.61 µm and 2.25 µm), Shortwave Infrared (3.75 µm) and Day/Night Band (0.7 µm) images [click to enlarge]](https://cimss.ssec.wisc.edu/satellite-blog/images/2020/12/201221_1221utc_suomiNPP_viirs_nearInfrared_shortwaveInfrared_dayNightBand_Kilauwea_HI_anim.gif)
Suomi NPP VIIRS Near-infrared (1.61 µm and 2.25 µm), Shortwave Infrared (3.75 µm) and Day/Night Band (0.7 µm) images (credit: William Straka, CIMSS) [click to enlarge]
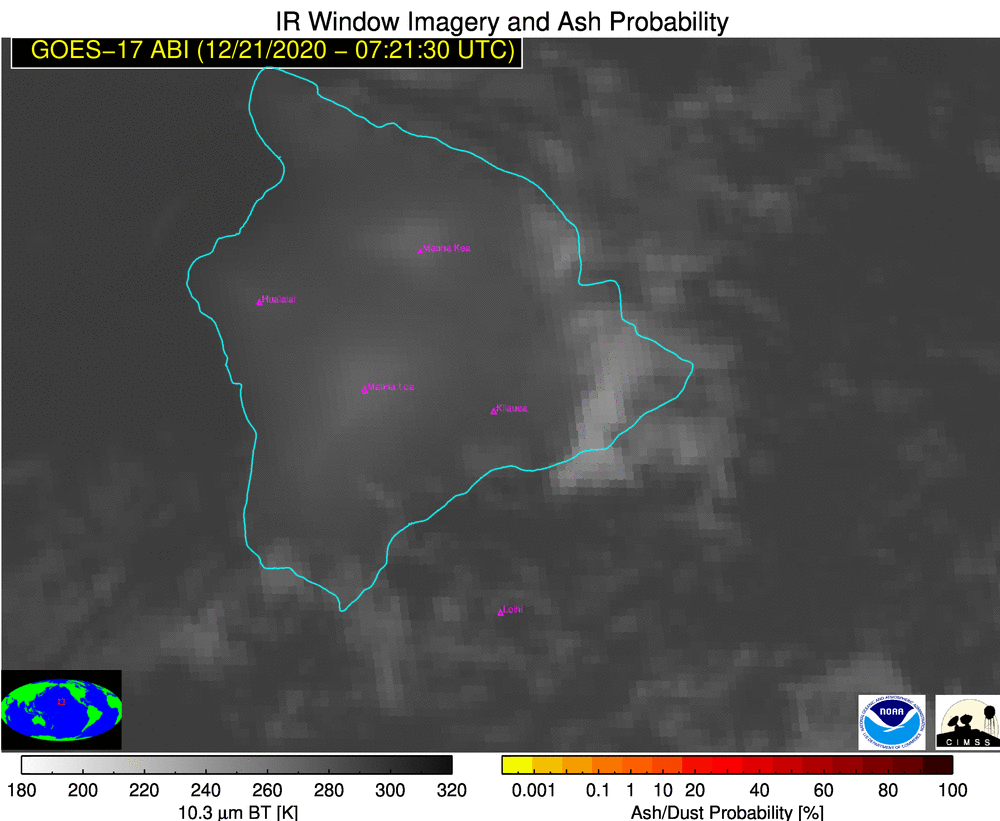
![GOES-17 Shortwave Infrared (3.9 µm), SO2 RGB and Ash RGB images [click to play animation | MP4]](https://cimss.ssec.wisc.edu/satellite-blog/images/2020/12/201221_goes17_shortwaveInfrared_so2RGB_ashRGB_Kilauea_eruption_HI_anim.gif)
GOES-17 Shortwave Infrared (3.9 µm), SO2 RGB and Ash RGB images [click to play animation | MP4]
![GOES-17 True Color RGB images [click to play animation | MP4]](https://cimss.ssec.wisc.edu/satellite-blog/images/2020/12/201221_goes17_trueColorRGB_Klauea_plume_anim.gif)
GOES-17 True Color RGB images [click to play animation | MP4]