Gravity waves over the Gulf of Mexico and Florida
![GOES-16 Low-level (7.3 µm), Mid-level (6.9 µm) and Upper-level (6.2 µm) Water Vapor images, with pilot reports of turbulence [click to play animation | MP4]](https://cimss.ssec.wisc.edu/satellite-blog/images/2020/01/200122_goes16_waterVapor_waves_GoM_FL_anim.gif)
GOES-16 Low-level (7.3 µm), Mid-level (6.9 µm) and Upper-level (6.2 µm) Water Vapor images, with pilot reports of turbulence [click to play animation | MP4]
What caused these gravity waves to form and slowly propagate southeastward is also uncertain — earning this example its place in the “What the heck is this?” blog category. The SPC Mesoscale Analysis at 07 UTC (below) did show weak convergence of 300 hPa ageostrophic winds (dark blue oval) in the entrance region of a secondary jet streak “J” over the Gulf of Mexico — this convergence could have played a role in the gravity wave development.
![SPC Mesoscale Analysis valid at 07 UTC, showing 300 hPa height, isotachs and ageostrophic winds [click to enlarge]](https://cimss.ssec.wisc.edu/satellite-blog/images/2020/01/200122_07utc_300hpa_anot.png)
SPC Mesoscale Analysis valid at 07 UTC, showing 300 hPa height, isotachs and ageostrophic winds [click to enlarge]
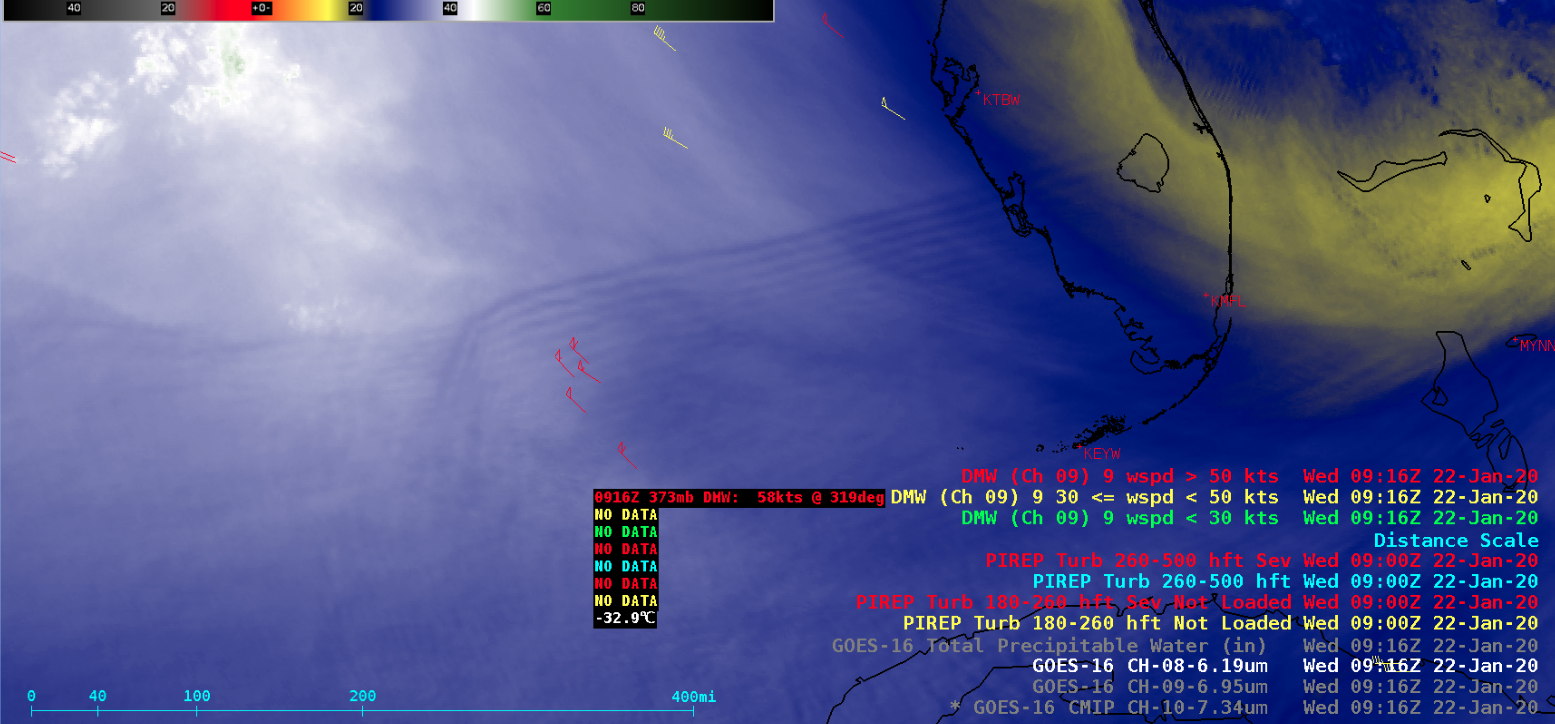
![GOES-16 Water Vapor (6.2 um) Derived Motion Winds [click to enlarge]](https://cimss.ssec.wisc.edu/satellite-blog/images/2020/01/200122_goes16_waterVapor_derivedMotionWinds_anim.gif)
GOES-16 Water Vapor (6.9 µm) Derived Motion Winds [click to enlarge]
![GOES-16 Low-level (7.3 µm) Water Vapor images, with pilot reports of turbulence [click to play animation | MP4]](https://cimss.ssec.wisc.edu/satellite-blog/images/2020/01/200122_goes16_waterVapor_band10_FL_nomap_anim.gif)
GOES-16 Low-level (7.3 µm) Water Vapor images, with pilot reports of turbulence [click to play animation | MP4]
![GOES-16 weighting functions for the 7.3 µm (violet), 6.9 µm (blue) and 6.2 µm (green) Water Vapor spectral bands, calculated using 12 UTC rawinsonde data from Miami, Florida [click to enlarge]](https://cimss.ssec.wisc.edu/satellite-blog/images/2020/01/200122_12utc_waterVapor_weightingFunctions_KMFL.png)
GOES-16 weighting functions for the 7.3 µm (violet), 6.9 µm (blue) and 6.2 µm (green) Water Vapor spectral bands, calculated using 12 UTC rawinsonde data from Miami, Florida [click to enlarge]
![GOES-16 weighting functions for the 7.3 µm (violet), 6.9 µm (blue) and 6.2 µm (green) Water Vapor spectral bands [click to enlarge]](https://cimss.ssec.wisc.edu/satellite-blog/images/2020/01/200122_12utc_waterVapor_weightingFunctions_KEYW.png)
GOES-16 weighting functions for the 7.3 µm (violet), 6.9 µm (blue) and 6.2 µm (green) Water Vapor spectral bands, calculated using 12 UTC rawinsonde data from Key West, Florida [click to enlarge]
![Climatology of Total Precipitable Water for the Key West, Florida rawinsonde site [click to enlarge]](https://cimss.ssec.wisc.edu/satellite-blog/images/2020/01/200122_12utc_kkey_tpw_climatology.png)
Climatology of Total Precipitable Water for the Key West, Florida rawinsonde site [click to enlarge]