GOES-17 becomes the operational GOES-West satellite
GOES-17 Full Disk “Red” Visible (0.64 µm) images [click to play animation | MP4]
![GOES-17 Mid-level Water Vapor (6.9 µm) images [click to play animation | MP4]](https://cimss.ssec.wisc.edu/satellite-blog/wp-content/uploads/sites/5/2019/02/190212_goes17_full_disk_waterVapor_anim.gif)
GOES-17 Mid-level Water Vapor (6.9 µm) images [click to play animation | MP4]
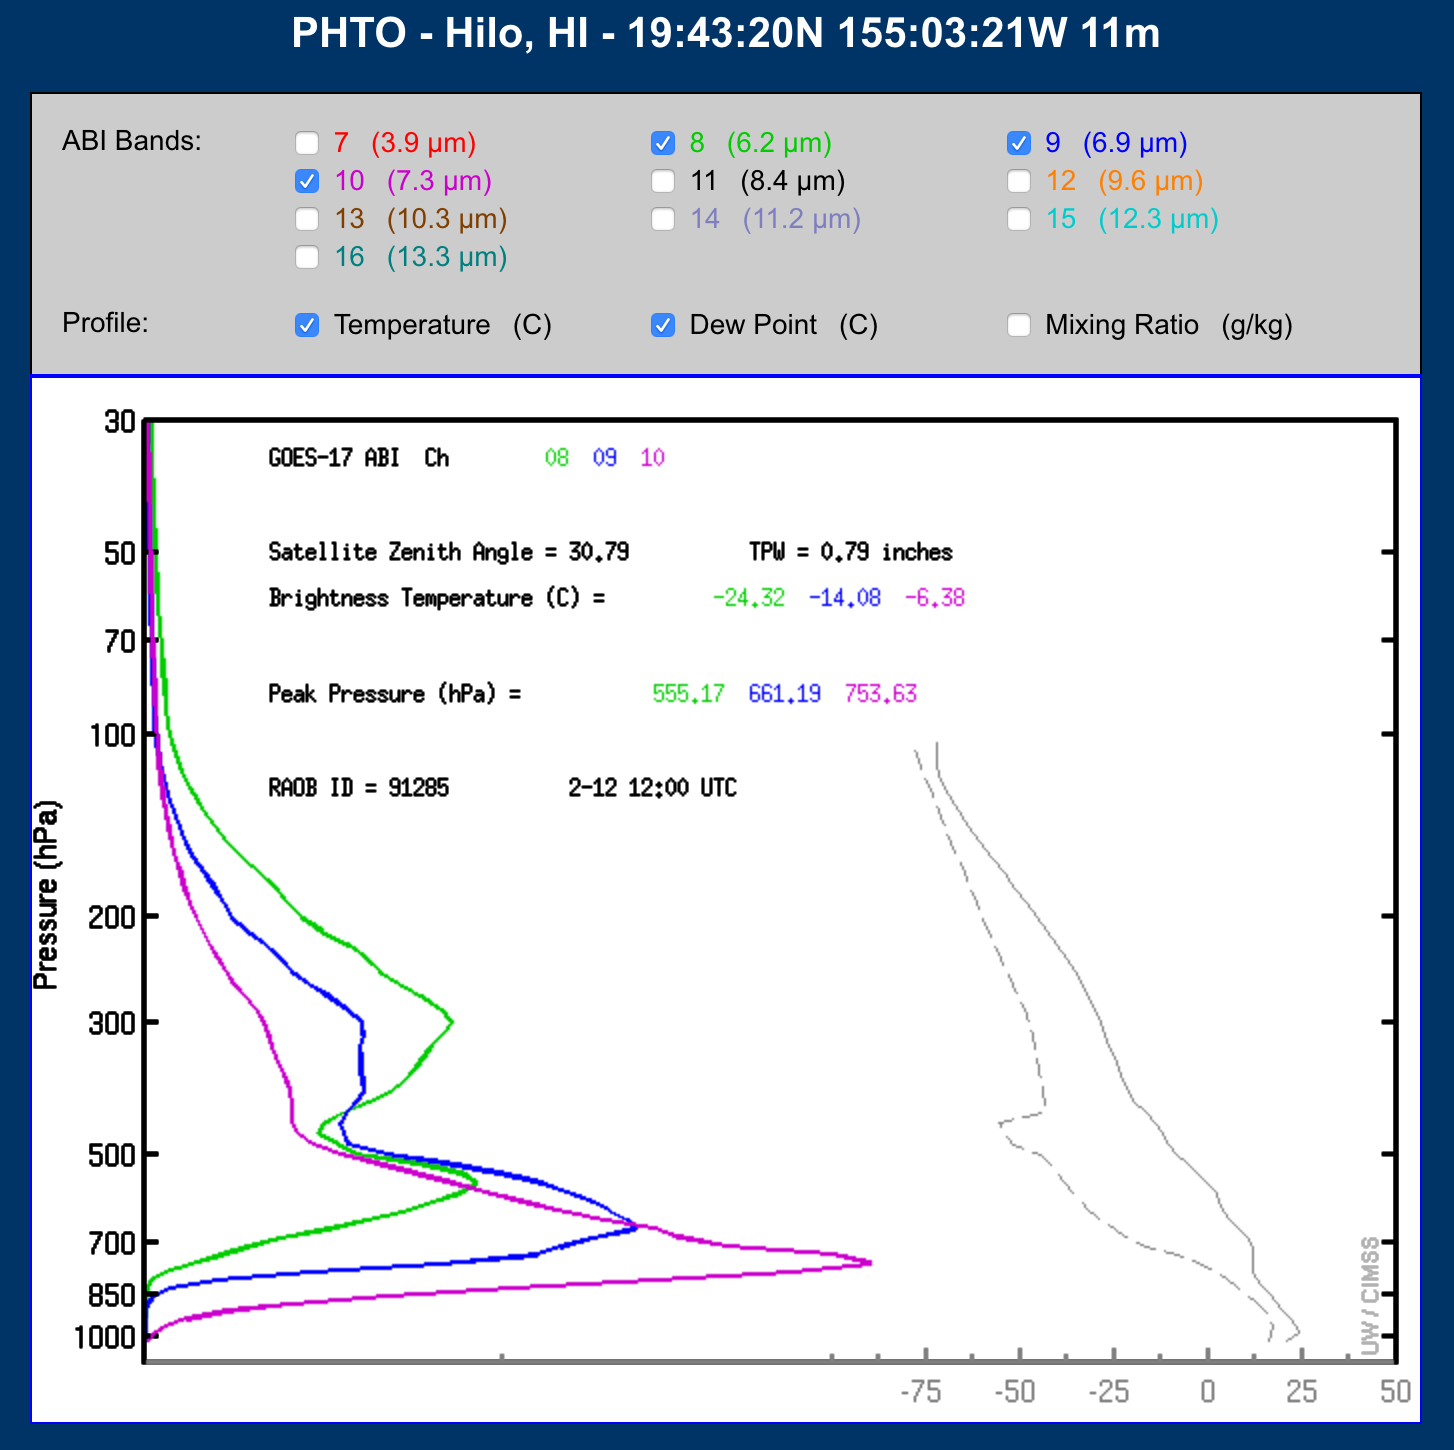
In an animation of GOES-17 images from the 16 ABI spectral bands, centered on the Big Island of Hawai’i (below), an increase in cumulus clouds was evident in the Visible and Near-Infrared bands (1-6) along with a warming signature of the island summits (Mauna Kea and Mauna Loa) in the Infrared bands (7-16) as daytime heating increased during the morning hours. Weighting functions for all of the Infrared bands which are not strongly affected by water vapor absorption (7, and 11-16) have peaks at/near the surface — and the presence of dry air within the middle troposphere shifted the three Water Vapor band (8-10) weighting functions downward to allow some of the island summit thermal signature to be sensed. This dry air aloft (and a lack of cirrus clouds over the island) also enabled the summits to be sensed by the 1.37 µm Near-Infrared “Cirrus” band (4).
![GOES-17 images from the 16 ABI spectral bands, centered on the Big Island of Hawai'i [click to play animation | MP4]](https://cimss.ssec.wisc.edu/satellite-blog/wp-content/uploads/sites/5/2019/02/190212_goes17_16spectralBands_HI_anim.gif)
GOES-17 images from the 16 ABI spectral bands, centered on the Big Island of Hawai’i [click to play animation | MP4]
![Image loop that cycles through all 16 ABI Bands from GOES-17, covering most of Alaska [click to play MP4 animation]](https://cimss.ssec.wisc.edu/satellite-blog/wp-content/uploads/sites/5/2019/02/ak_band02-20190212_221537.png)
Image loop that cycles through all 16 ABI Bands from GOES-17, covering most of Alaska [click to play MP4 animation]
![GOES-17 + GOES-16 Infrared (11.2 µm) images [click to play animation | MP4]](https://cimss.ssec.wisc.edu/satellite-blog/wp-content/uploads/sites/5/2019/02/190212_goes17_goes16_infrared_anim.gif)
GOES-17 + GOES-16 Longwave Infrared (11.2 µm) images [click to play animation | MP4]
![Sequence of GOES-17 Band 09 (6.9 µm Water Vapor) images during a spike in the Focal Plane Module temperature on 11 February 2019 [click to enlarge]](https://cimss.ssec.wisc.edu/satellite-blog/wp-content/uploads/sites/5/2019/02/190211_goes17_band9_fpm_anim.gif)
Sequence of GOES-17 Full Disk Band 09 (6.9 µm Water Vapor) images during a spike in the Focal Plane Module temperature on 11 February 2019 [click to enlarge]
![Sequence of GOES-17 CONUS sector Band 09 (6.9 µm Water Vapor) images during a spike in the Focal Plane Module temperature on 11 February 2019 [click to enlarge]](https://cimss.ssec.wisc.edu/satellite-blog/wp-content/uploads/sites/5/2019/02/190211_goes17_band9_fpm_conus_anim.gif)
Sequence of GOES-17 CONUS sector Band 9 (6.9 µm Water µm) images during a spike in the Focal Plane Module temperature on 11 February 2019 [click to enlarge]
Sequence of GOES-17 Full Disk Band 14 (11.2 µm Longwave Infrared) images during a spike in the Focal Plane Module temperature on 11 February 2019 [click to enlarge]