Blowing snow in southern Manitoba and the Red River Valley
GOES-16 “Red” Visible (0.64 µm, left) and Near-Infrared “Snow/Ice (1.61 µm, right) images, with hourly plots of surface wind and weather type [click to play animation | MP4]
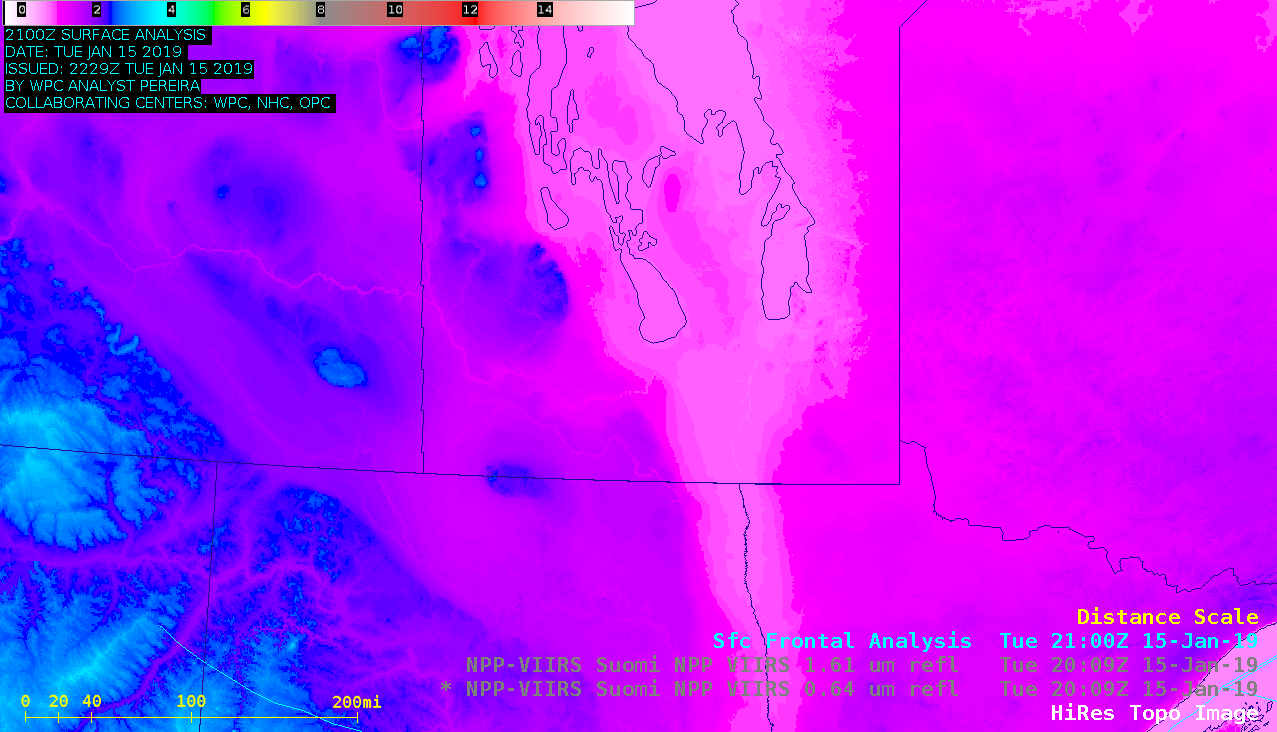
In a sequence of MODIS Visible (0.65 µm) and Snow/Ice (1.61 µm) images from Terra and Aqua in addition to VIIRS Visible (0.64 µm) and Snow/Ice (1.61 µm) from NOAA-20 and Suomi NPP (below), the plumes of blowing snow were also easier to detect in the Snow/Ice images (due to better contrast against the existing snow cover).
![MODIS Visible (0.65 µm) and Snow/Ice (1.61 µm) images from Terra and Aqua plus VIIRS Visible (0.64 µm) and Snow/Ice (1.61 µm) from NOAA-20 and Suomi NPP [click to enlarge]](https://cimss.ssec.wisc.edu/satellite-blog/wp-content/uploads/sites/5/2019/01/190115_modis_viirs_visible_snowIce_MB_ND_MN_blowing_snow_anim.gif)
MODIS Visible (0.65 µm) and Snow/Ice (1.61 µm) images from Terra and Aqua plus VIIRS Visible (0.64 µm) and Snow/Ice (1.61 µm) from NOAA-20 and Suomi NPP [click to enlarge]
![NOAA-20 and Suomi NPP VIIRS Snow/Ice (1.61 µm) images, with plots of surface observations [click to enlarge]](https://cimss.ssec.wisc.edu/satellite-blog/wp-content/uploads/sites/5/2019/01/190115_modis_viirs_visible_snowIce_MB_ND_MN_blowing_snow_zoom_observations_anim.gif)
NOAA-20 and Suomi NPP VIIRS Snow/Ice (1.61 µm) images, with plots of surface observations [click to enlarge]
![Aqua MODIS True Color image [click to enlarge]](http://eosweb.ssec.wisc.edu/browse_images/aqua/2019/015/2019-01-15_1923-1934_HWIN_010403_QKM.jpg)
Aqua MODIS True Color image [click to enlarge]
![Terra MODIS True Color and False Color RGB images [click to enlarge]](https://cimss.ssec.wisc.edu/satellite-blog/wp-content/uploads/sites/5/2019/01/190115_terra_modis_truecolor_falsecolor_anim.gif)
Terra MODIS True Color and False Color RGB images [click to enlarge]
![Aqua MODIS True Color and False Color RGB images [click to enlarge]](https://cimss.ssec.wisc.edu/satellite-blog/wp-content/uploads/sites/5/2019/01/190115_aqua_modis_truecolor_falsecolor_anim.gif)
Aqua MODIS True Color and False Color RGB images [click to enlarge]