Carr Fire pyrocumulonimbus in California
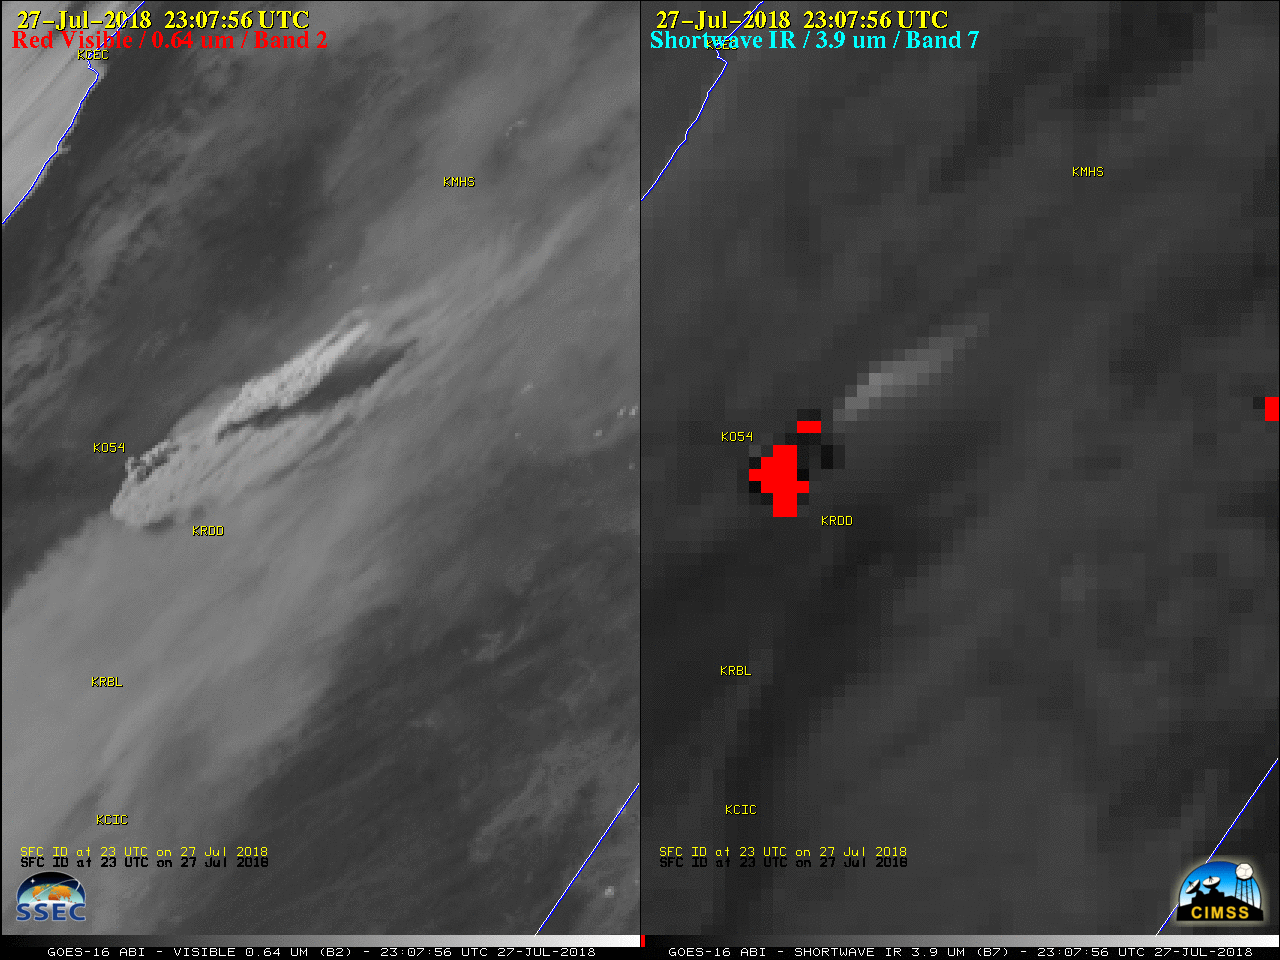
GOES-16 “Red” Visible (0.64 µm, left) and Shortwave Infrared (3.9 µm, right) images [click to play MP4 animation]
Another view using GOES-16 “Red” Visible, Shortwave Infrared, “Clean” Infrared Window (10.3 µm) and the Cloud Top Temperature product (below) showed the pyroCb cloud as it drifted rapidly northeast over Nevada and Oregon, along with a second (albeit smaller) pyroCb cloud which developed around 0130 UTC. One standard parameter used for defining a pyroCb cloud is a minimum cloud-top longwave infrared brightness temperature of -40ºC (ensuring complete glaciation) — and in this case with 1-minute imagery, the multi-spectral Cloud Top Temperature (CTT) product (FAQ) indicated that the pyroCb cloud reached the -40ºC threshold 19 minutes earlier than the 10.3 µm infrared imagery. From that point forward, the CTT product was consistently at least 5-10ºC colder than the 10.3 µm brightness temperature; the CTT product eventually displayed a minimum value of -53.9ºC over northeastern California. Even as the 10.3 µm brightness temperature began to rapidly warm after about 0100 UTC, the CTT product continued to display values in the -45 to -50ºC range (shades of green) which allowed for unambiguous tracking of the pyroCb.
![GOES-16 "Red" Visible (0.64 µm, top left), Shortwave Infrared (3.9 µm, top right), "Clean" Infrared Window (10.3 µm, bottom left) and Cloud Top Temperature product (bottom right) [click to play MP4 animation]](https://cimss.ssec.wisc.edu/satellite-blog/wp-content/uploads/sites/5/2018/07/Carr_Fire_CA-20180727_235756.png)
GOES-16 “Red” Visible (0.64 µm, top left), Shortwave Infrared (3.9 µm, top right), “Clean” Infrared Window (10.3 µm, bottom left) and Cloud Top Temperature product (bottom right) [click to play MP4 animation]
![Plot of 00 UTC rawinsonde data from Reno, Nevada [click to enlarge]](https://cimss.ssec.wisc.edu/satellite-blog/wp-content/uploads/sites/5/2018/07/180728_00UTC_KREV_RAOB.GIF)
Plot of 00 UTC rawinsonde data from Reno, Nevada [click to enlarge]