Tule fog in California
The red is where the fog is the thickest, with near zero visibility. Very dangerous driving conditions, only drive if necessary #TuleFog pic.twitter.com/yl9wORdJO6
— NWS Hanford (@NWSHanford) January 31, 2017
The tweet shown above was issued by the NWS forecast office in Hanford, California — using an image of the GOES-15 Low Instrument Flight Rules (LIFR) Probability, a component of the GOES-R Fog/low stratus suite of products — to illustrate where areas of dense Tule fog persisted into the morning hours on 31 January 2017.
AWIPS II images of the GOES-15 Marginal Visual Flight Rules (MVFR) product (below) showed the increase in areal coverage of Tule fog beginning at 0600 UTC (10 pm local time on 30 January); the fog eventually dissipated by 2030 UTC (12:30 pm local time) on 31 January. Note that Lemoore Naval Air Station (identifier KNLC) reported freezing fog at 14 UTC (their surface air temperature had dropped to 31º F that hour). In addition, some of the higher MVFR Probability values were seen farther to the north, along the Interstate 5 corridor between Stockton (KSCK) and Sacramento (KSAC) — numerous traffic accidents and school delays were attributed to the Tule fog on this day.
![GOES-15 MVFR Probability product [click to play animation]](https://cimss.ssec.wisc.edu/satellite-blog/wp-content/uploads/sites/5/2017/01/170131_goes15_mvfr_probability_CA_Tule_fog_anim.gif)
GOES-15 MVFR Probability product [click to play animation]
————————————————————————————–
![GOES-15 MVFR Probability and Aqua MODIS Infrared Brightness Temperature Difference (BTD) products [click to enlarge]](https://cimss.ssec.wisc.edu/satellite-blog/wp-content/uploads/sites/5/2017/01/170131_0900utc_goes15_mvfr_aqua_modis_btd_anim.gif)
GOES-15 MVFR Probability and Aqua MODIS Infrared Brightness Temperature Difference (BTD) products [click to enlarge]
![GOES-15 MVFR Probability and Suomi NPP VIIRS infrared Brightness Temperature Difference (BTD) products [click to enlarge]](https://cimss.ssec.wisc.edu/satellite-blog/wp-content/uploads/sites/5/2017/01/170131_1015utc_goes15_mvfr_suomi_npp_viirs_btd_anim.gif)
GOES-15 MVFR Probability and Suomi NPP VIIRS infrared Brightness Temperature Difference (BTD) products [click to enlarge]
![GOES-15 Visible (0.63 µm) images [click to play animation]](https://cimss.ssec.wisc.edu/satellite-blog/wp-content/uploads/sites/5/2017/01/170131_goes15_visible_Tule_fog_CA_anim.gif)
GOES-15 Visible (0.63 µm) images [click to play animation]
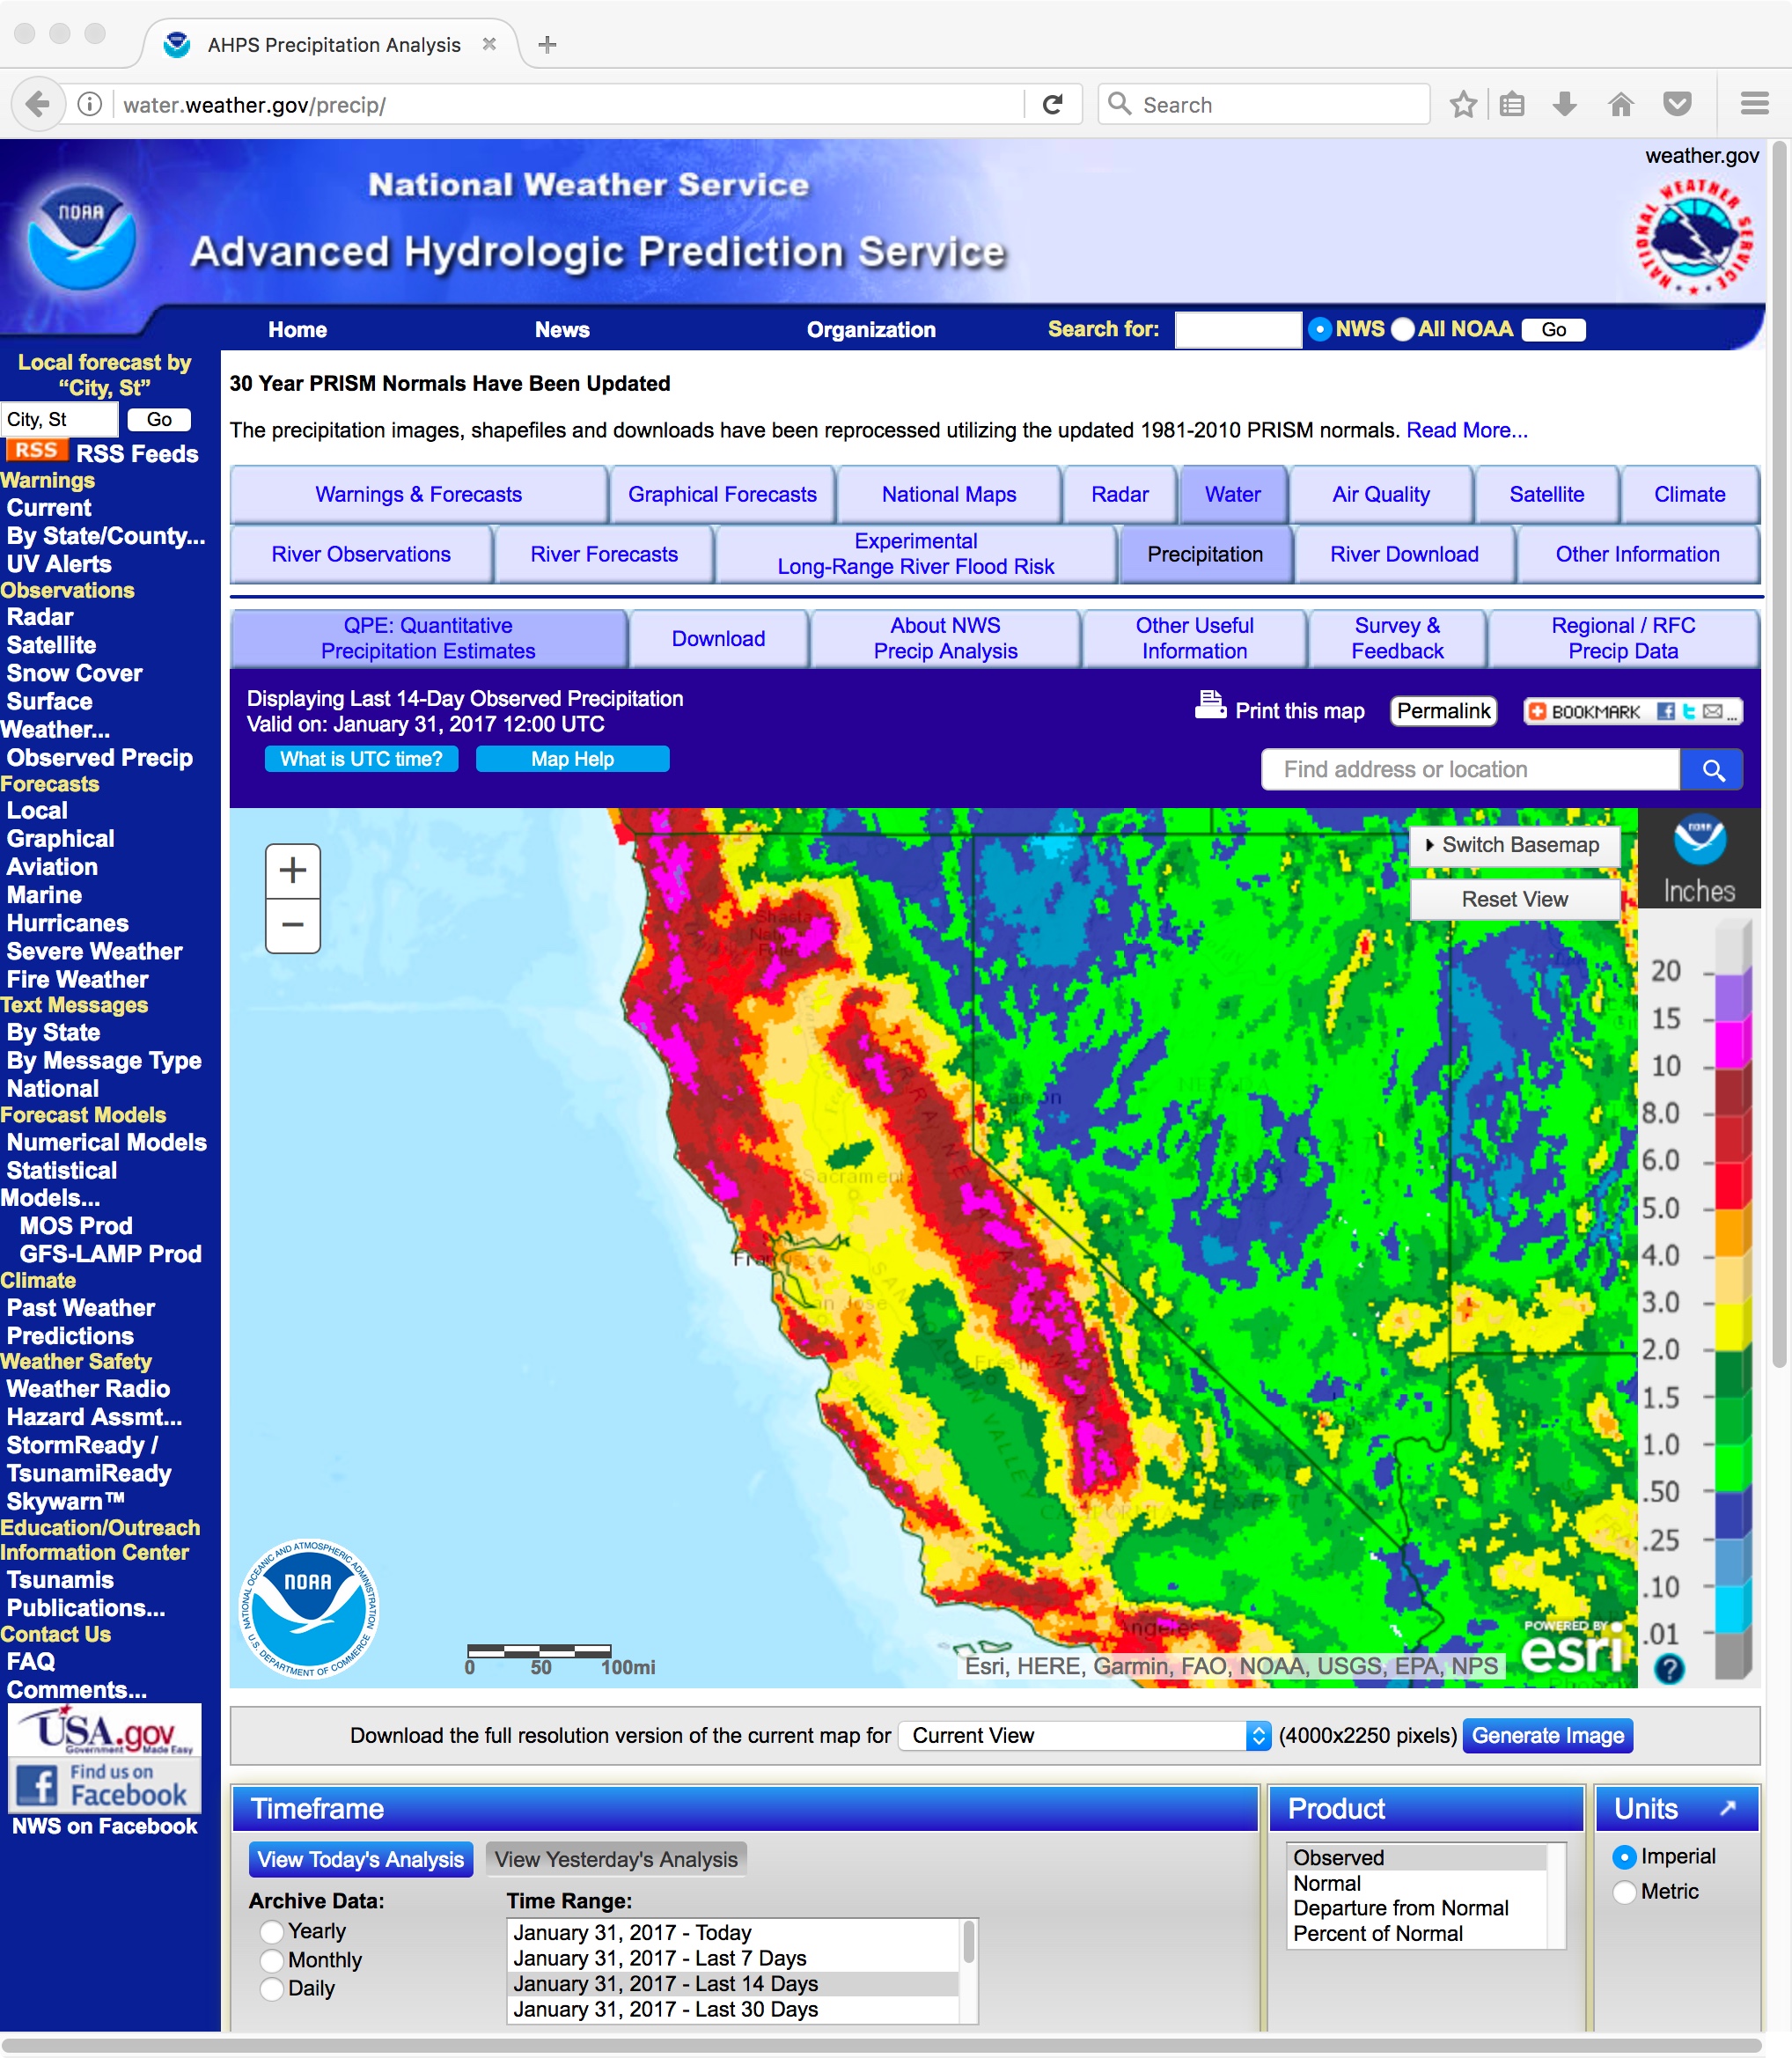
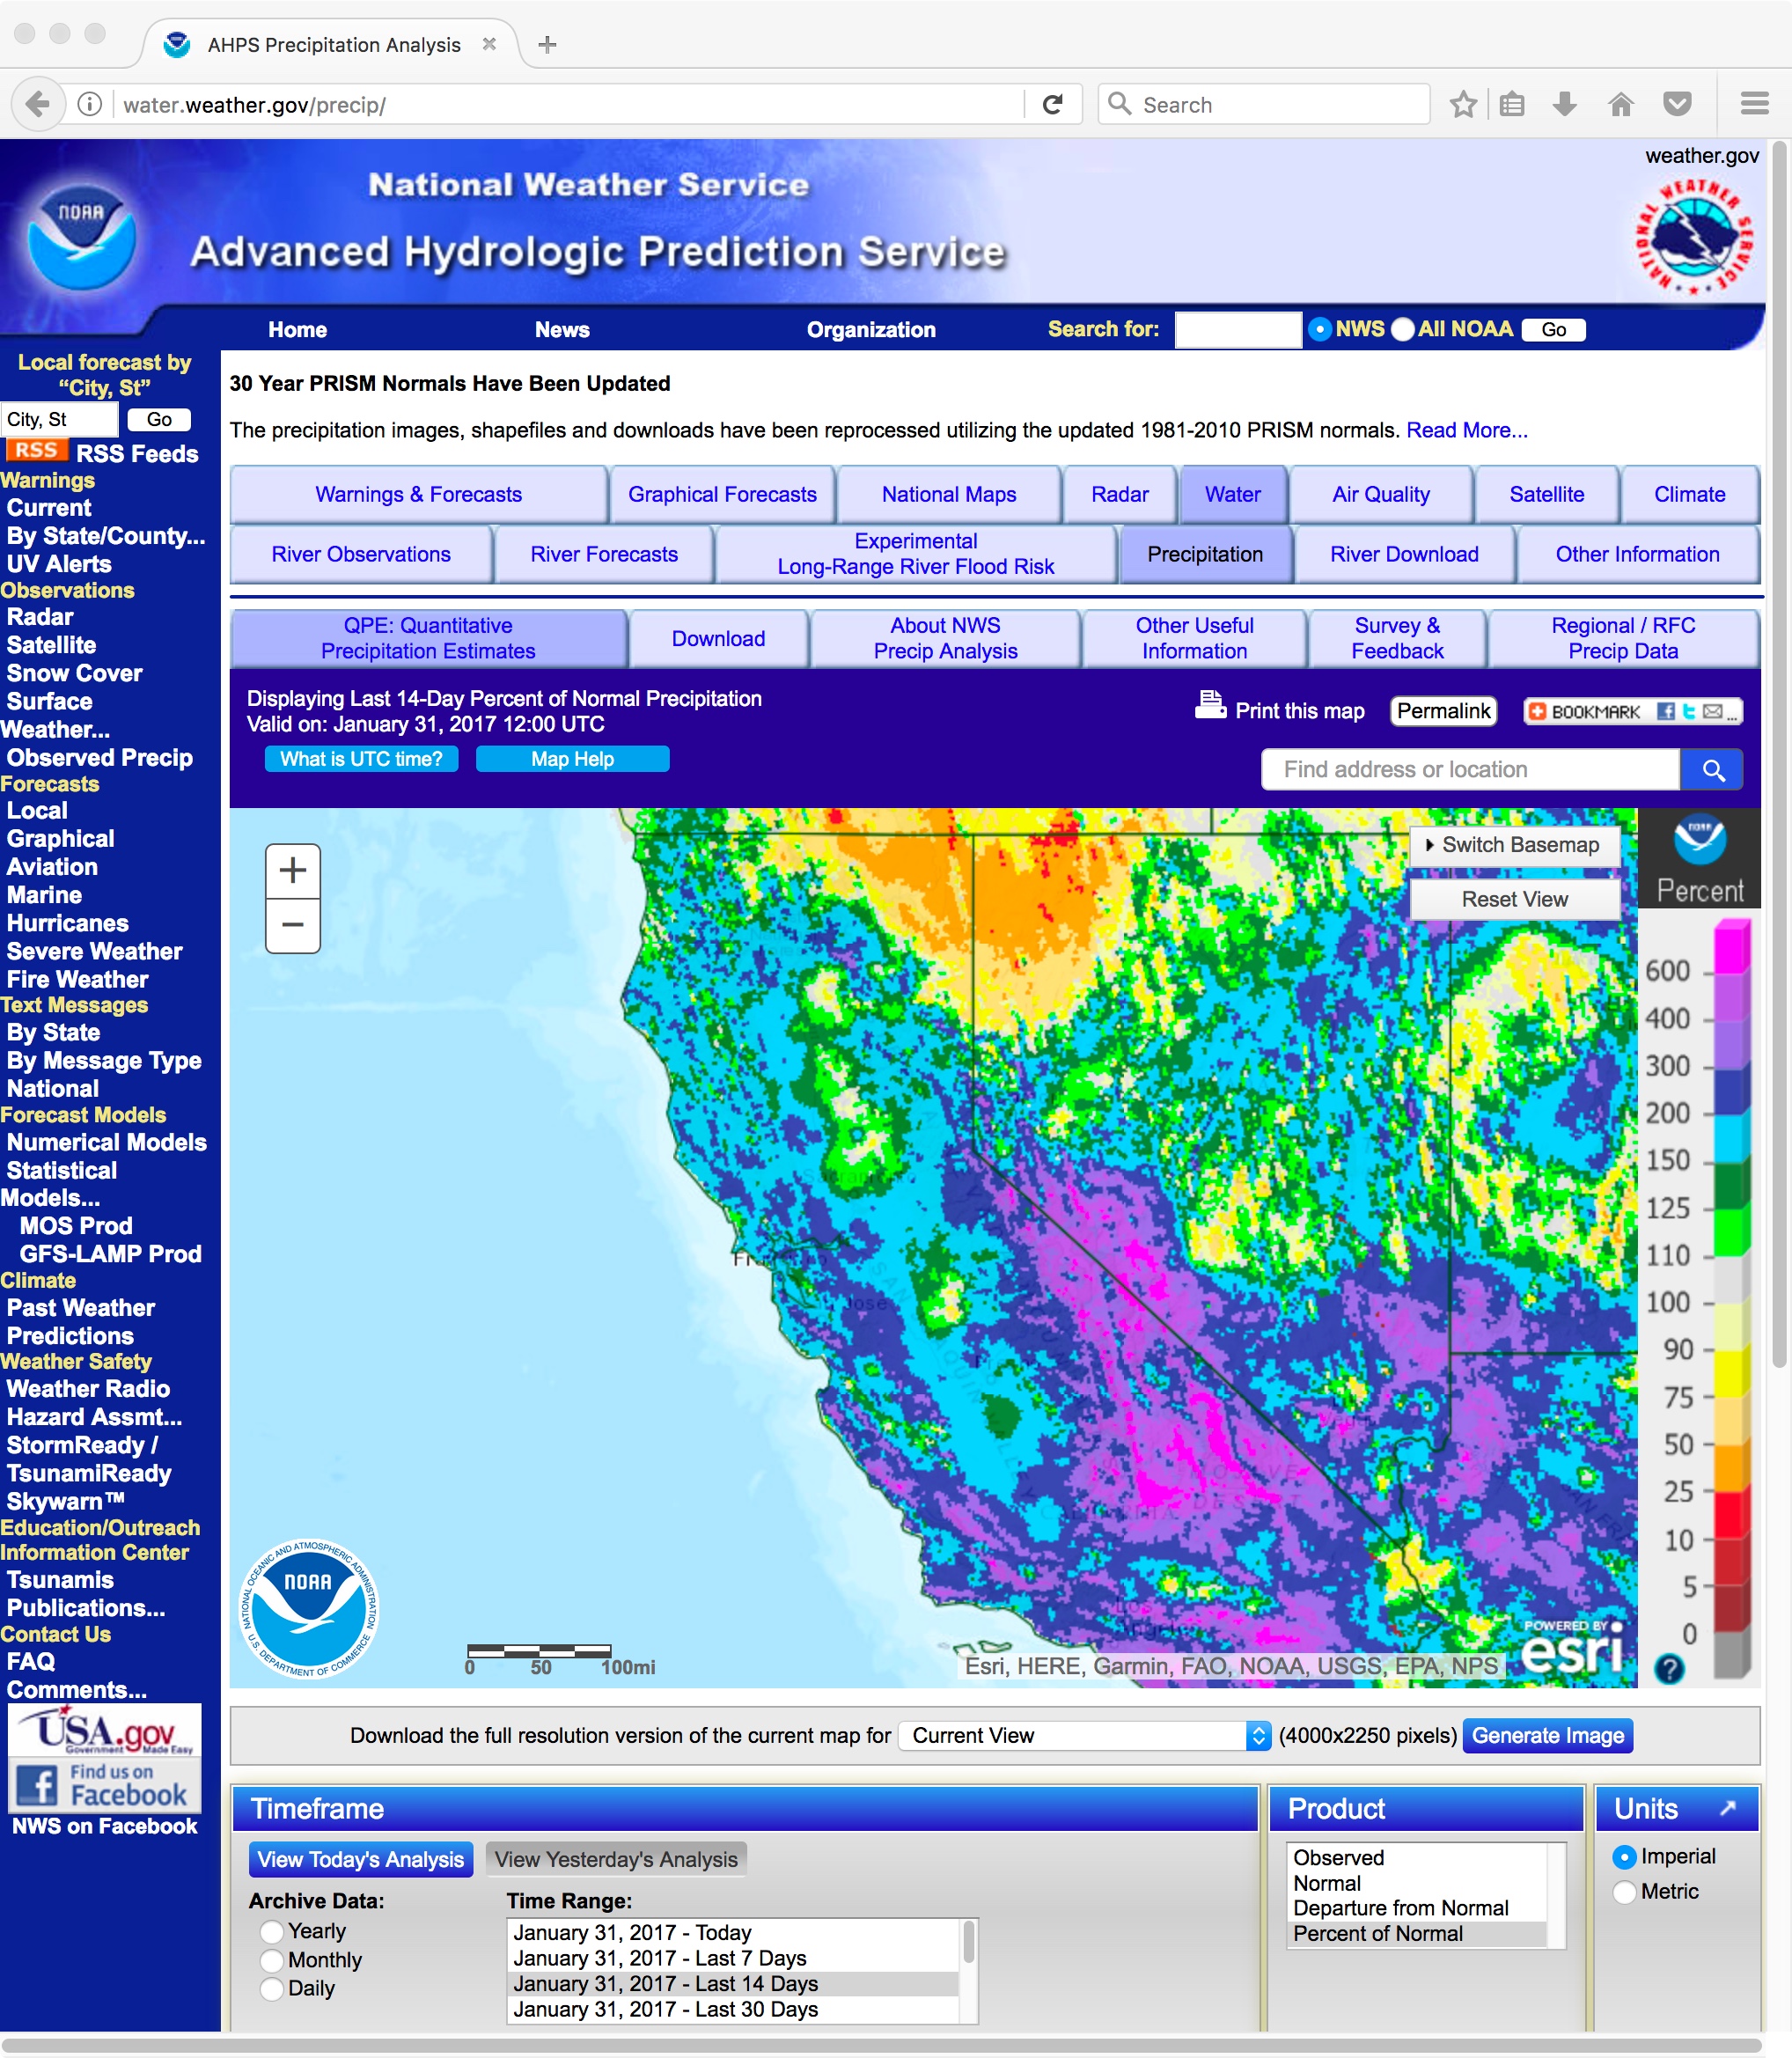
![Total liquid precipitation and Percent of normal precipitation for the 14-day period ending on 31 January 2017 [click to enlarge]](https://cimss.ssec.wisc.edu/satellite-blog/wp-content/uploads/sites/5/2017/01/170131_14day_Precip_Percent-of-normal_CA_anim.gif)
Total liquid precipitation and Percent of normal precipitation for the 14-day period ending on 31 January 2017 [click to enlarge]