When upper air soundings are missing: NUCAPS can help
Several recent notices have announced that radiosonde-carrying balloon launches to measure the temperature and moisture (and winds) in the atmosphere are suspended due to personnel shortages. There are products available to mitigate this data shortage. NOAA-Unique Combined Atmospheric Processing System (NUCAPS) profiles (training video here) use data from CrIS/ATMS (on NOAA-20/NOAA-21) and IASI/AMSU/MHS (on Metop-C) to create thermodynamic profiles.
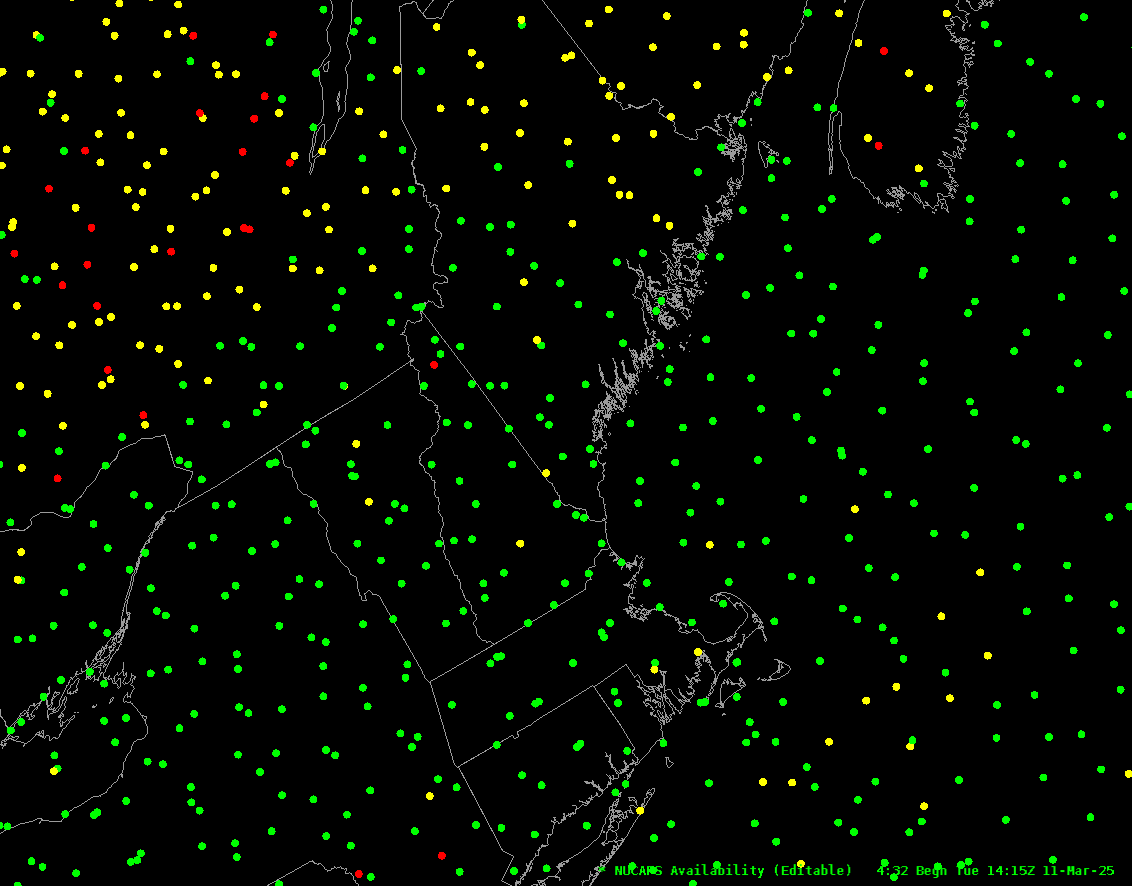
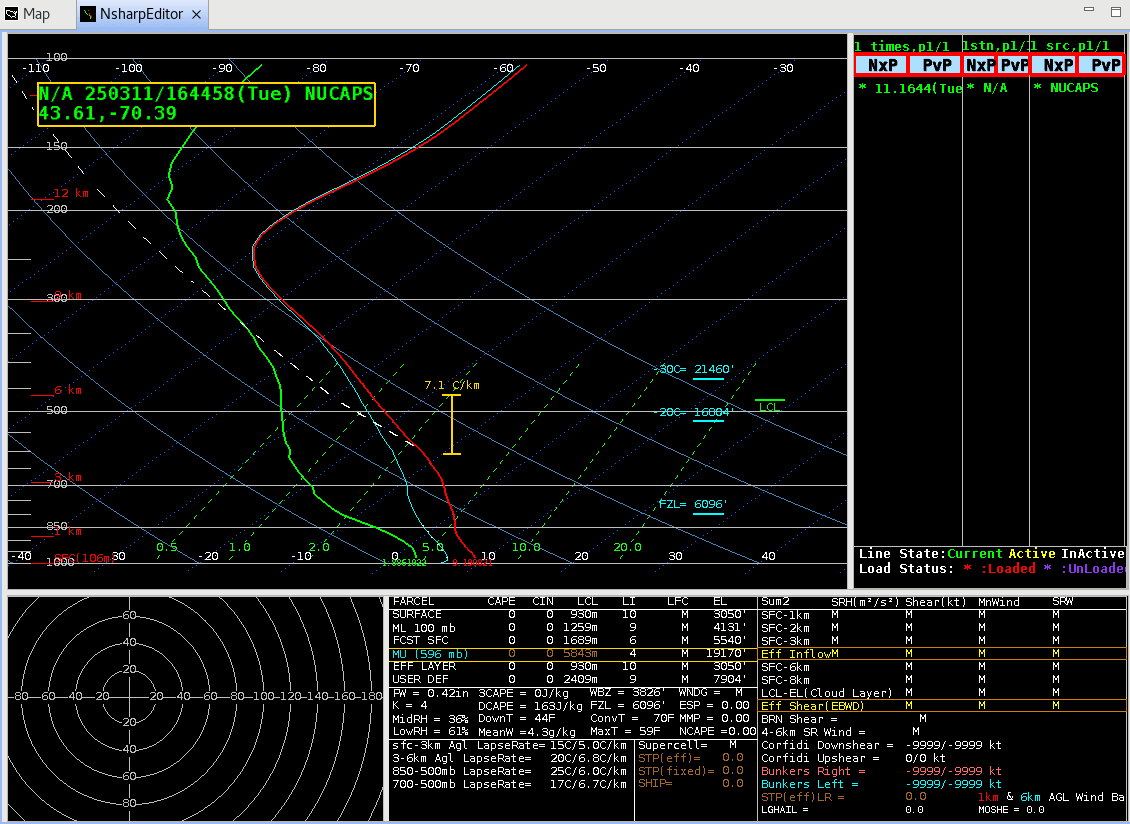
Where can these data be accessed? For National Weather Service WFOs, they are available in AWIPS under the ‘Satellite’ tab (and then ‘JPSS Polar’); then look at ‘NUCAPS Sounding Availability’, shown below, and ‘Gridded NUCAPS’. When NUCAPS Sounding Availability is on your screen, you can profiles by clicking on the points. For example, the Sounding Availability plot below shows two different profile locations in far southern coastal Maine; profiles at these two points are shown below as well. The low-level warming one might expect during the day is captured well.
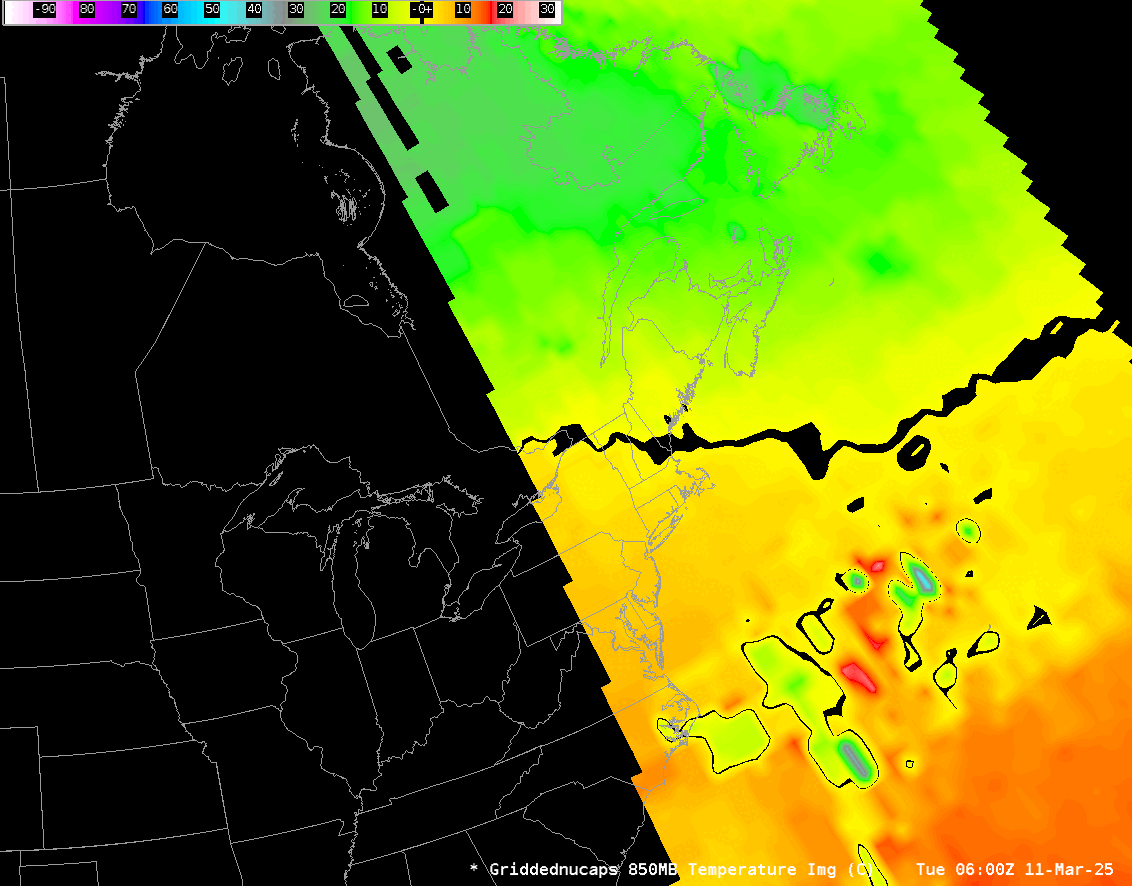
Gridded NUCAPS fields show values that have been interpolated to a pressure level on a grid. In the animation of 850-mb temperature plotted in AWIPS and shown below, showing a combination of MetopC, NOAA-20 and NOAA-21 fields, the 0oC isotherm is progressing northward through Maine in the 11 hours shown. The number of observations is far greater than the number of radiosondes that would have launched in this time.
Gridded NUCAPS fields are also available online. The images below show values over the Pacific Ocean (where radiosondes are routinely absent), and they show a stable and dry region arcing toward the Pacific Northwest from the tropics. Perhaps the cloudband in about the same location in the nightmicrophysics RGB (from the CSPPGeosphere site) is related to this NUCAPS-observed feature.

Use gridded NUCAPS when (that is, always!) you need supplemental observations of the troposphere.