One long Lake Effect Snow band in February
Very cold air over the Great Lakes on 17 February helped lead to the development of one long Lake-Effect Snow (LES) band that stretched from the Upper Peninsula of Michigan east-southeastward to Lake Huron then over the Bruce Peninsula and into eastern Lake Ontario and on to the Tug Hill Plateau over upstate New York. Surface observations show surface winds converging into the line: west-southwest winds over southwestern Ontario just south of the band and west-northwest winds just to the north of the band. In the RGB, the LES band clouds are orange/yellow in color. The cold snow-covered land surface is green, as are ice-covered regions on the Great Lakes (for example: Green Bay and the North Channel of Lake Huron). Low clouds (that probably aren’t supporting significant precipitation) are cyan or periwinkle in color.
Microwave sounder data (from, for example, ATMS on Suomi-NPP, NOAA-20 and NOAA-21 or AMSU-A/-B on NOAA-19) can be used to estimate snow fall rates, and this information is available online here. (Click here for a Quick Guide) Snowfall rates for this event are shown below. The LES snow band is obvious from Lake Superior east-southeastward into upstate New York, and strongest snowfall rates are just downwind of Lake Ontario. As the cold air sweeps from Canada southeastward across Lakes Superior, Huron and Ontario, it is warmed and moistened at the lowest levels (that is, it is destabilized) by the open waters of the Great Lakes. Once the band reaches the Tug Hill plateau, it has been prepped by the lakes upstream to unleash a torrent of snow.
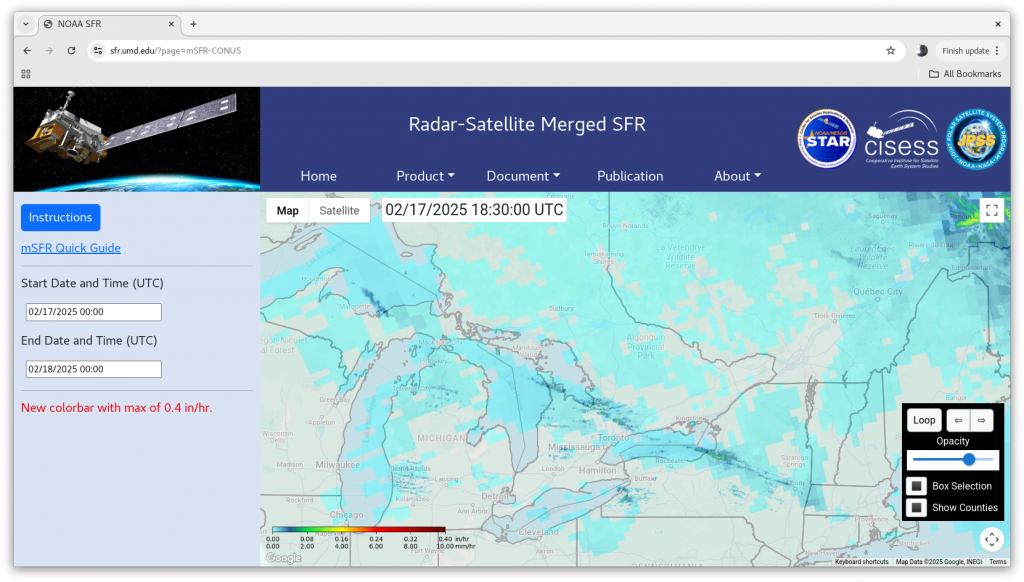
Merged snowfall rate, shown below, combines MRMS radar observations with satellite-based microwave estimates of snowfall rate. As you see, the radar observations show a considerably thinner snow band. Even though the microwave footprint has a larger horizontal scale than the LES snow band, the microwave signal is large enough to show where snow is falling. A user must combine the microwave estimate of snow fall rate with their knowledge of the size of the LES — based on infrared satellite imagery, or on surface observations — to use the microwave snowfall rate estimates most effectively.