Heavy rainfall across Hawai`i (along with a Severe Thunderstorm Warning and a Tornado Warning)

GOES-18 “Clean” Infrared Window (10.3 µm) images + Total Precipitable Water derived product, from 0000 UTC on 08 January to 0200 UTC on 10 January [click to play animated GIF | MP4]
10-minute Full Disk scan GOES-18 (GOES-West) “Clean” Infrared Window (10.3 µm) + Total Precipitable Water (TPW) images (above) showed the colder clouds associated with rain showers (with isolated embedded thunderstorms) and the clear-sky TPW field in the vicinity of Hawai`i during the 08-09 January 2024 time period. Surface analyses depicted a cold frontal boundary — which became more diffuse with time — that moved southeast across the island chain as a Storm Force Low intensified NW of Hawai`i.
A closer view using 5-minute PACUS Sector GOES-18 Infrared images (below) included 15-minute METAR plots — which showed periodic moderate to heavy rain; Local Storm Reports mentioned some flooding (and wind damage).

GOES-18 “Clean” Infrared Window (10.3 µm) images, from 0001 UTC on 08 January to 0101 UTC on 10 January [click to play animated GIF | MP4]
Of note was the issuance of a Tornado Warning at 0515 UTC on 09 January for the far western portion of Molokai island (below).
GOES-18 “Clean” Infrared Window (10.3 µm) images from 0506 UTC to 0526 UTC, with the Tornado Warning polygon plotted in red [click to play animated GIF | MP4]
In a comparison of GOES-18 10.3 µm infrared brightness temperature, CLAVR-x Cloud Top Temperature derived product and CLAVR-x Cloud Top Height derived product for a portion of the tornado-warned storm (below), the Cloud Top Temperature value was nearly 3C colder than the single-channel infrared brightness temperature, and the Cloud Top Height was around 30800 ft.
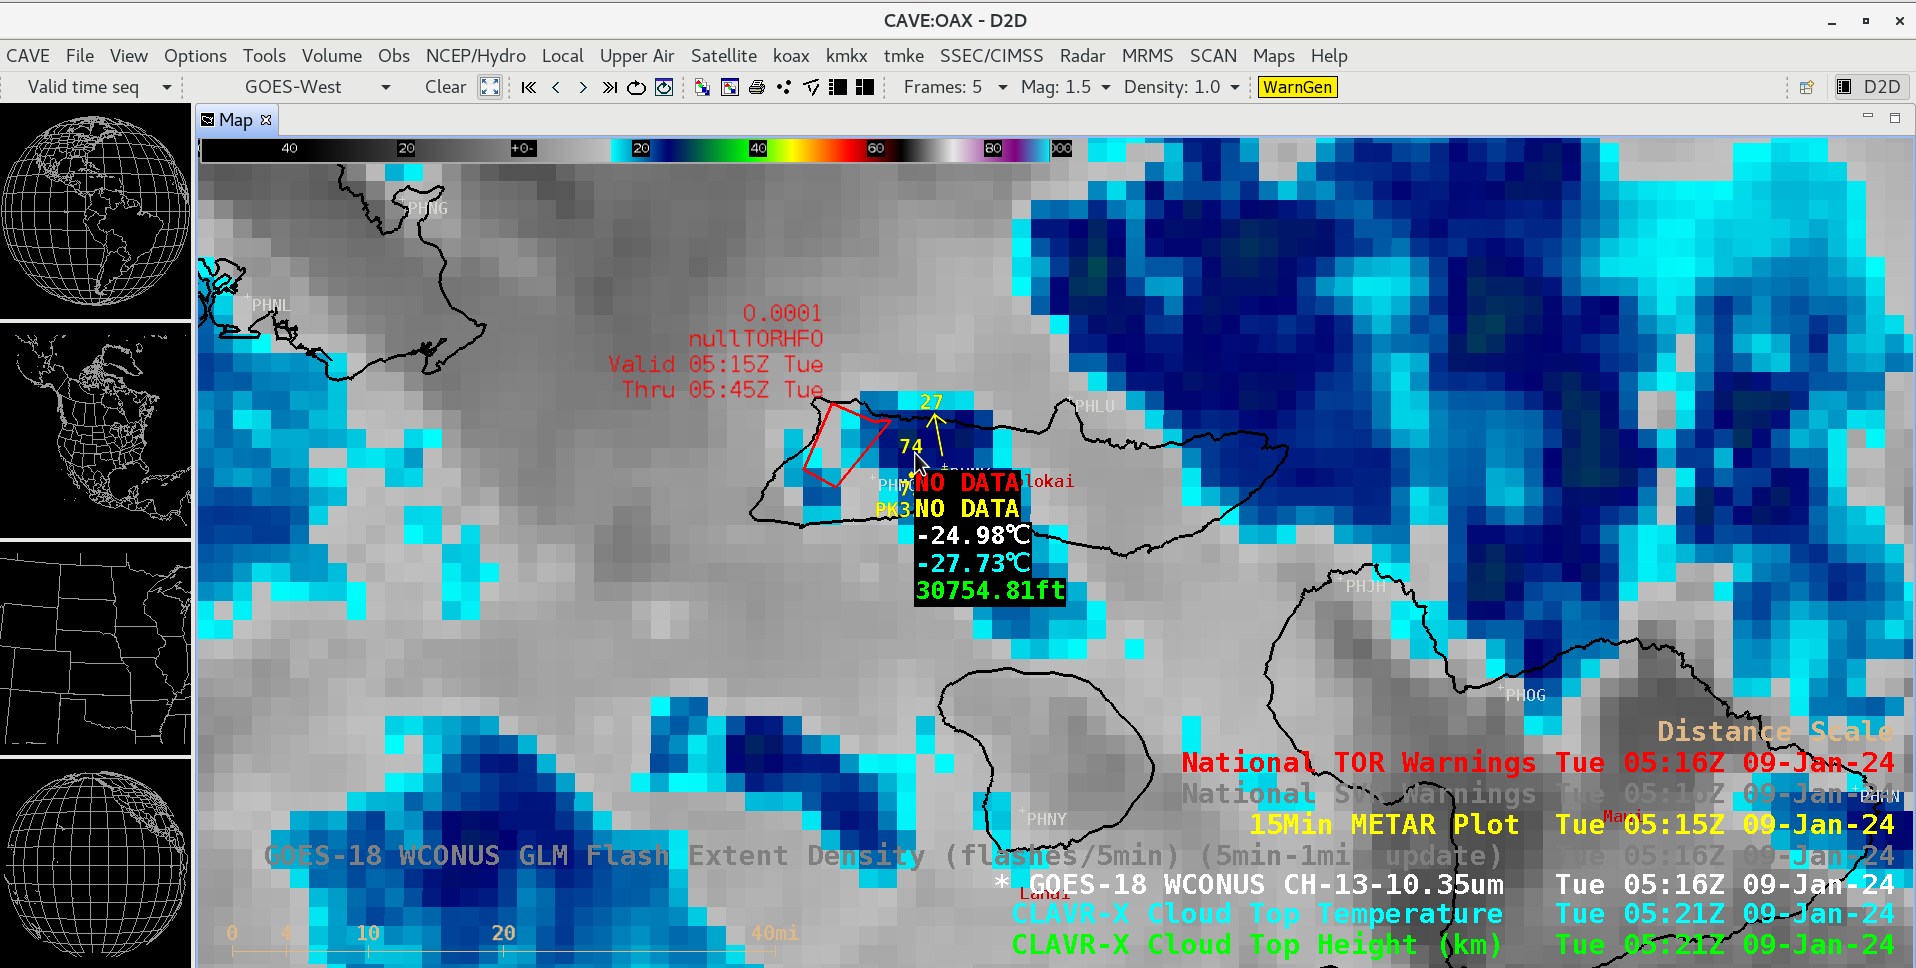
Cursor sample of the GOES-18 Infrared image at 0516 UTC (white) along with the CLAVR-x Cloud Top Temperature (cyan) and Cloud Top Height (green) at 0521 UTC [click to enlarge]
Later in the day, a Severe Thunderstorm Warning was issued at 2044 UTC for the far southern portion of Hawai`i (below).
GOES-18 “Clean” Infrared Window (10.3 µm) images from 2021 UTC to 2111 UTC, with the Severe Thunderstorm Warning polygon plotted in pale yellow [click to play animated GIF | MP4]
In a comparison of GOES-18 10.3 µm infrared brightness temperature, CLAVR-x Cloud Top Temperature derived product and CLAVR-x Cloud Top Height derived product for a portion of the severe-warned storm (below), the Cloud Top Temperature value was about 3.6C colder than the single-channel infrared brightness temperature, and the Cloud Top Height was around 29800 ft.
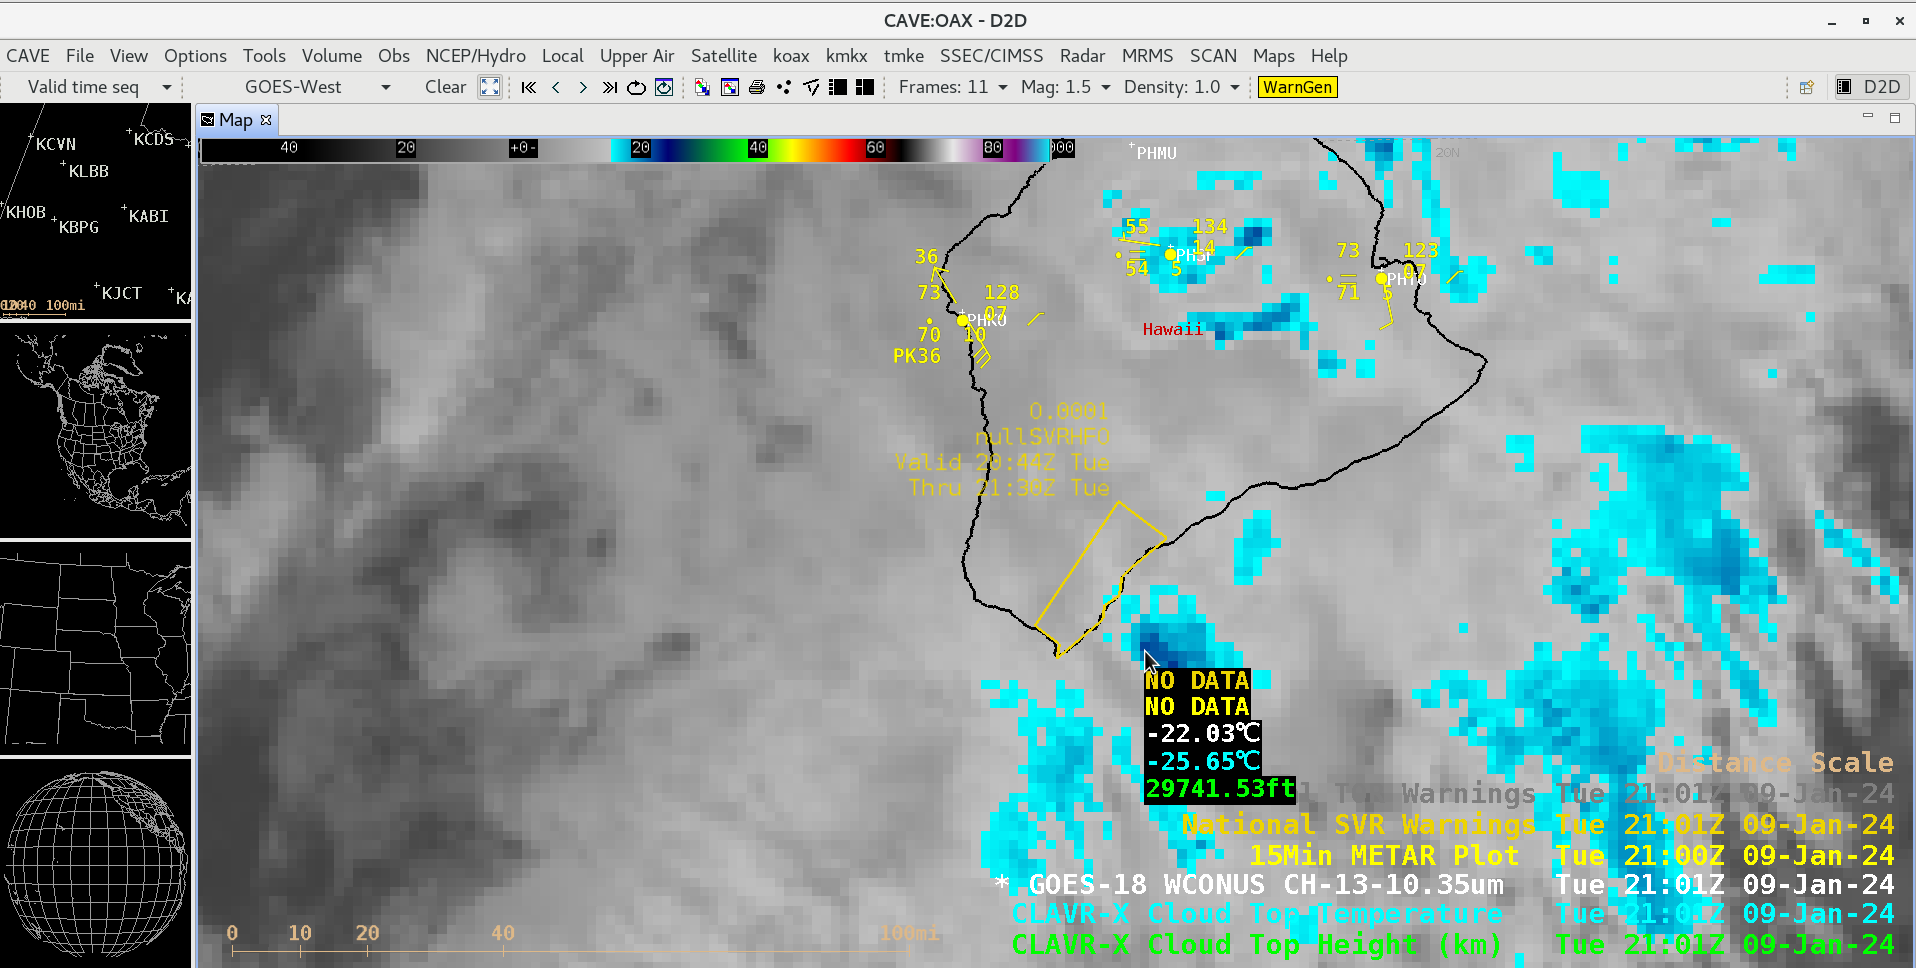
Cursor sample of the GOES-18 Infrared image (white) along with the CLAVR-x Cloud Top Temperature (cyan) and Cloud Top Height (green) at 2101 UTC [click to enlarge]
Microwave estimates of Rain Rate (derived using the MiRS algorithm within the CSPP software package) are available at this website. The animation below shows seven observations on 8 January 2024, from 07 UTC to 23 UTC. The axis of the heaviest rain was over Oahu starting at 1900 UTC on 8 January.