Heavy rainfall in Hawai’i
![GOES-17 “Red” Visible (0.64 µm) and “Clean” Infrared Window (10.35 µm) images [click to play animation | MP4]](https://cimss.ssec.wisc.edu/satellite-blog/images/2021/03/210308_goes17_visible_infrared_HI_anim.gif)
GOES-17 “Red” Visible (0.64 µm) and “Clean” Infrared Window (10.35 µm) images [click to play animation | MP4]
The coldest 10.35 µm infrared brightness temperatures were around -48ºC — for example, at 0000 UTC on 09 March (below).
![GOES-17 “Red” Visible (0.64 µm) and “Clean” Infrared Window (10.35 µm) images at 0000 UTC on 09 March [click to enlarge]](https://cimss.ssec.wisc.edu/satellite-blog/images/2021/03/210309_0000utc_goes17_visible_infrared_HI_anim.gif)
GOES-17 “Red” Visible (0.64 µm) and “Clean” Infrared Window (10.35 µm) images at 0000 UTC on 09 March [click to enlarge]
![GOES-17 “Red” Visible (0.64 µm) and “Clean” Infrared Window (10.35 µm) images [click to play animation | MP4]](https://cimss.ssec.wisc.edu/satellite-blog/images/2021/03/210308_goes17_visible_infrared_HI_zoom_anim.gif)
GOES-17 “Red” Visible (0.64 µm) and “Clean” Infrared Window (10.35 µm) images [click to play animation | MP4]
![Hydrograph for the Honopau Stream near Huelo [click to enlarge]](https://cimss.ssec.wisc.edu/satellite-blog/images/2021/03/210309_hpoh1_hydrograph.png)
Hydrograph for the Honopau Stream near Huelo [click to enlarge]
![Graph of West Wailuaiki rain gauge accumulation [click to enlarge]](https://cimss.ssec.wisc.edu/satellite-blog/images/2021/03/210308_210309_West_Waluaiki_Maui_rain_gauge.png)
Graph of West Wailuaiki rain gauge accumulation [click to enlarge]
![GOES-17 Water Vapor images, with plots of mid-upper level Derived Motion Winds [click to enlarge]](https://cimss.ssec.wisc.edu/satellite-blog/images/2021/03/210308_goes17_waterVapor_midUpperLevelWinds_EPacific_anim.gif)
GOES-17 Water Vapor images, with plots of mid-upper level Derived Motion Winds [click to enlarge]
![GOES-17 Water Vapor images, with contours of upper level divergence [click to enlarge]](https://cimss.ssec.wisc.edu/satellite-blog/images/2021/03/210308_goes17_waterVapor_upperLevelDivergence_EPacific_anim.gif)
GOES-17 Water Vapor images, with contours of upper level divergence [click to enlarge]
![MIMIC Total Precipitable Water product [click to play animation | MP4]](https://cimss.ssec.wisc.edu/satellite-blog/images/2021/03/210307_210308_mimicTPW_East_Pacific_anim.gif)
MIMIC Total Precipitable Water product [click to play animation | MP4]
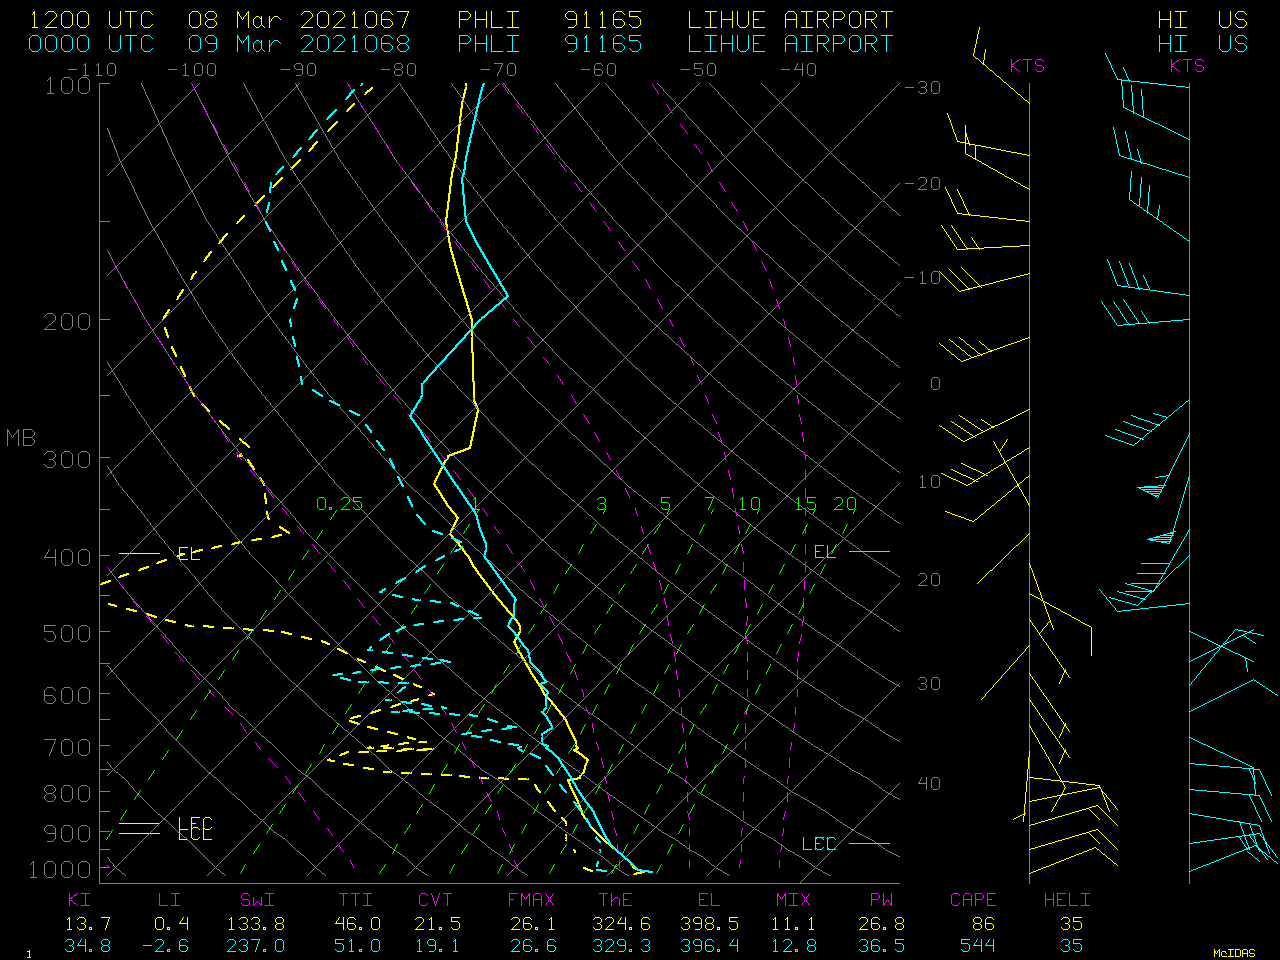
![Plots of rawinsonde data from Hilo, Hawai'i [click to enlarge]](https://cimss.ssec.wisc.edu/satellite-blog/images/2021/03/210308_PHTO_RAOBS.GIF)
Plots of rawinsonde data from Hilo, Hawai’i [click to enlarge]