Pier 45 Fire in San Francisco
![GOES-17 Shortwave Infrared (3.9 µm, top left), GOES-16 Shortwave Infrared (3.9 µm, top right), GOES-17 Near-Infrared "Snow/Ice" (1.61 µm, bottom left) and GOES-17 Near-Infrared "Cloud Particle Size" (2.24 µm, bottom right) [click to enlarge]](https://cimss.ssec.wisc.edu/satellite-blog/images/2020/05/200523_goes17_goes16_shortwaveInfrared_nearInfrared_SFO_fire_anim.gif)
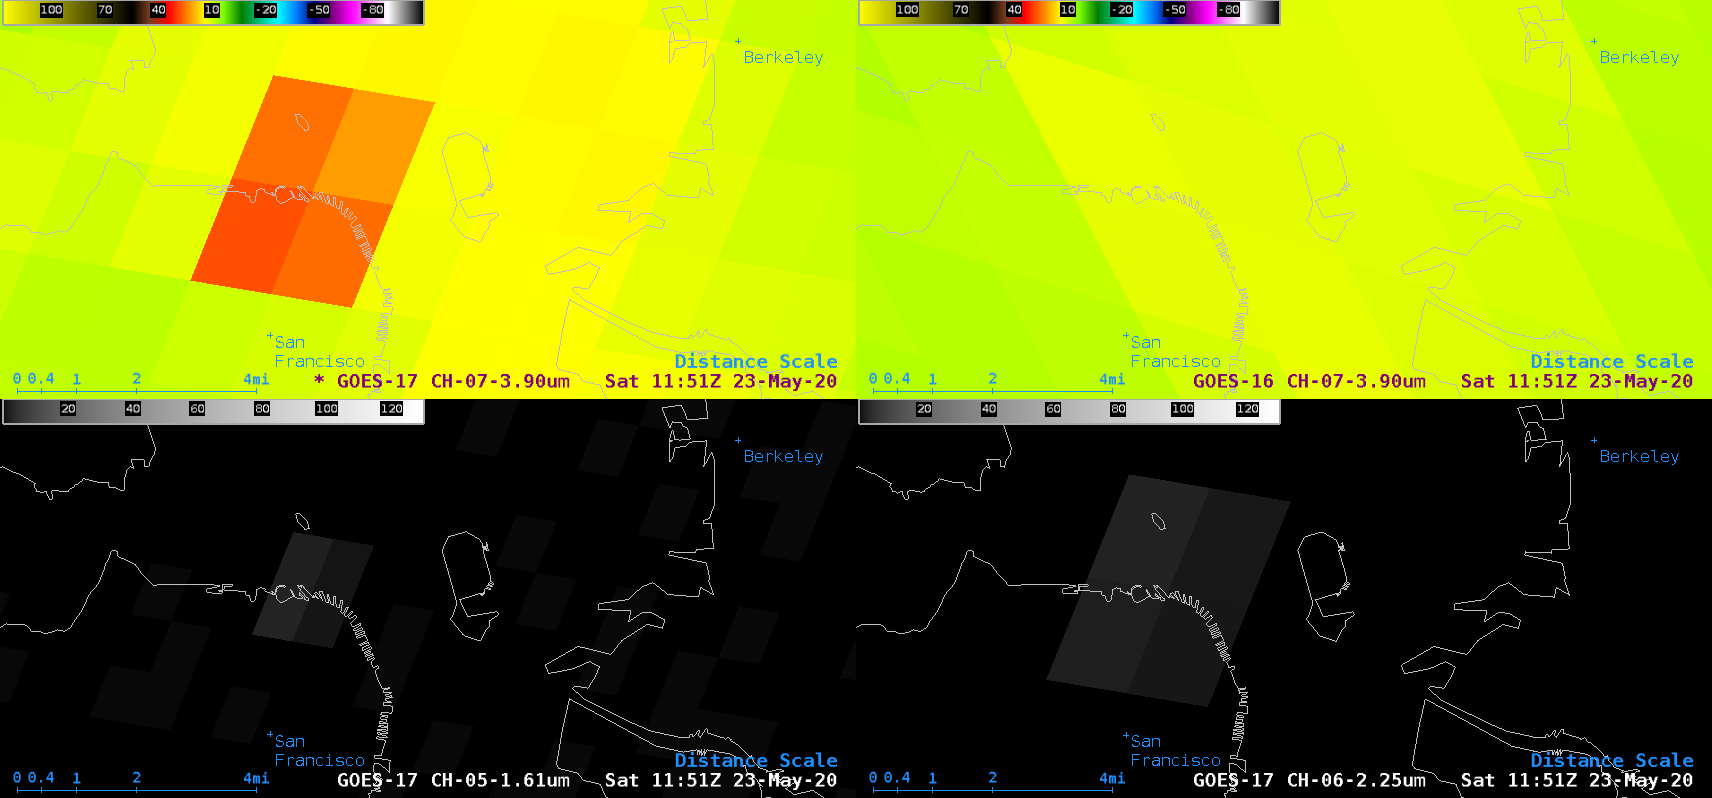
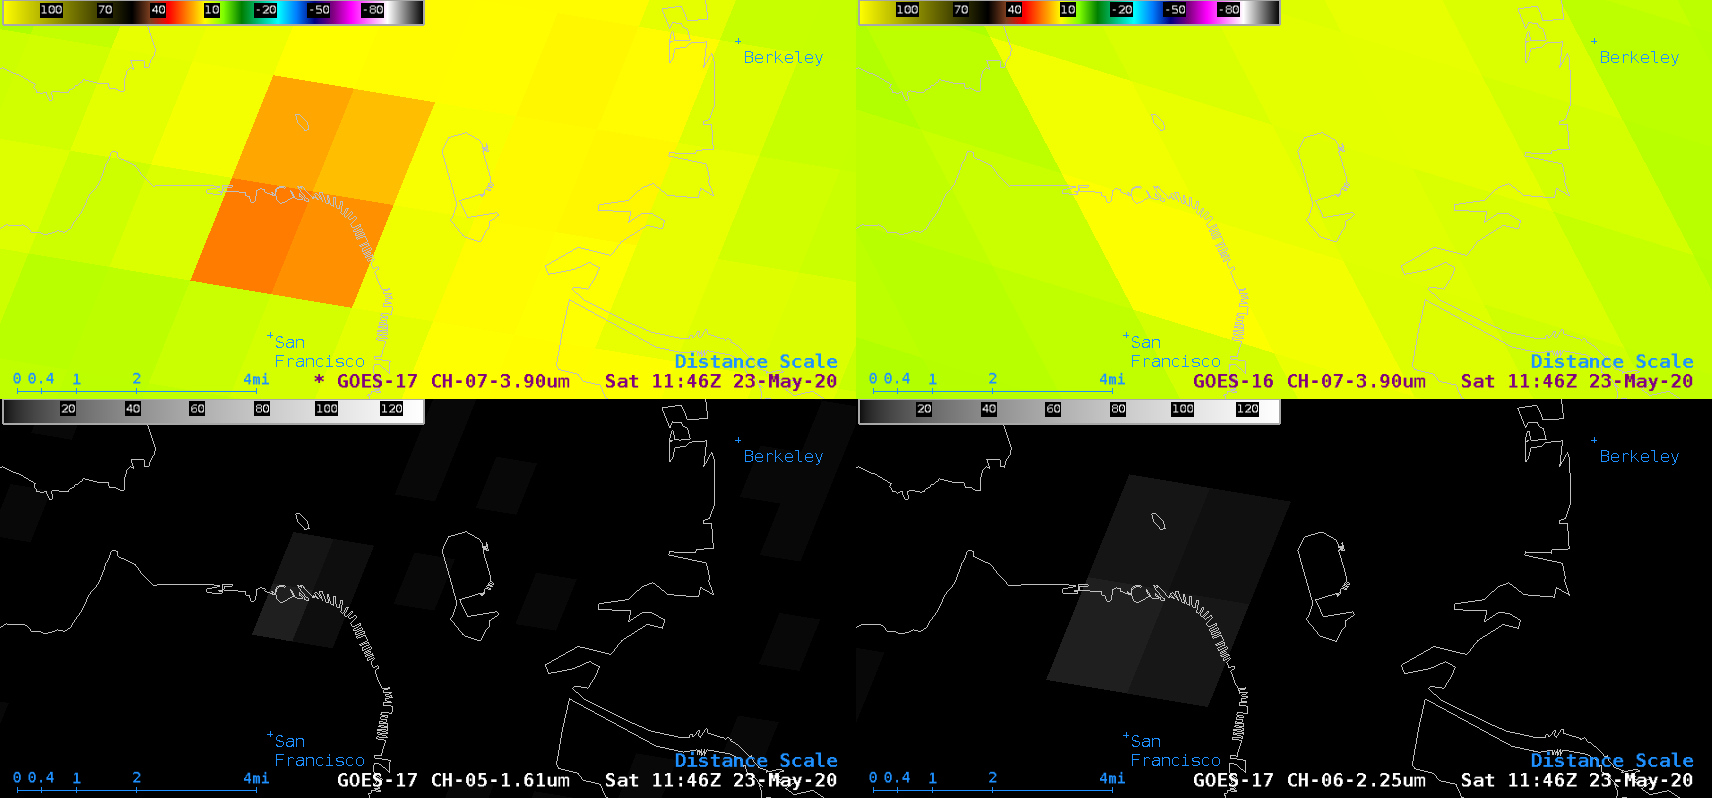
GOES-17 Shortwave Infrared (3.9 µm, top left), GOES-16 Shortwave Infrared (3.9 µm, top right), GOES-17 Near-Infrared “Snow/Ice” (1.61 µm, bottom left) and GOES-17 Near-Infrared “Cloud Particle Size” (2.24 µm, bottom right) [click to enlarge]
Note that a faint thermal signature of the fire (pixels exhibiting dim shades of white) was also apparent in GOES-17 Near-Infrared “Snow/Ice” (1.61 µm) and GOES-17 Near-Infrared “Cloud Particle Size” (2.24 µm) images. This is because those two ABI spectral bands are located close to the peak emitted radiance of very hot features such as volcanic eruptions or large fires (below).
![Plots of Spectral Response Functions for ABI Bands 5, 6 and 7 [click to enlarge]](https://cimss.ssec.wisc.edu/satellite-blog/wp-content/uploads/sites/5/2018/08/ABI_Band_5_6_7_Spectral_Response_Functions_Fires.png)
Plots of Spectral Response Functions for ABI Bands 5, 6 and 7 [click to enlarge]
Just after sunrise, the northward meandering of smoke could be seen in GOES-17 “Red” Visible (0.64 µm) images (below).
GOES-17 “Red” Visible (0.64 µm) images [click to enlarge]
![GOES-17 True Color RGB images [click to play animation | MP4]](https://cimss.ssec.wisc.edu/satellite-blog/images/2020/05/200523_goes17_trueColorRGB_SFO_fire_smoke_anim.gif)
GOES-17 True Color RGB images [click to play animation | MP4]
![Plot of 12 UTC rawinsonde data from Oakland, California [click to enlarge]](https://cimss.ssec.wisc.edu/satellite-blog/images/2020/05/200523_12UTC_KOAK_RAOB.GIF)
Plot of 12 UTC rawinsonde data from Oakland, California [click to enlarge]