Woolsey Fire in southern California
![GOES-16 “Red” Visible (0.64 µm, left) and Shortwave Infrared (3.9 µm, right) images [click to play MP4 animation]](https://cimss.ssec.wisc.edu/satellite-blog/wp-content/uploads/sites/5/2018/11/G16_VIS_SWIR_SOCAL_FIRES_09NOV2018_2018313_200125_GOES-16_0002PANELS.GIF)
GOES-16 “Red” Visible (0.64 µm, left) and Shortwave Infrared (3.9 µm, right) images [click to play MP4 animation]
A longer animation of GOES-16 Shortwave Infrared imagery (below) begins at 2115 UTC (1:15 PM local time) on 08 November — when a Mesoscale Sector was first positioned over California — and ends 52.5 hours later at 0149 UTC on 11 November (5:49 PM local time on 10 November). The first Ventura County fire to show a pronounced thermal signature was the Hill Fire; the earliest appearance of Woolsey Fire pixels that were hot enough to be color-enhanced (yellow) was at 2254 UTC (30 minutes after the reported start time of 2224 UTC). The area of hottest (red) pixels then began to increase in coverage and spread toward the southwest after about 06 UTC on 09 November (10 PM local time on 08 November), when Santa Ana winds began to increase at higher elevations several miles inland. As was seen in the Visible / Shortwave Infrared animation above, the morning period from 15-19 UTC (7-11 AM local time) on 09 November was when the fire moved very quickly toward the California coast and the beaches of Malibu. After sunset on 09 November, the area and intensity of hot red/yellow pixels began to decrease, and after 10 UTC (2 AM local time) on 10 November only darker black fire pixels persisted. During the day on 10 November, color-enhanced hot fire pixels were again evident from 1726-2353 UTC (9:26 AM to 3:53 PM local time). Note that at 19 UTC the marine layer began to move inland, with the dewpoint jumping to 46ºF at KNTO and to 33ºF at KCMA an hour later — the fire responded to this influx of moist air by beginning to die down.
![GOES-16 Shortwave Infrared (3.9 µm) images [click to play MP4 animation]](https://cimss.ssec.wisc.edu/satellite-blog/wp-content/uploads/sites/5/2018/11/G16_SWIR_SOCAL_FIRES_08_10NOV2018_2018313_190125_GOES-16_0001PANEL.GIF)
GOES-16 Shortwave Infrared (3.9 µm) images [click to play MP4 animation]
![Suomi NPP VIIRS Day/Night Band (0.7 µm) and Shortwave Infrared (3.74 µm) images at 0923 UTC [click to enlarge]](https://cimss.ssec.wisc.edu/satellite-blog/wp-content/uploads/sites/5/2018/11/181110_0923utc_suomiNPP_viirs_shortwaveInfrared_dayNightBand_Woolsey_Fire_CA_anim.gif)
Suomi NPP VIIRS Day/Night Band (0.7 µm) and Shortwave Infrared (3.74 µm) images at 0923 UTC [click to enlarge]
![MODIS and VIIRS Visible images [click to enlarge]](https://cimss.ssec.wisc.edu/satellite-blog/wp-content/uploads/sites/5/2018/11/181109_modis_viirs_visible_Woolsey_Fire_anim.gif)
MODIS and VIIRS Visible images [click to enlarge]
![Suomi NPP VIIRS True Color image at 2104 UTC [click to enlarge]](https://cimss.ssec.wisc.edu/satellite-blog/wp-content/uploads/sites/5/2018/11/181109_2104utc_suomiNPP_viirs_truecolor_SoCal_smoke.jpg)
Suomi NPP VIIRS True Color RGB image at 2104 UTC [click to enlarge]
![NOAA-20 VIIRS True Color image at 2154 UTC [click to enlarge]](https://cimss.ssec.wisc.edu/satellite-blog/wp-content/uploads/sites/5/2018/11/181109_2154utc_noaa20_viirs_truecolor_SoCal_smoke.jpg)
NOAA-20 VIIRS True Color RGB image at 2154 UTC [click to enlarge]
![Suomi NPP VIIRS True Color RGB and Aerosol Optical Depth [click to enlarge]](https://cimss.ssec.wisc.edu/satellite-blog/wp-content/uploads/sites/5/2018/11/181109_2104utc_suomiNPP_viirs_truecolor_aerosolOpticalDepth_anim.gif)
Suomi NPP VIIRS True Color RGB and Aerosol Optical Depth [click to enlarge]
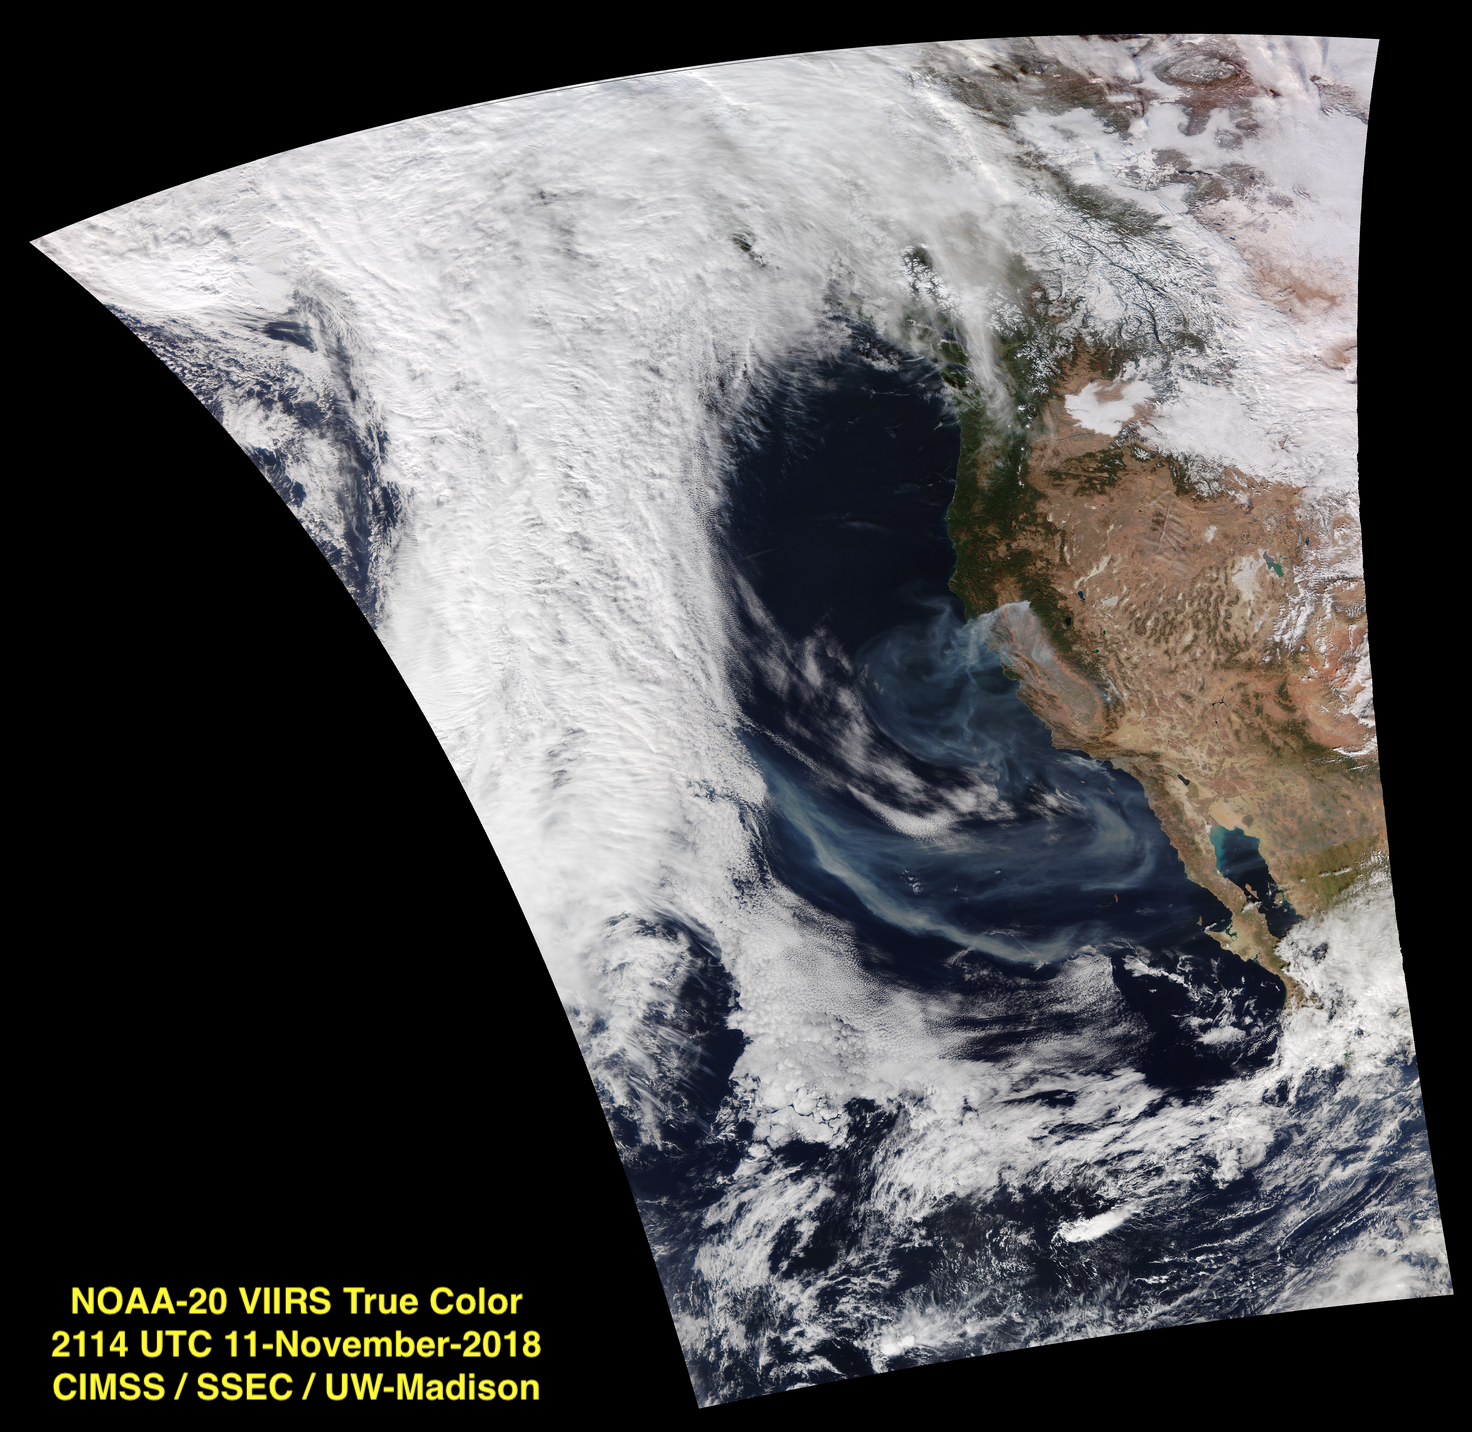
===== 11 November Update =====
GOES-16 “Red” Visible (0.64 µm, left) and Shortwave Infrared (3.9 µm, right) images [click to play MP4 animation]
The new smoke plumes (as well as residual smoke from previous days of burning) could be seen on VIIRS True Color RGB imagery from Suomi NPP at 2029 UTC and NOAA-20 at 2114 UTC (below). The entire image swaths as captured and processed by the Direct Broadcast ground station at CIMSS/SSEC can be seen here and here.
![Suomi NPP VIIRS True Color RGB image at 2029 UTC [click to enlarge]](https://cimss.ssec.wisc.edu/satellite-blog/wp-content/uploads/sites/5/2018/11/181111_2029utc_suomiNPP_viirs_truecolor_SoCal.jpg)
Suomi NPP VIIRS True Color RGB image at 2029 UTC [click to enlarge]
![NOAA-20 VIIRS True Color RGB image at 2114 UTC [click to enlarge]](https://cimss.ssec.wisc.edu/satellite-blog/wp-content/uploads/sites/5/2018/11/181111_2114utc_noaa20_viirs_truecolor_SoCal.jpg)
NOAA-20 VIIRS True Color RGB image at 2114 UTC [click to enlarge]