Himawari-8 true-color imagery
Himawari-8 true-color images (click to play YouTube animation)
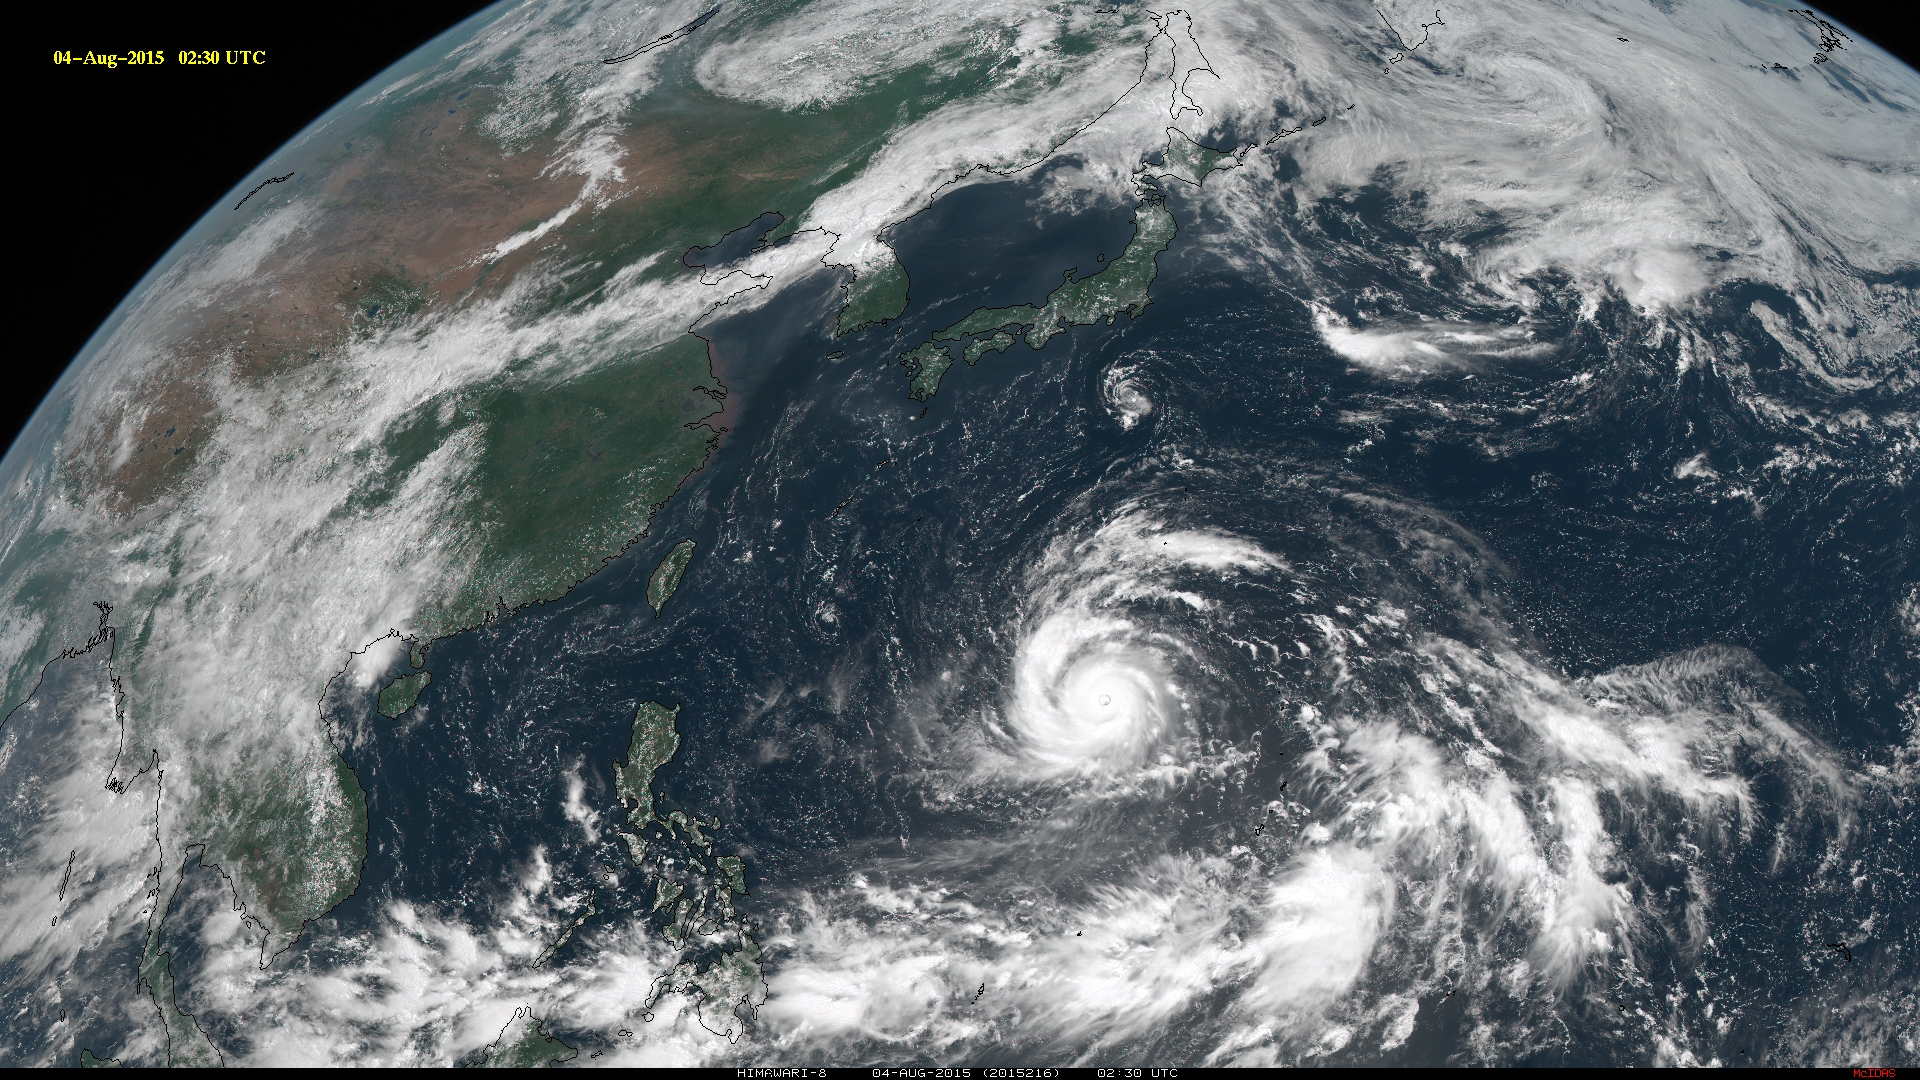
A sequence of 10-minute interval Himawari-8 true-color Red/Green/Blue (RGB) images covering the period 01 August to 06 August 2015 is shown above (also available as a very large 721 MByte animated GIF, a 66 Mbyte MP4 movie file, or an alternate version here on YouTube). One of the most prominent features seen is Typhoon Soudelor in the West Pacific Ocean, which reached Category 5 Super Typhoon intensity late in the day on 03 August, as indicated in a plot of the Advanced Dvorak Technique intensity estimate from the CIMSS Tropical Cyclones site (below).

Advanced Dvorak Technique (ADT) intensity estimation plot for Super Typhoon Soudelor (click to enlarge)
Other features of interest seen during this 6-day animation include hazy-white plumes of urban pollution and/or wildfire smoke streaming eastward off the Asian continent, as well as light brown or tan-colored plumes of blowing dust/sand originating from the interior desert regions.
The Himawari-8 AHI data are provided by the JMA, acquired by NOAA/NESDIS/STAR, and processed at SSEC/CIMSS. The true-color images use information from AHI bands 1, 2, and 3, combined with a customized contrast stretch algorithm. No background image was used.