
Resolution
The resolution of an image refers to the potential detail provided by the imagery. In remote sensing we refer to three types of resolution: spatial, spectral and temporal.
Spatial Resolution refers to the size of the smallest feature that can be detected by a satellite sensor or displayed in a satellite image. It is usually presented as a single value representing
the length of one side of a square. For example, a spatial resolution
of 250m means that one pixel represents an area 250
by 250 meters on the ground.
Spectral Resolution refers to
the ability of a satellite sensor to measure specific wavlengths of the electromagnetic spectrum. The finer the spectral resolution, the narrower
the wavelength range for a particular channel or band.
Temporal resolution refers to the time between images. The capability for satellites to provide images of the same geographical area more frequently has increased dramatically since the dawn of the space age.
Contouring
Meteorologists, oceanographers and geologist all use contour analysis to visually explain the information that images and data is providing. Contouring data is an elementary step in spatial analysis. The ability to correctly and confidently analyze data is critical to interpreting conditions. Contouring is vital for finding the location of atmospheric and oceanic fronts,
locating potential regions of severe thunderstorms, tracking hurricanes, tracking the movement of pollutants and tracing water movement in the oceans.
|
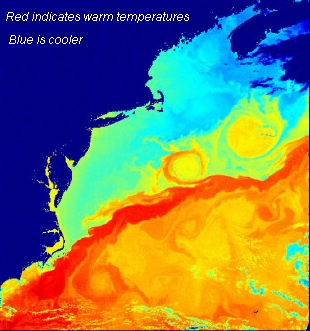
Color-Coding and Color Enhancements |
 click to enlarge |
|
 click to enlarge |
Overlaying Data |
Spatial Analysis and Geographic Information Systems (GIS) |