Satellite Winds
The use of successive satellite images to determine wind direction and speed was pioneered by Professor Suomi at the University of Wisconsin-Madison. While the concept is simple, the procedure is complex and it took several decades before satellite derived winds were accurate enough to be incorporated into weather forecasts. The effort paid off however and weather forecasts have improved significantly, especially hurricane landfall predictions. This is due in part to increased coverage provided by satellite wind technology. To see what we mean, compare the wind coverage traditional weather balloons provide (in yellow) with the coverage provided by satellite derived winds (multiple colors) from geostationary satellites by moving the slider back and forth over the water vapor images below.
This illustrates wind data avialable from a single level in the atmosphere, imagine how useful this information is to pilots and air traffic controllers navigating flights safely through different altitudes.
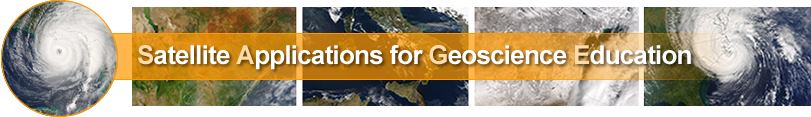
Turbulence Turbulence is a significant hazard to aviation. The threat is compounded in cloud free areas due to the lack of visual clues provided by condensation. Mountain waves, a common cause of turbulence, are rarley discernible on visible satellite images. Fortunately the water vapor channel can detect and display clear air turbulence, as can be seen in this image. The typical "herringbone" signature often occurs in cloud free clear air, making the water vapor channel the only tool for accurate turbulence detection in those cases. |
 |
Volcanic Ash
|
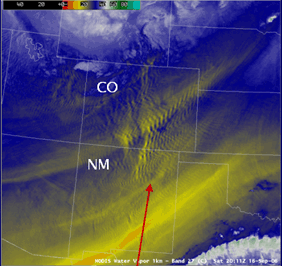
Satellites are often the only way to collect data from remote areas where volcanoes erupt. And while the volcanoes themselves may be remote, the ash clouds can affect air travel around the globe. For example, smoke, ash, and aerosols released by the Eyjafjallajökull glacial volcano in April 2010 caused thousands of commercial airline cancellations. Before flights could recommence, forecasters analyzed data from satellites in geostationary orbit to help determine the presence, altitude and density of ash from the volcano, as well as the size of the ash particles in the cloud. Using computer algorithms, researchers are working to develop automated global ash monitoring system enabled by satellite data. |
|
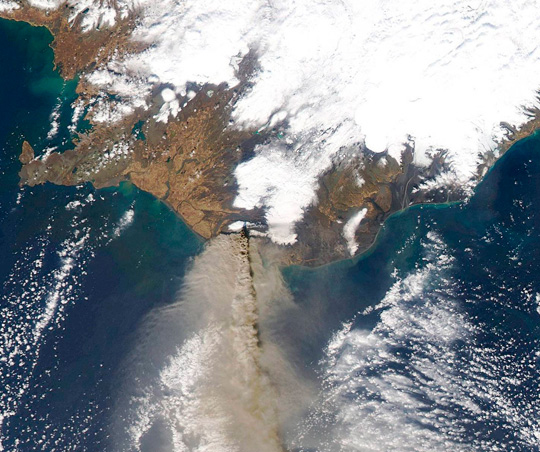
These images show the ash cloud over Germany, the Czech Republic, and Poland on 16 April 2010. A false color image is shown in the upper left panel, the ash mass loading in the upper right panel, the ash cloud height in the lower left panel, and the ash cloud effective particle radius in the lower right panel. The outline of the ash clouds detected by the automated algorithm is contoured in white on the false color images.