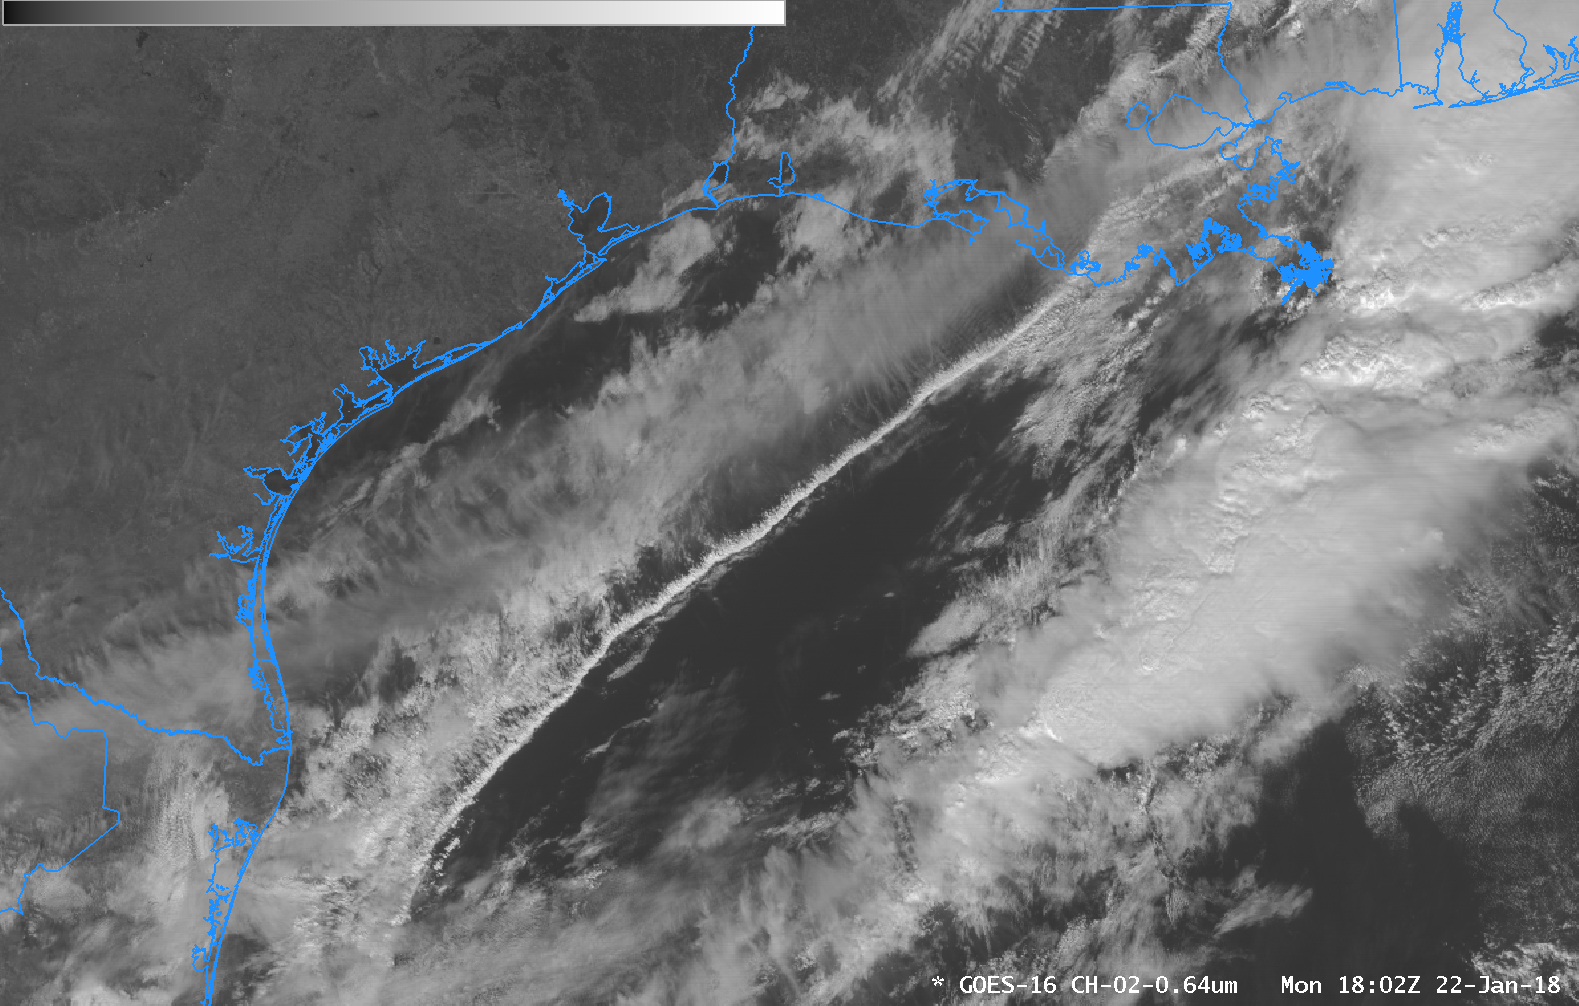
![GOES-16 Water Vapor (6.9 µm) images, with hourly precipitation type plotted in yellow [click to play MP4 animation]](http://cimss.ssec.wisc.edu/goes/blog/wp-content/uploads/2018/01/G16_WV9_WX1_BLIZZARD_22JAN2018_960x1280_B9_2018022_120220_0001PANEL_00145.GIF)
5-minute GOES-16 Water Vapor (6.9 µm) images, with hourly precipitation type plotted in yellow [click to play MP4 animation]
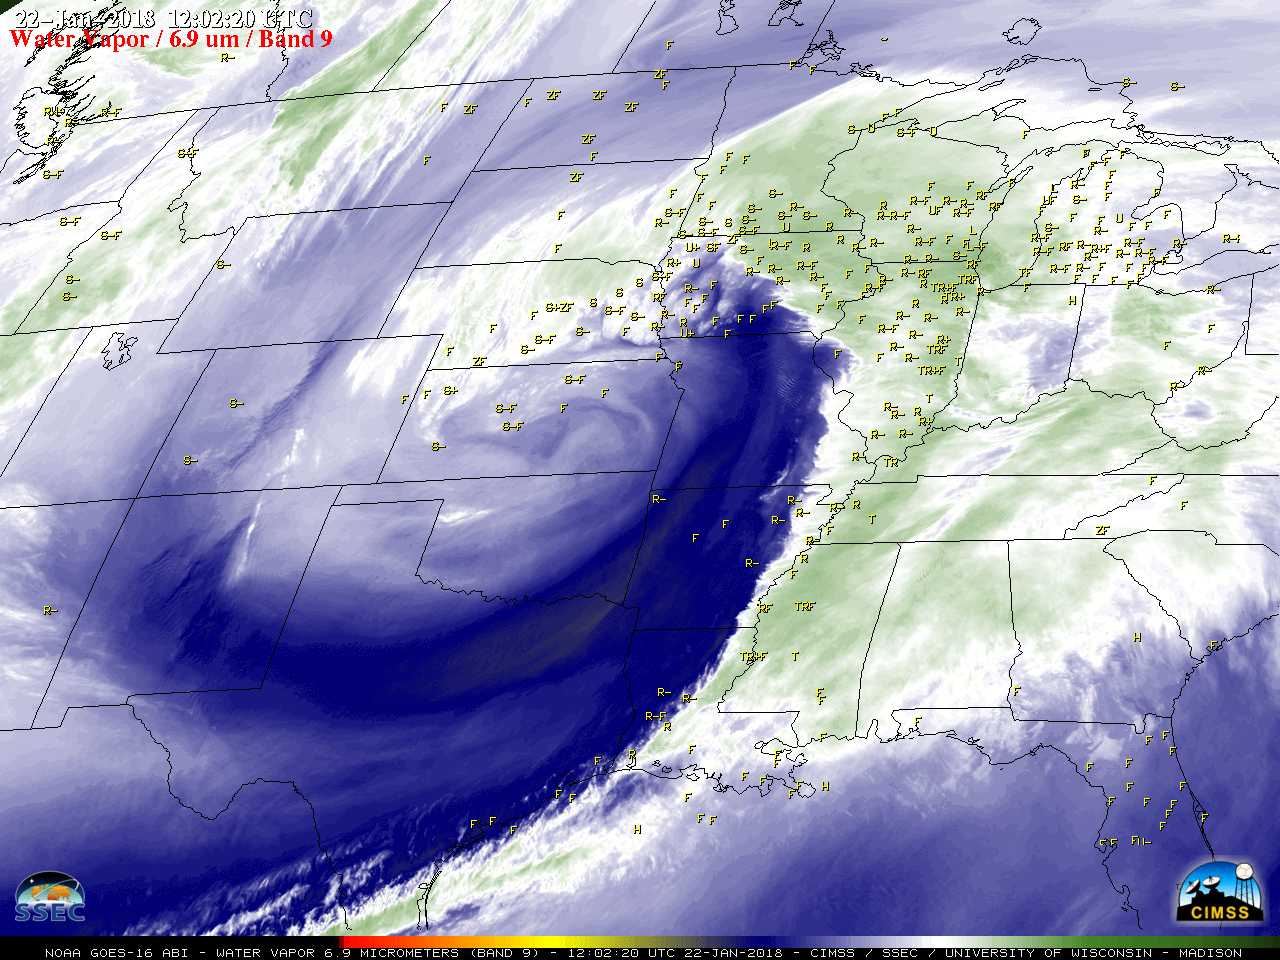
A large mid-latitude cyclone intensified over the central US on
22 January 2018, producing a wide variety of weather — in the cold sector, heavy snow and blizzard conditions across the Plains and Upper Midwest (
WPC storm summary), and in the warm sector, severe weather (tornadoes, large hail and damaging winds:
SPC storm reports) from Mississippi to Illinois, Indiana, and Ohio. GOES-16
(GOES-East) Mid-level Water Vapor (
6.9 µm) images
(above) showed the large size of the storm circulation, which included a well-defined Warm Conveyor Belt (WCB) and a Trough of Warm Air Aloft (
TROWAL) as identified
here. More information on conveyor belts and TROWALs is available
here.
A GOES-16 Mesoscale Sector provided 1-minute imagery over the Upper Midwest — “Red” Visible (0.64 µm) images (below) revealed some of the convective elements surrounding the surface low as it reached its occluded stage over Iowa. A small cluster of thunderstorms also developed over central Illinois around 19 UTC, producing 1.0-inch diameter hail.
![GOES-16 Visible (0.64 µm) images, with hourly precipitation type plotted in yellow [click to play MP4 animation]](http://cimss.ssec.wisc.edu/goes/blog/wp-content/uploads/2018/01/G16_VIS_BLIZZARD_22JAN2018_960x1280_B2_2018022_180028_0001PANEL_00181.GIF)
1-minute GOES-16 Visible (0.64 µm) images, with hourly precipitation type plotted in yellow [click to play MP4 animation]
Taking a closer look at the eastern portion of the previous satellite scene, there was an overlap between the M1 and M2 Mesoscale Sectors — this allowed for images at 30-second intervals
(below).
![30-second GOES-16 Visible (0.64 µm) images, with hourly precipitation type plotted in yellow [click to play MP4 animation]](http://cimss.ssec.wisc.edu/goes/blog/wp-content/uploads/2018/01/G16_VIS_MESO_BLIZZARD_22JAN2018_960x1280_B2_2018022_153858_0001PANEL_00078.GIF)
30-second GOES-16 Visible (0.64 µm) images, with hourly precipitation type plotted in yellow [click to play MP4 animation]