Wildfires in southern California
![GOES-15 Shortwave Infrared (3.9 µm) images, with hourly surface plots [click to play MP4 animation]](https://cimss.ssec.wisc.edu/satellite-blog/wp-content/uploads/sites/5/2017/12/960x1280_WESTL_B2_GOES15_SOCAL_FIRES_05DEC2017_2017339_144500_0001PANEL.GIF)
GOES-15 Shortwave Infrared (3.9 µm) images, with hourly surface plots [click to play MP4 animation]
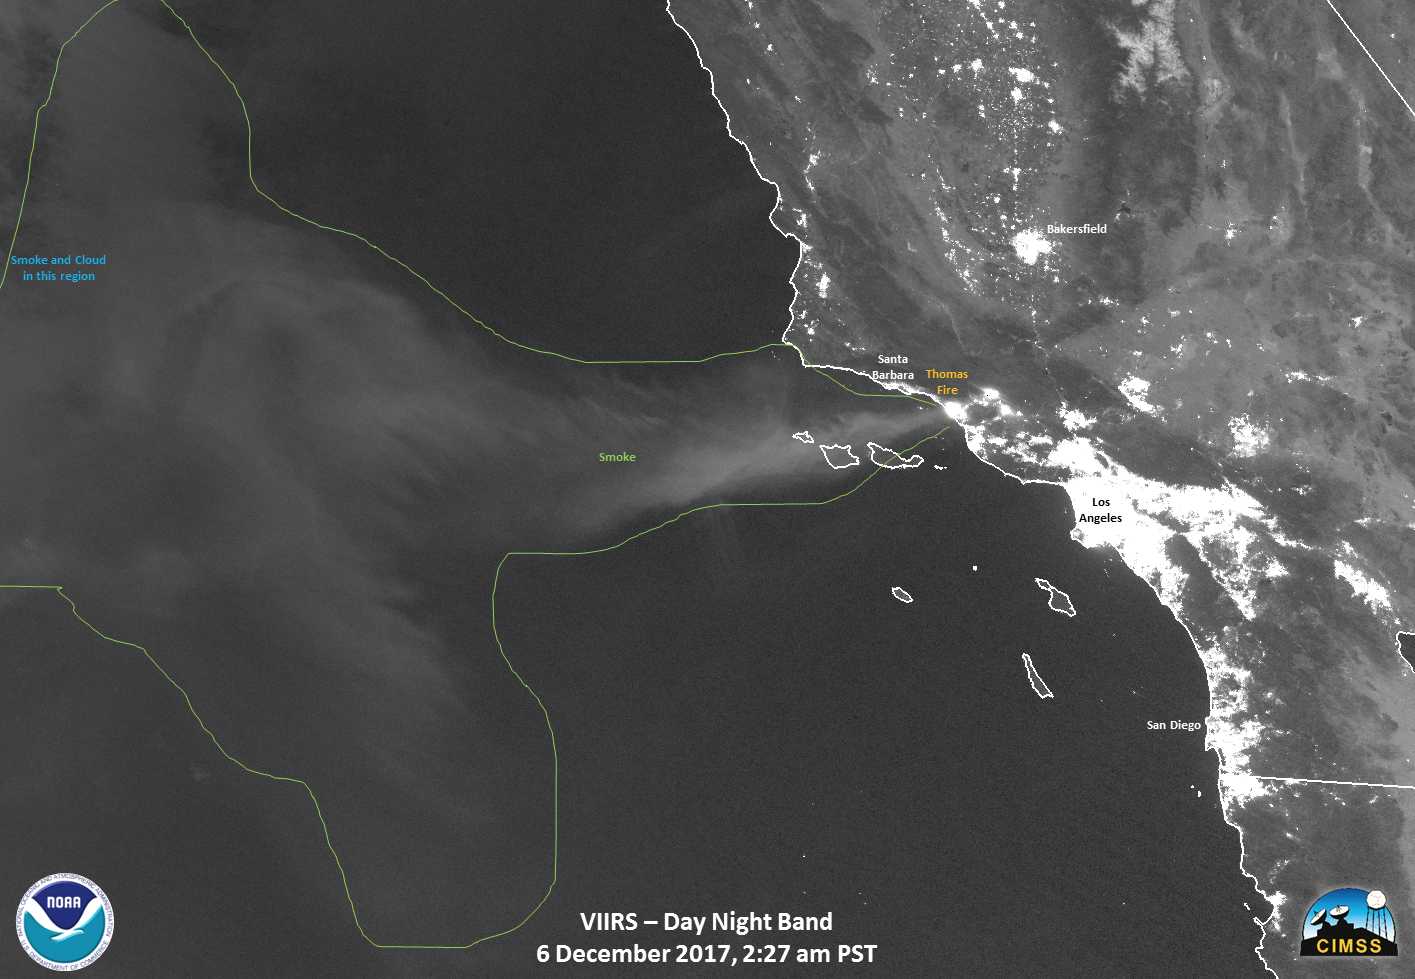
Nighttime image toggles between Suomi NPP VIIRS Shortwave Infrared (3.74 µm) and Day/Night Band (0.7 µm) data at 0904 UTC and 1044 UTC (below) revealed the large fire hot spots, along with the extensive smoke plume that was drifting over the adjacent nearshore waters of the Pacific Ocean. With ample illumination from the Moon (which was in the Waning Gibbous phase, at 95% of Full), the “visible image at night” capability of the VIIRS Day/Night Band — which will also be available from the recently-launched JPSS-1/NOAA-20 satellite — was clearly demonstrated.
![Suomi NPP VIIRS Shortwave Infrared (3.74 µm) and Day/Night Band (0.7 µm) images, with plots of surface reports [click to enlarge]](https://cimss.ssec.wisc.edu/satellite-blog/wp-content/uploads/sites/5/2017/12/171205_0904utc_suomi_npp_viirs_ShortwaveInfrared_DayNightBand_SoCal_fires_anim.gif)
Suomi NPP VIIRS Shortwave Infrared (3.74 µm) and Day/Night Band (0.7 µm) images, with plots of surface reports [click to enlarge]
![Suomi NPP VIIRS Shortwave Infrared (3.74 µm) and Day/Night Band (0.7 µm) images, with plots of surface reports [click to enlarge]](https://cimss.ssec.wisc.edu/satellite-blog/wp-content/uploads/sites/5/2017/12/171205_1044utc_suomi_npp_viirs_ShortwaveInfrared_DayNightBand_SoCal_fires_anim.gif)
Suomi NPP VIIRS Shortwave Infrared (3.74 µm) and Day/Night Band (0.7 µm) images, with plots of surface reports [click to enlarge]
![Suomi NPP VIIRS Day/Night Band (0.7 µm) images [click to enlarge]](https://cimss.ssec.wisc.edu/satellite-blog/wp-content/uploads/sites/5/2017/12/171205_suomi_npp_viirs_DayNightBand_anim.gif)
Suomi NPP VIIRS Day/Night Band (0.7 µm) images [click to enlarge]
![Suomi NPP VIIRS 4.05 µm and 3.75 µm Shortwave Infrared images [click to enlarge]](https://cimss.ssec.wisc.edu/satellite-blog/wp-content/uploads/sites/5/2017/12/171205_0907utc_viirs_shortwave_infrared_anim.gif)
Suomi NPP VIIRS 4.05 µm and 3.75 µm Shortwave Infrared images [click to enlarge]
![GOES-15 Visible (0.63 µm, top) and Shortwave Infrared (3.9 µm, bottom) images [click to play MP4 animation]](https://cimss.ssec.wisc.edu/satellite-blog/wp-content/uploads/sites/5/2017/12/G15_VIS_SWIR_SOCAL_FIRES_05DEC2017_480x1280_B12_2017339_174100_0002PANELS_00014.GIF)
GOES-15 Visible (0.63 µm, top) and Shortwave Infrared (3.9 µm, bottom) images [click to play MP4 animation]
![Aqua MODIS true-color RGB image [click to enlarge]](https://cimss.ssec.wisc.edu/satellite-blog/wp-content/uploads/sites/5/2017/12/171205_aqua_modis_truecolor_SoCal_fires.jpg)
Aqua MODIS true-color RGB image [click to enlarge]
![Time series plot of surface reports at Van Nuys, California [click to enlarge]](https://cimss.ssec.wisc.edu/satellite-blog/wp-content/uploads/sites/5/2017/12/171205_KVNY_SFCMG.GIF)
Time series plot of surface reports at Van Nuys, California [click to enlarge]
===== 06 December Update =====
![Suomi NPP VIIRS Day/Night Band (0.7 µm) and Shortwave Infrared (3.75 µm and 4.05 µm) images [click to enlarge]](https://cimss.ssec.wisc.edu/satellite-blog/wp-content/uploads/sites/5/2017/12/171206_1027utc_viirs_DayNightBand_ShortwaveInfrared_NearInfrared_SoCal_fires_anim.gif)
Suomi NPP VIIRS Day/Night Band (0.7 µm) and Shortwave Infrared (3.75 µm and 4.05 µm) images [click to enlarge]
GOES-15 Shortwave Infrared (3.9 µm) images (below) displayed the thermal signatures exhibited by the fires. Note the appearance of a new fire — the Skirball Fire — first appearing on the 1300 UTC (5:00 AM local time) image, just north of Santa Monica (KSMO). Although the Santa Ana winds were not quite as strong as the previous day, some impressive wind gusts were still reported.
![GOES-15 Shortwave Infrared (3.9 µm) images, with hourly surface plots [click to play MP4 animation]](https://cimss.ssec.wisc.edu/satellite-blog/wp-content/uploads/sites/5/2017/12/960x1280_WESTL_B2_GOES15_SOCAL_FIRES_06DEC2017_2017340_134500_0001PANEL.GIF)
GOES-15 Shortwave Infrared (3.9 µm) images, with hourly surface plots [click to play MP4 animation]
![Comparison of Terra (1911 UTC) & Aqua (2047 UTC) MODIS true-color RGB images [click to enlarge]](https://cimss.ssec.wisc.edu/satellite-blog/wp-content/uploads/sites/5/2017/12/171206_terra_aqua_modis_truecolor_SoCal_fires_anim.gif)
Comparison of Terra (1911 UTC) & Aqua (2047 UTC) MODIS true-color RGB images [click to enlarge]
===== 07 December Update =====

Suomi NPP Day Night Band Imagery, 3-7 December 2017, over southern California
RealEarth imagery of the Day Night Band over 5 days (one image each night from 3 through 7 December), above, shows the evolution of the fire complex (Imagery courtesy Russ Dengel, SSEC). Similarly, a closer view of daily composites of VIIRS Shortwave Infrared (3.74 µm) imagery (below) revealed the growth and spread of the Thomas Fire from 04-07 December.
Suomi NPP VIIRS Shortwave Infrared (3.74 µm) image composites [click to enlarge]
![Terra MODIS true-color and false-color images [click to enlarge]](https://cimss.ssec.wisc.edu/satellite-blog/wp-content/uploads/sites/5/2017/12/171207_1816utc_terra_modis_truecolor_falsecolor_SoCal_fires_anim.gif)
Terra MODIS true-color and false-color images [click to enlarge]