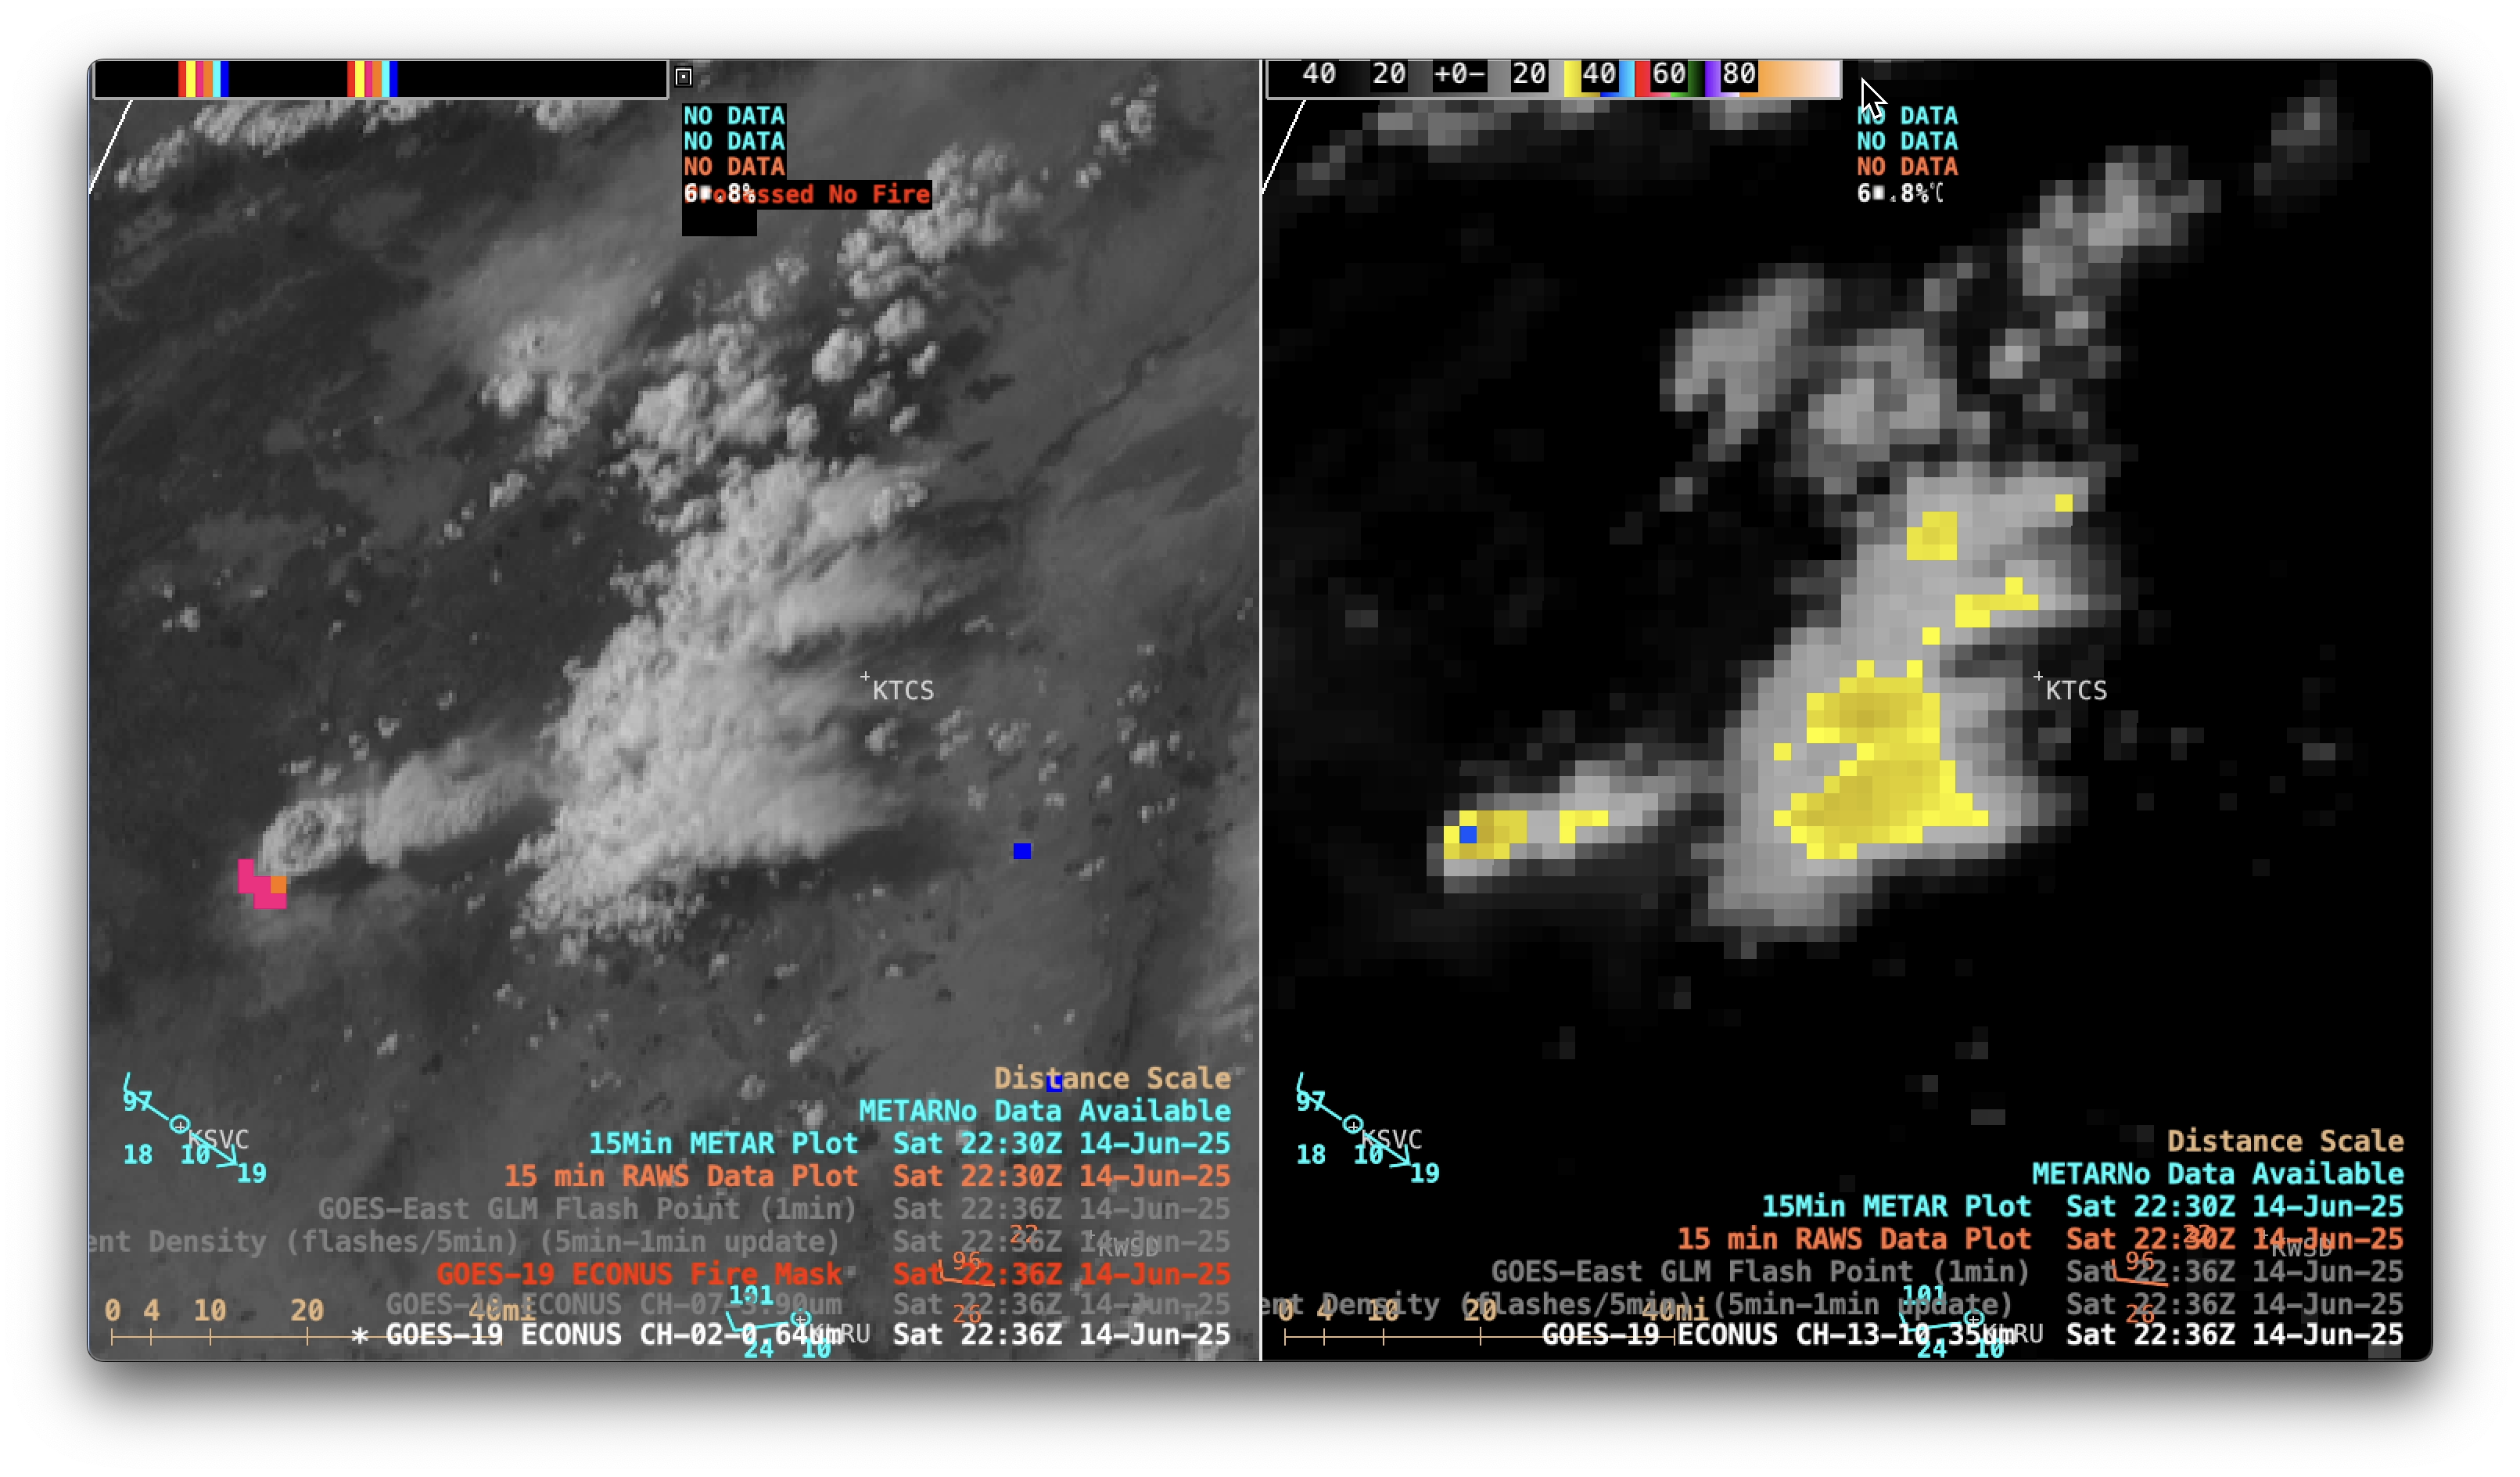
5-minute CONUS sector GOES-19 (GOES-East) “Clean” Infrared Window (10.3 µm) images and “Red” Visible (0.64 µm) images with an overlay of the FDCA Fire Mask derived product (above) showed that the Trout Fire in southwest New Mexico produced a pyrocumulonimbus (pyroCb) cloud late in the day on 14 June 2025. The pyroCb cloud... Read More
5-minute GOES-19 Red Visible (0.64 µm) images with an overlay of the Fire Mask derived product (left) and Clean Infrared Window (10.3 µm, right) images, from 1606 UTC on 14 June to 0201 UTC on 15 June [click to play MP4 animation]
5-minute CONUS sector GOES-19
(GOES-East) “Clean” Infrared Window (10.3 µm) images and “Red” Visible (0.64 µm) images with an overlay of the
FDCA Fire Mask derived product
(above) showed that the
Trout Fire in southwest New Mexico produced a
pyrocumulonimbus (pyroCb) cloud late in the day on
14 June 2025. The pyroCb cloud exhibited cloud-top 10.3 µm infrared brightness temperatures (IRBTs) in the -40s C (denoted by shades of blue to cyan) — a necessary condition to be classified as a pyroCb — beginning at
2236 UTC on 14 June. This was the first confirmed pyroCb in the US for the 2025 wildfire season.
The coldest pyroCb cloud-top IRBT was -44.71ºC at 0021 UTC on 15 June, with a corresponding Cloud Top Height derived product value of 37510.62 ft (below).
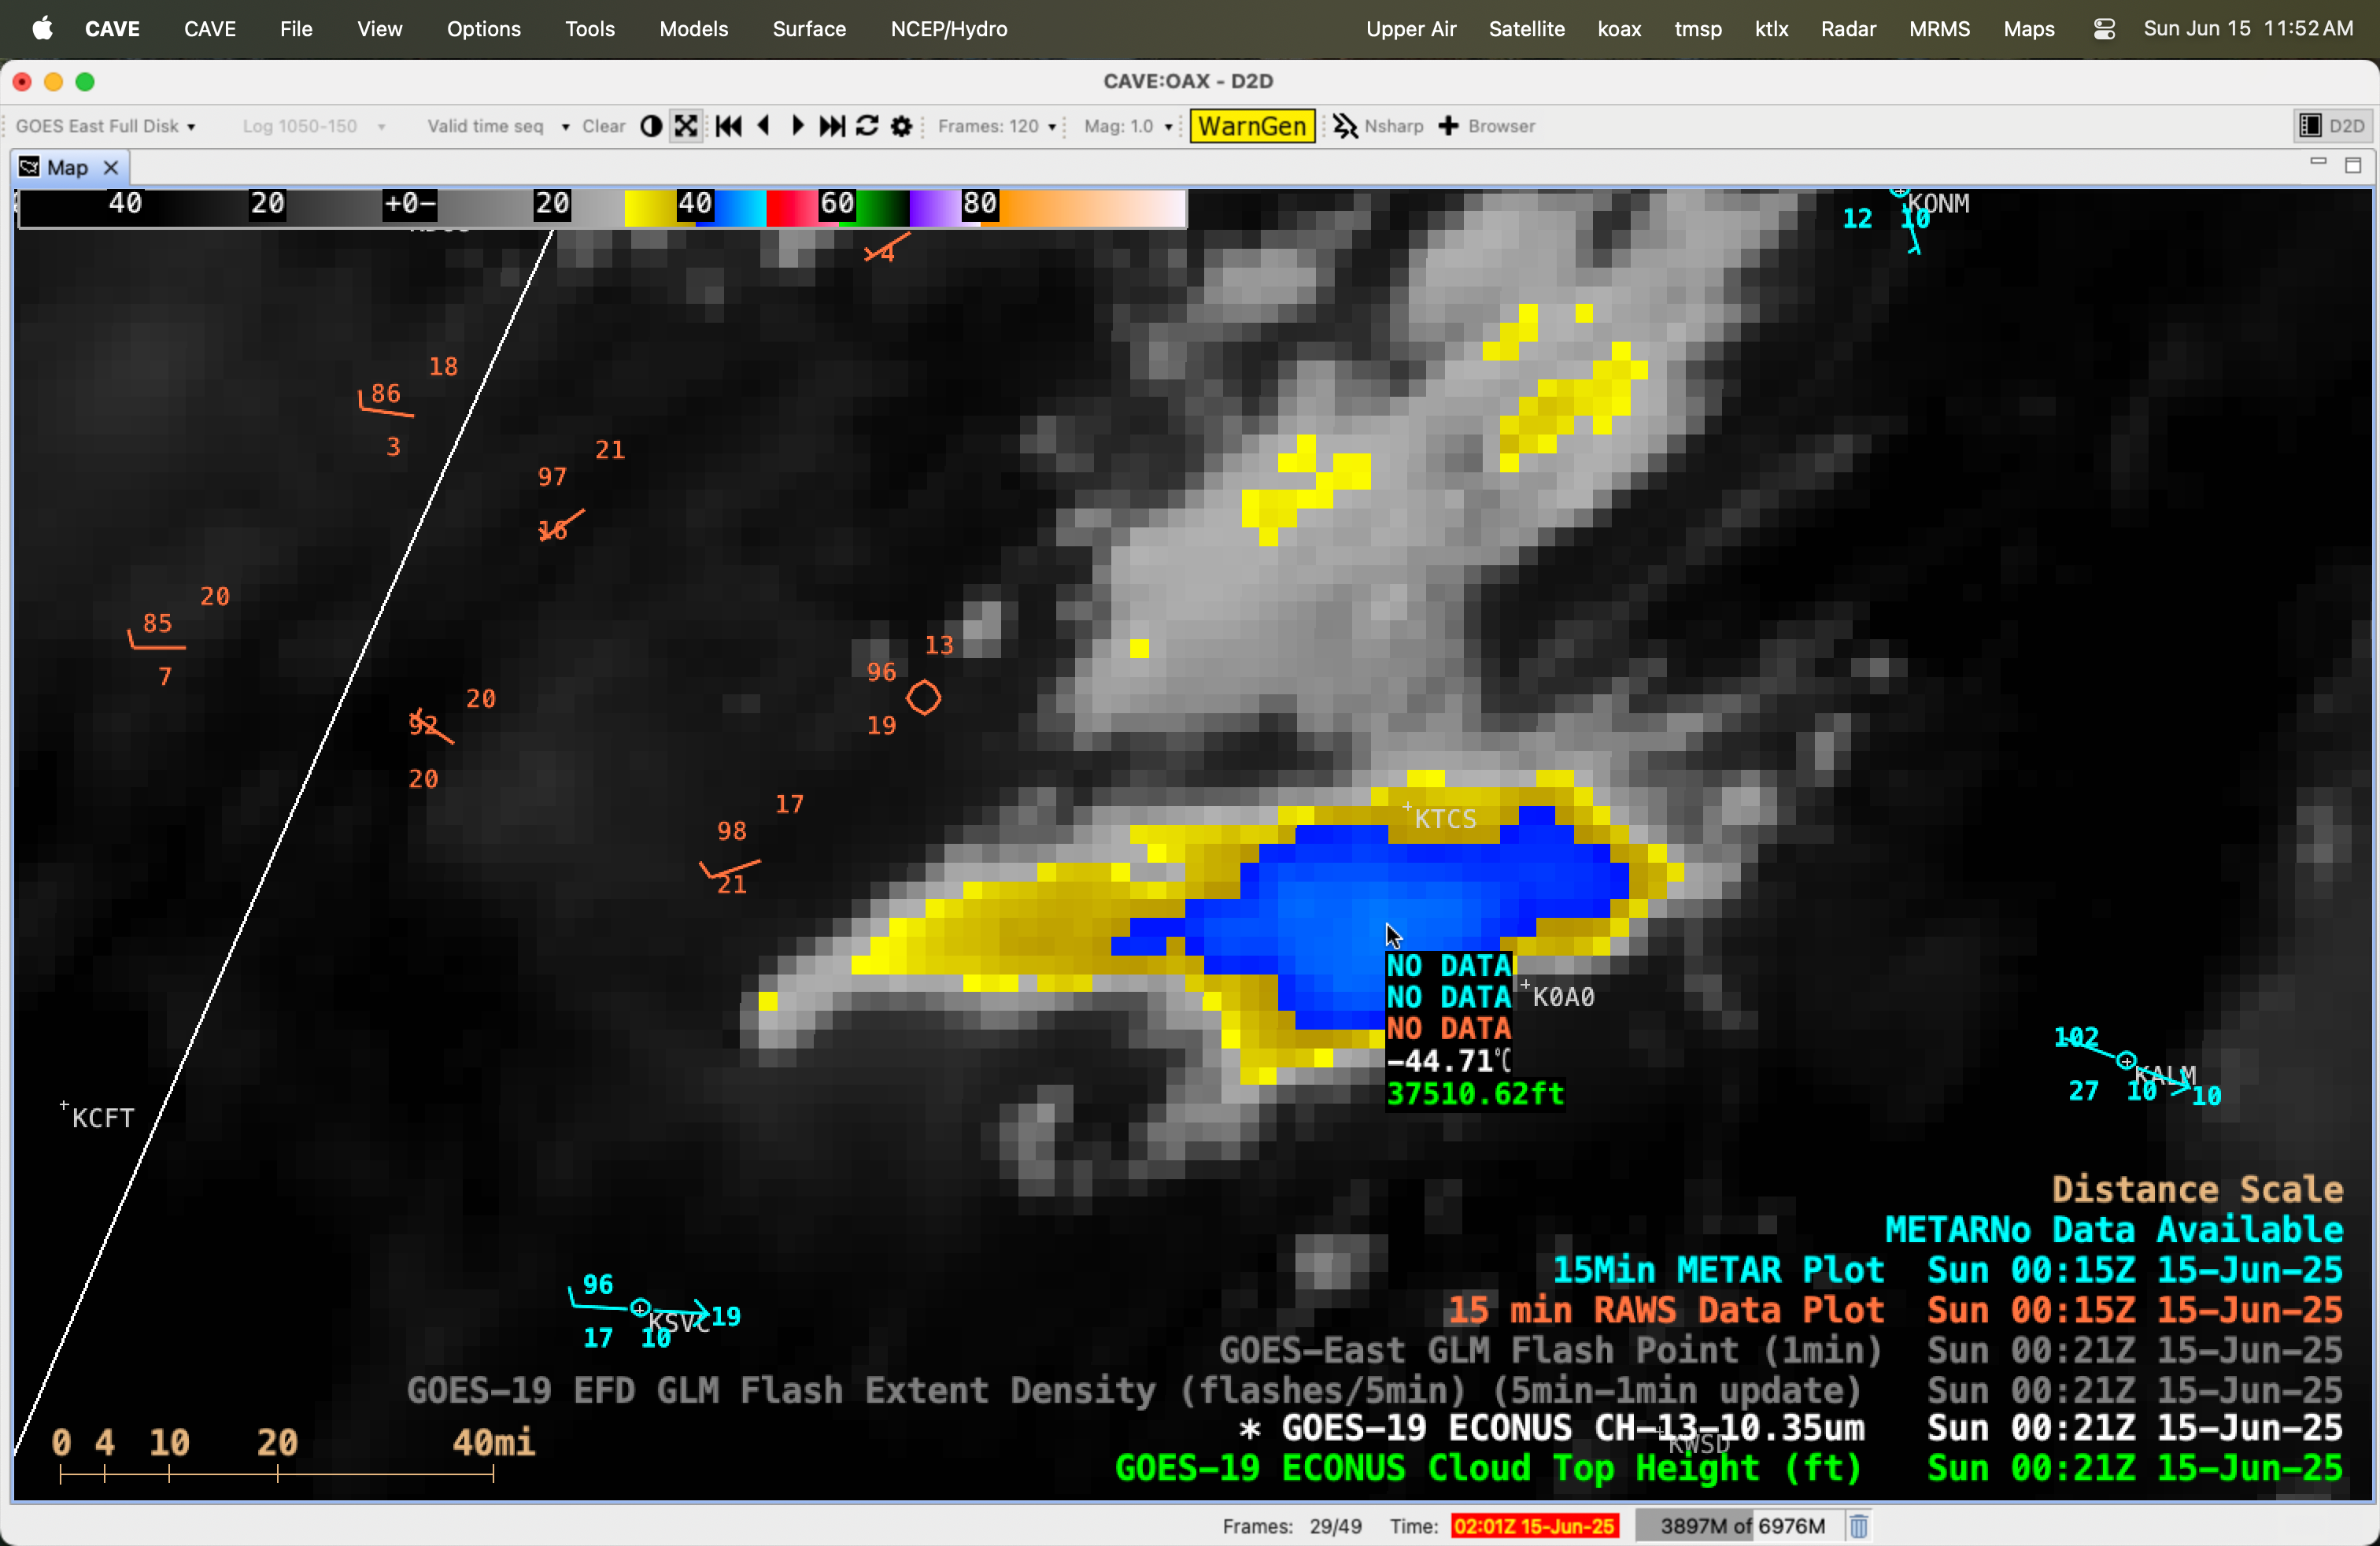
GOES-19 Clean Infrared Window (10.3 µm) image with a cursor sample of the coldest cloud-top infrared brightness temperature (white) along with the corresponding Cloud Top Height derived product (green) at 0021 UTC on 15 June [click to enlarge]
On rawinsonde data from El Paso, Texas
(below) the air temperature of -44.71ºC occurred at an altitude around 11.0 km (36089.2 ft) — slightly above the surface-based air parcel Equilibrium Level (EL) — and somewhat lower than the 37510.62 ft value indicated by the GOES-19 Cloud Top Height derived product.
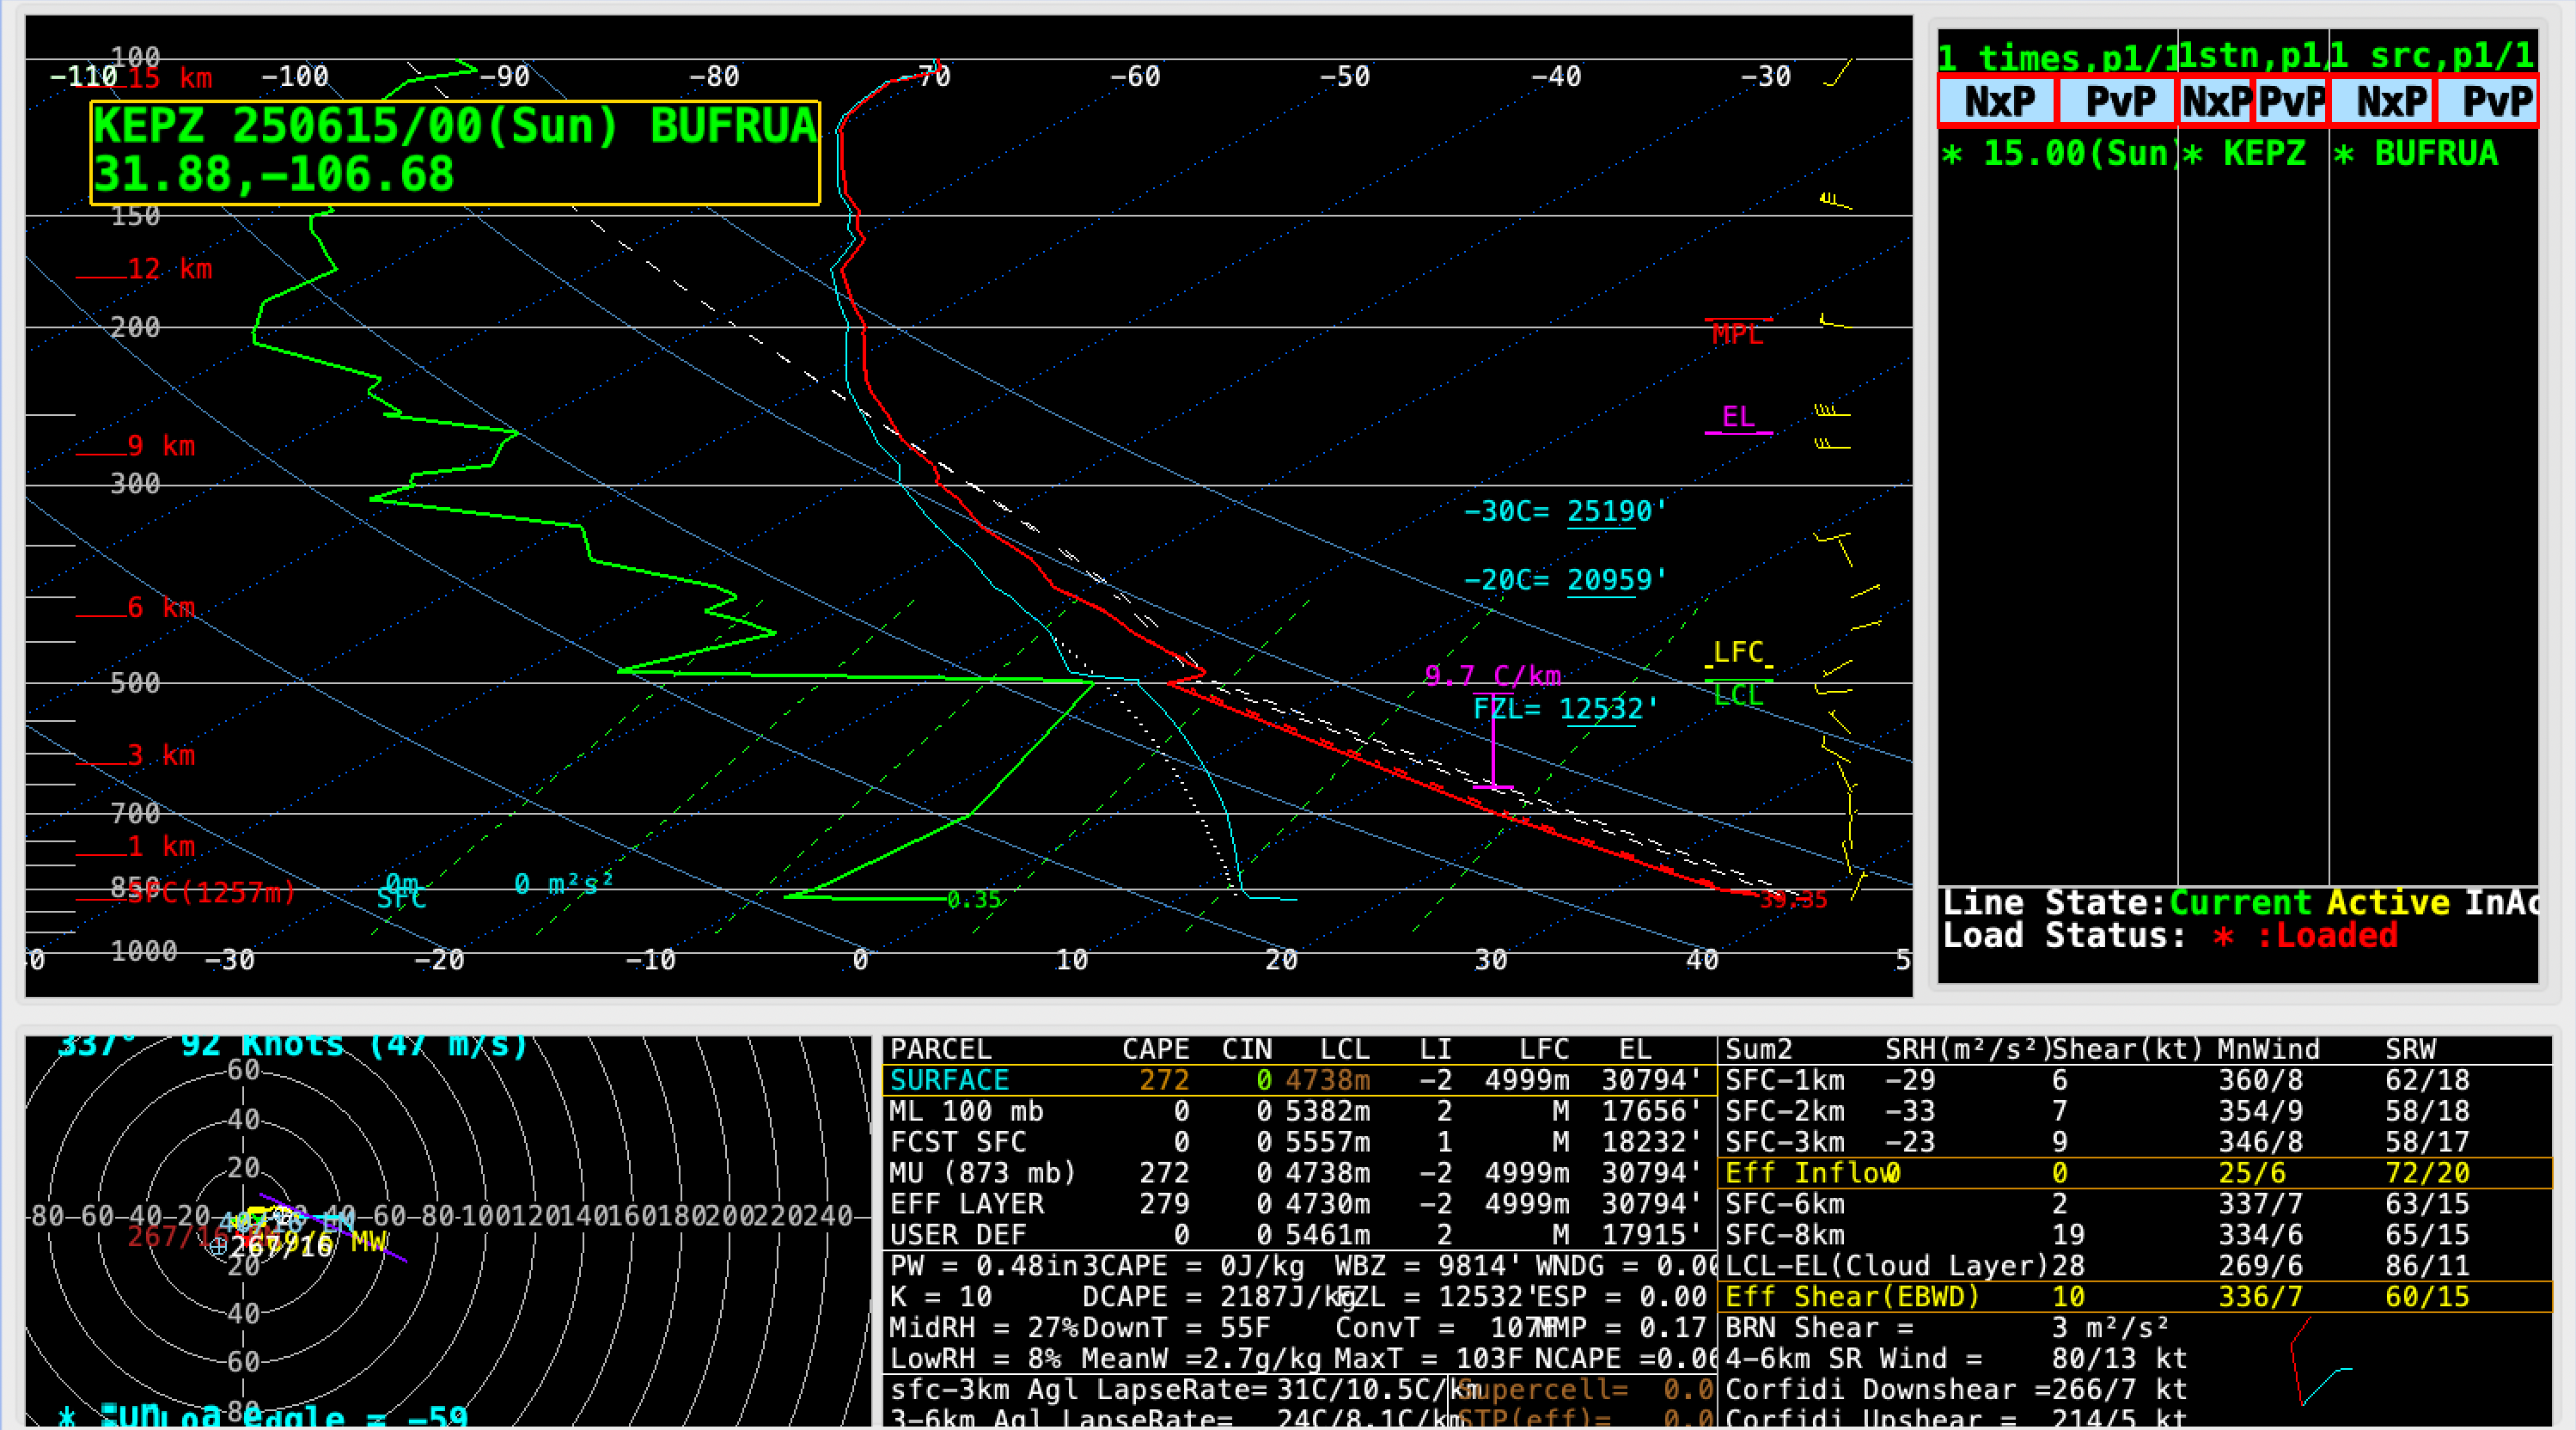
Plot of rawinsonde data from El Paso, Texas at 0000 UTC on 15 June [click to enlarge]
———————

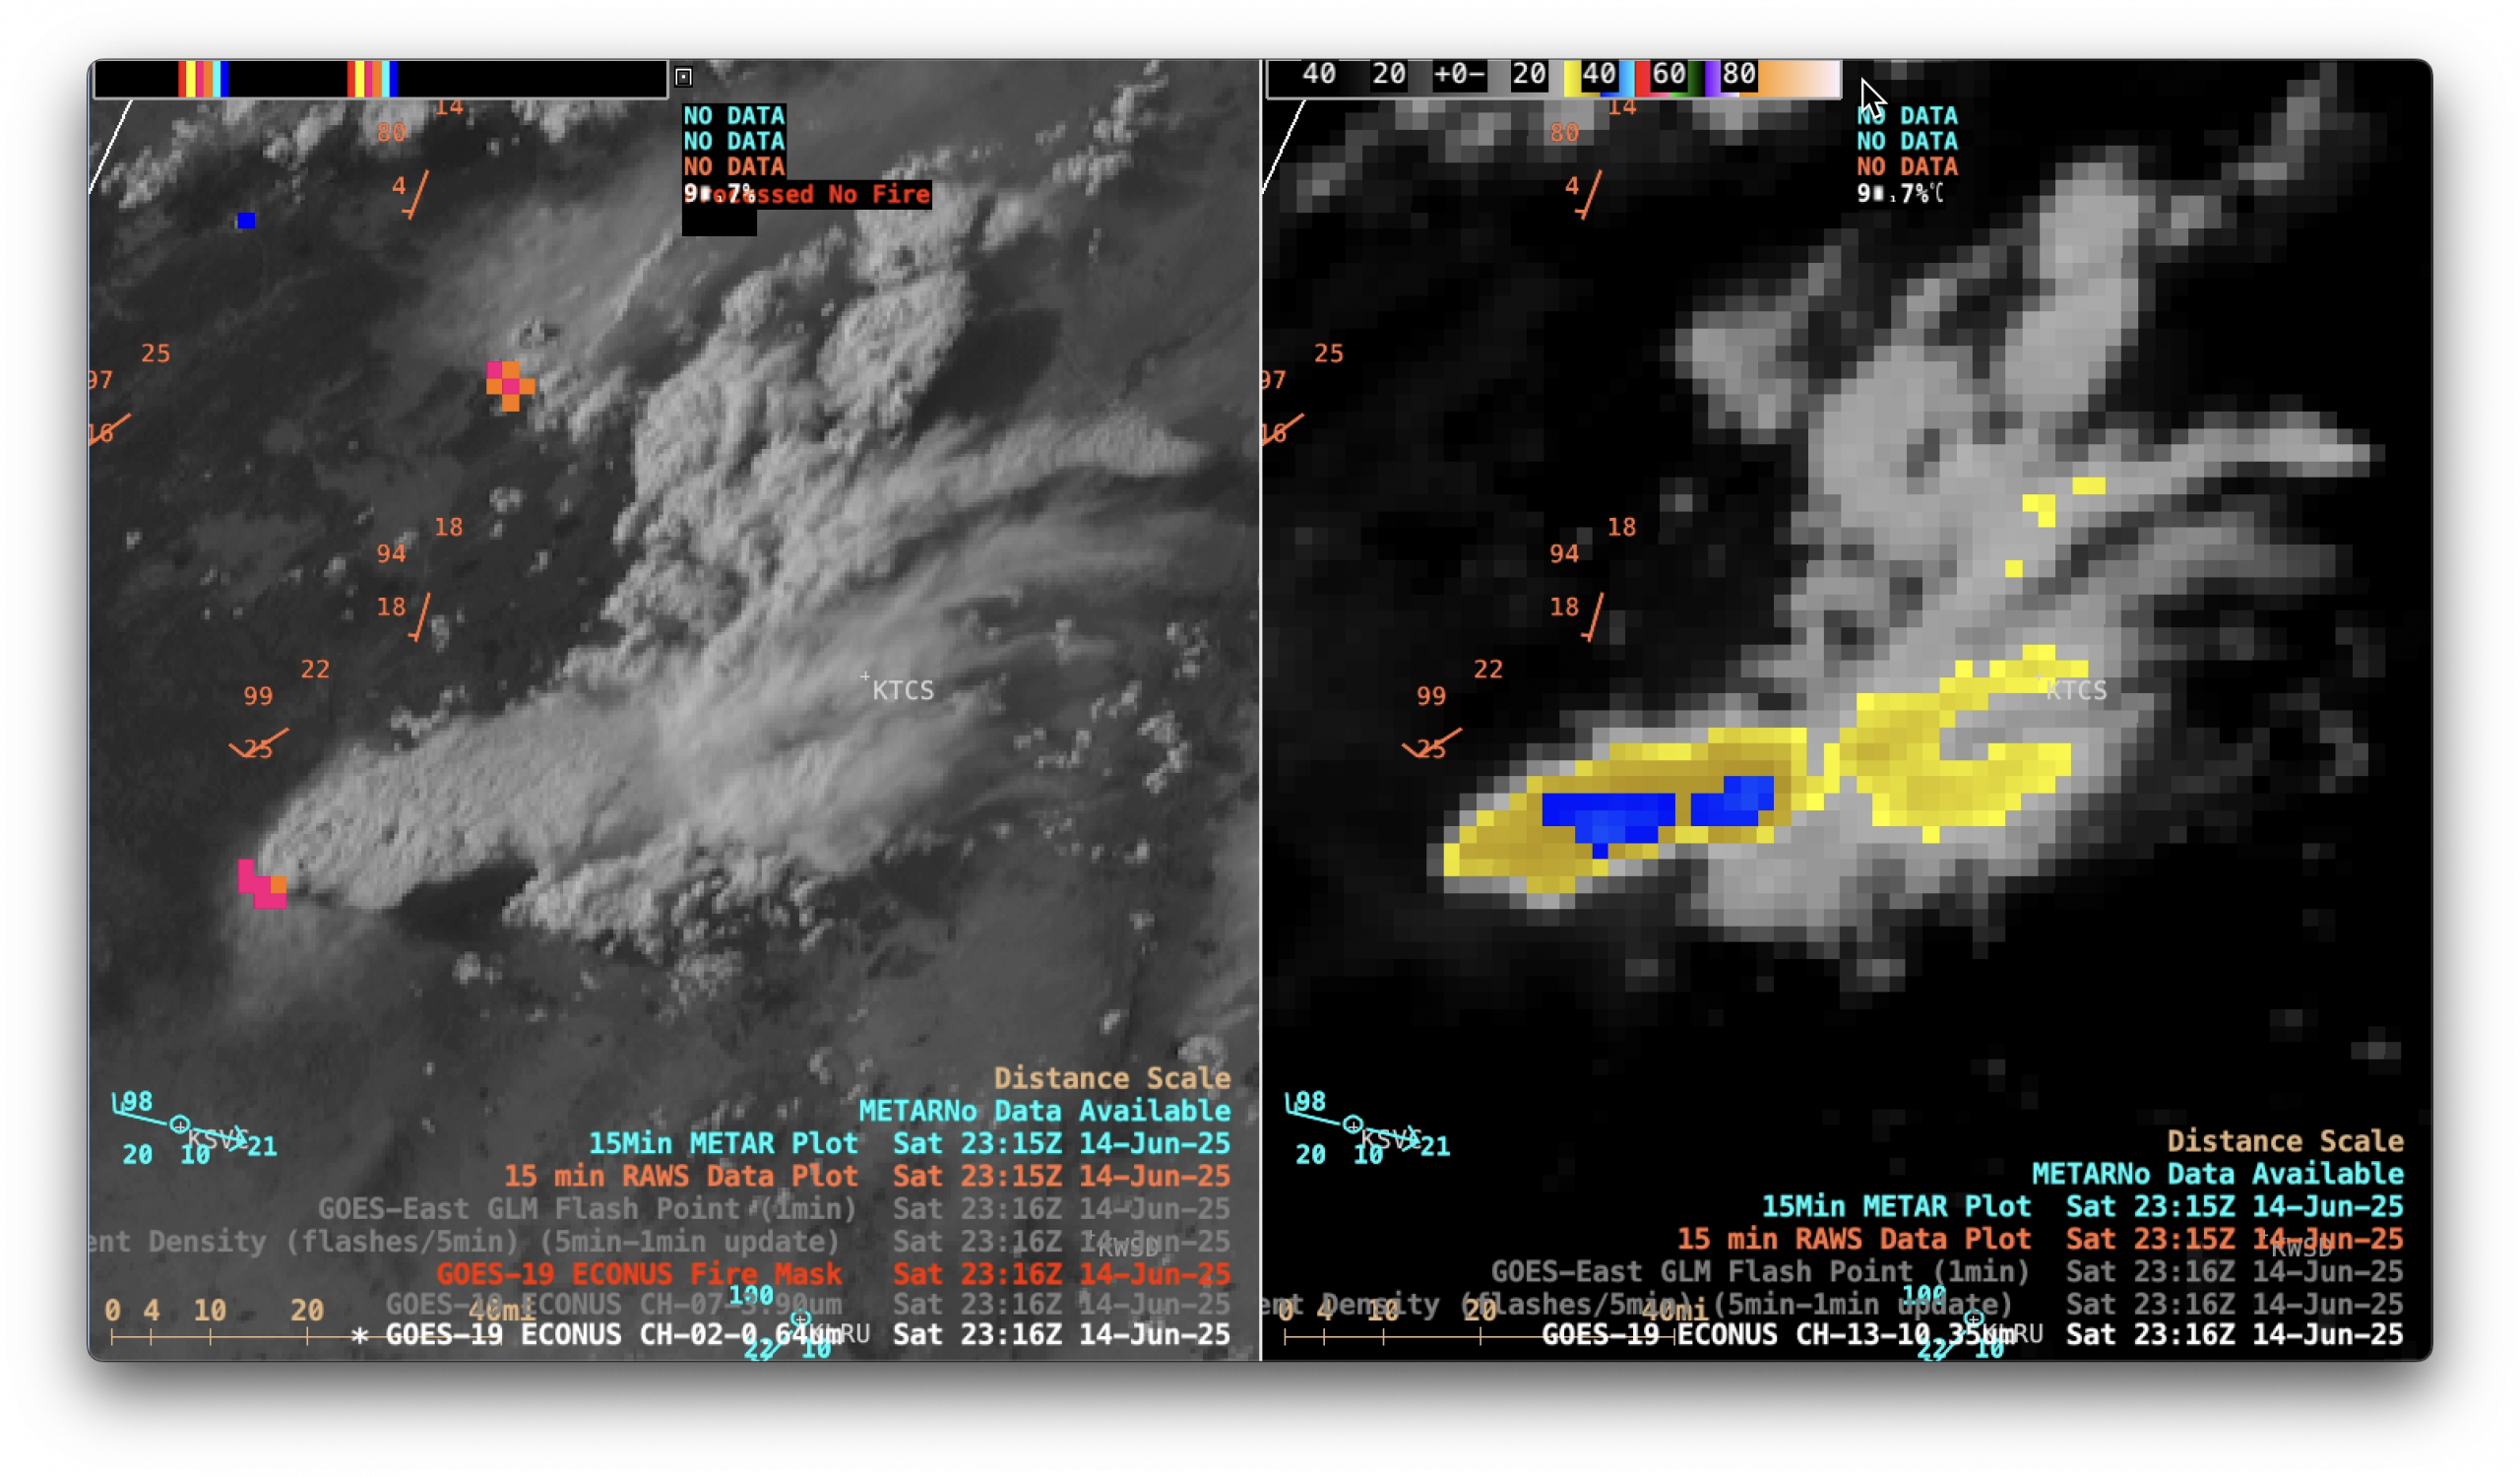
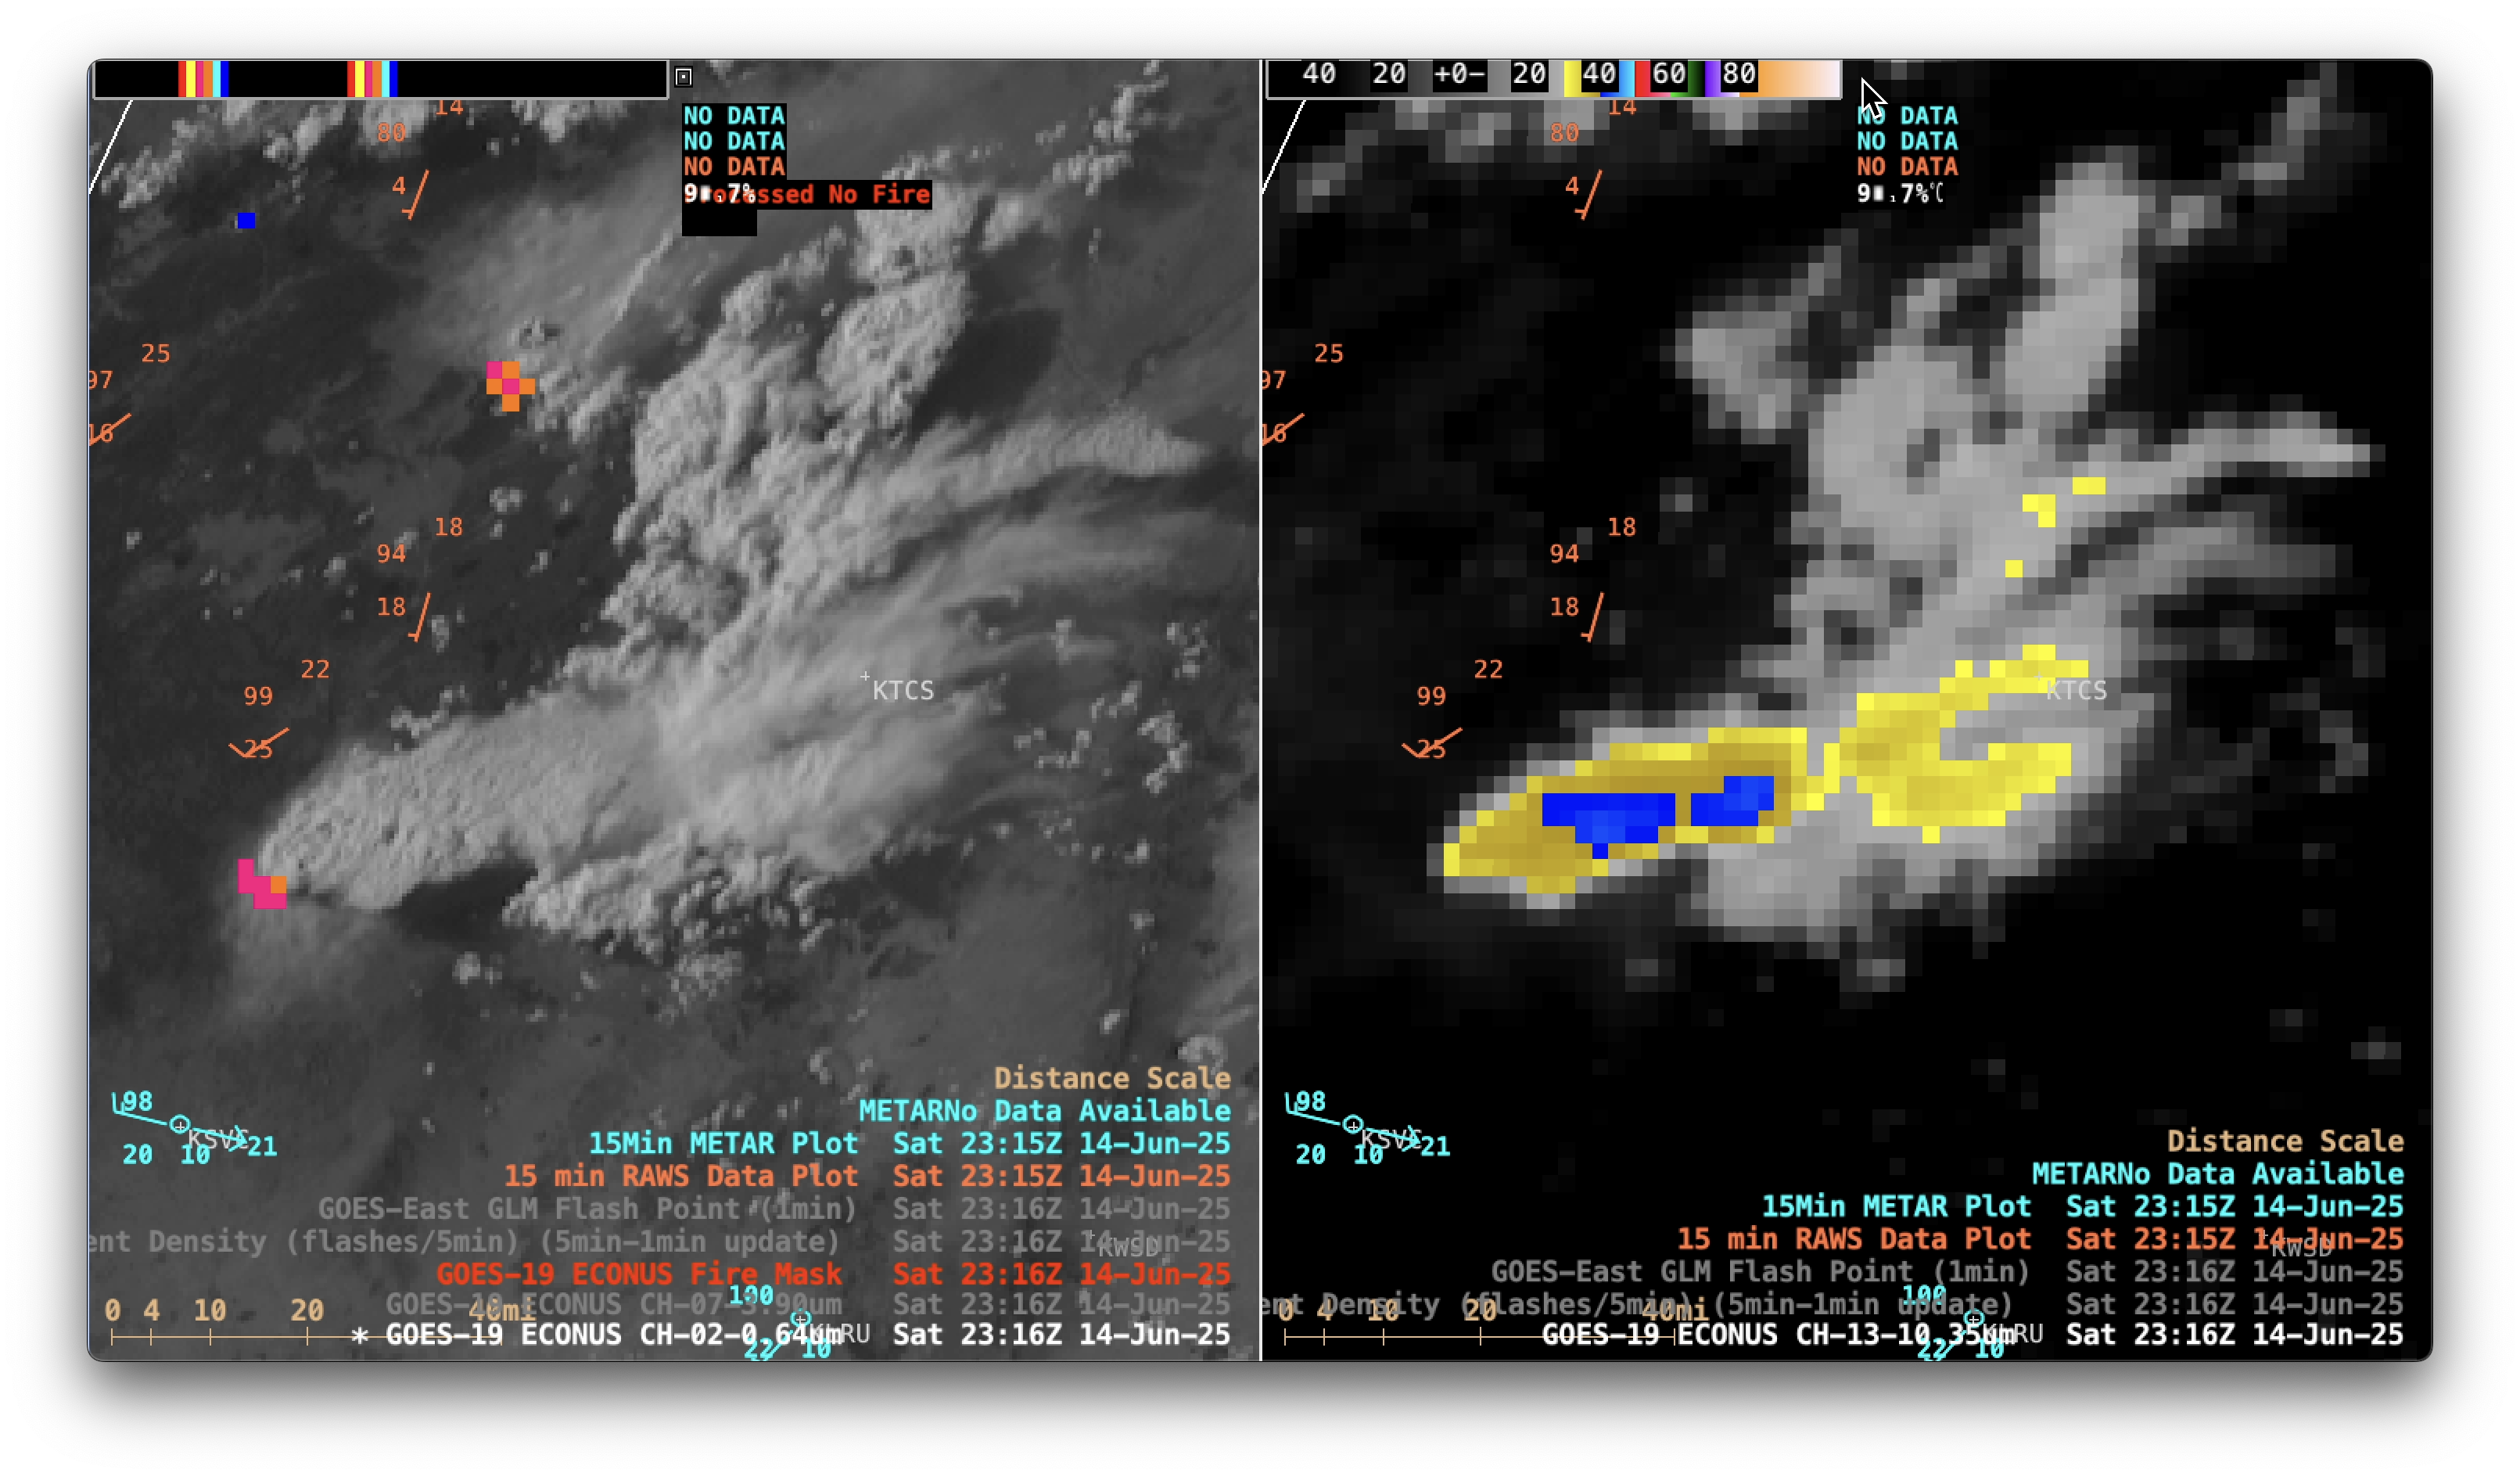
GOES-19 Red Visible (0.64 µm) images + Fire Mask derived product (left) and Clean Infrared Window(10.3 µm, right) images, with an overlay of GOES-19 GLM Flash Extent Density (large light-purple pixels) and Flash Points (white dots) at 2311 and 2316 UTC on 14 June [click to enlarge]
There was a brief period of
GLM-detected lightning activity associated with this pyroCb cloud, from both GOES-19/GOES-East
(above) and GOES-18/GOES-West
(below).

GOES-19/GOES-East Red Visible (0.64 µm) images + Fire Mask derived product (left) and Clean Infrared Window(10.3 µm, right) images, with an overlay of GOES-18/GOES-West GLM Flash Extent Density (large light-purple pixels) and Flash Points (white dots) at 2311, 2316 and 2326 UTC on 14 June [click to enlarge]
——————–
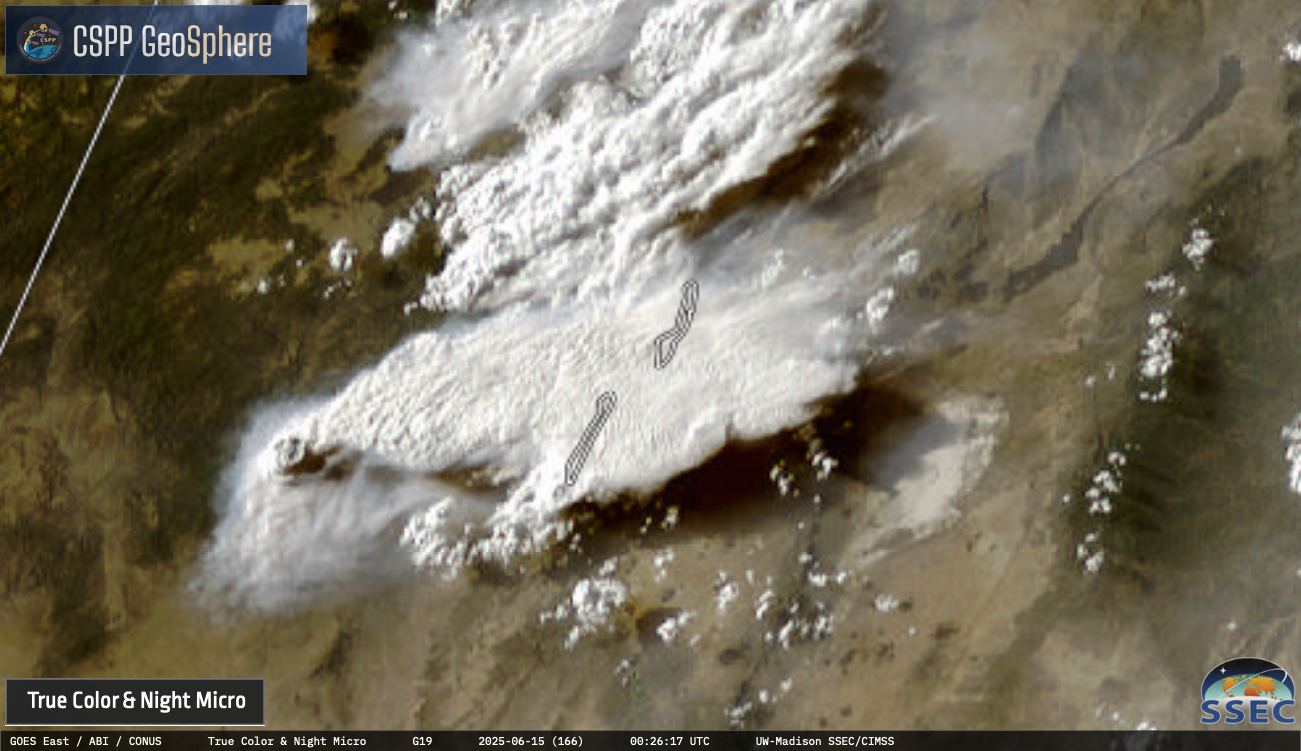
5-minute GOES-19/GOES-East True Color RGB images, from 2101 UTC on 14 June to 0141 UTC on 15 June [click to play MP4 animation]
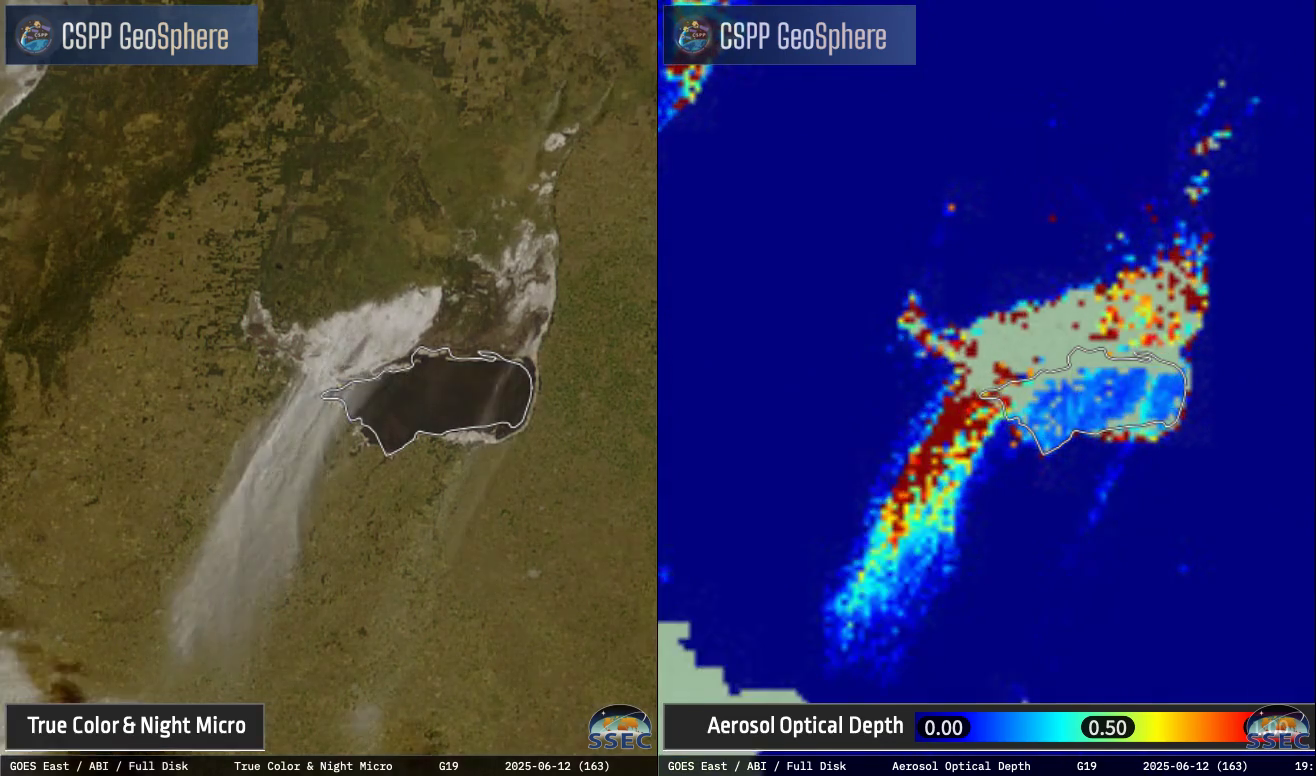
True Color RGB images from the
CSPP GeoSphere site showed the development and growth of the pyroCb, as viewed from GOES-19/GOES-East
(above) and GOES-18/GOES-West
(below). Note how lower-altitude smoke was gradually moving southward away from the Trout Fire location — some of this smoke later reduced the surface visibility to 5 miles at the Silver City/Grant County Airport (KSVC) after
1500 UTC on 15 June.
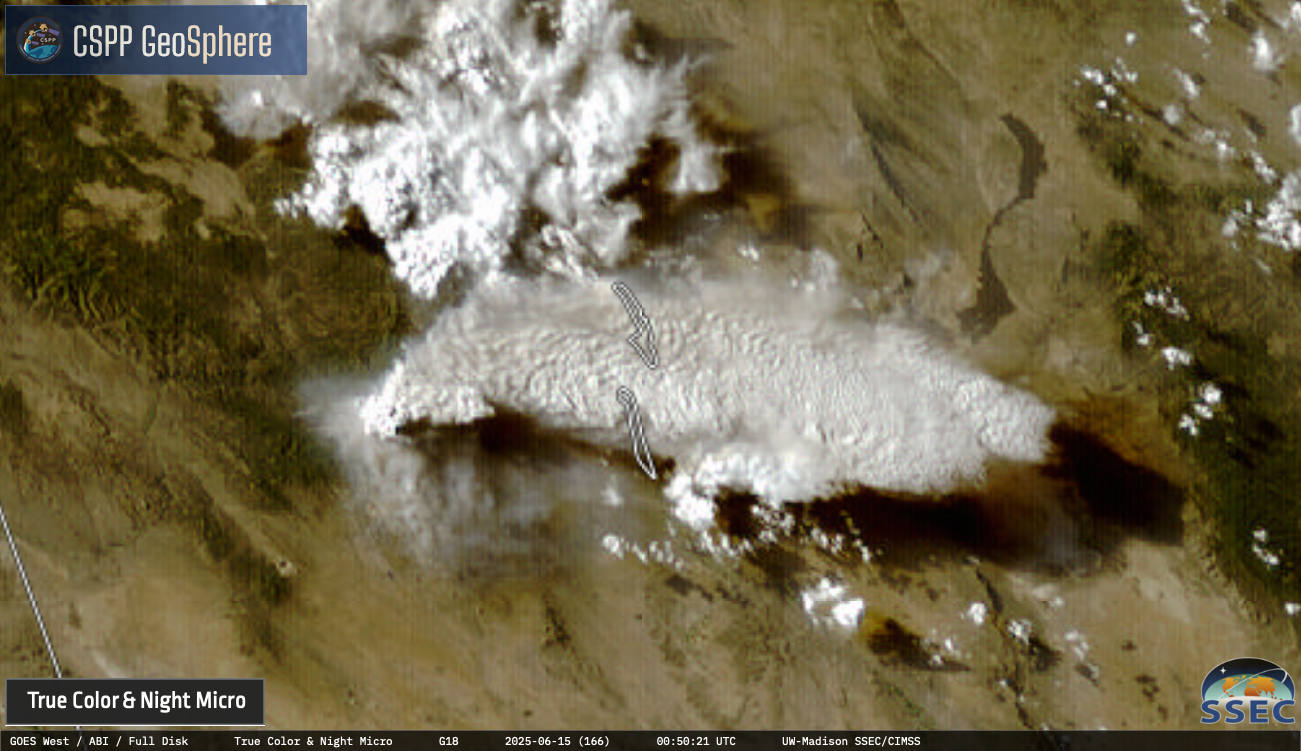
10-minute GOES-18/GOES-West True Color RGB images, from 2100 UTC on 14 June to 0130 UTC on 15 June [click to play MP4 animation]
——————–
As the Trout Fire continued to burn into the subsequent nighttime hours, its bright glow in northeastern Grant County was very apparent in a NOAA-20 VIIRS Day/Night Band (0.7 µm) image valid at 0847 UTC or 2:47 AM MST (below).

NOAA-20 (mislabeled as NPP) VIIRS Day/Night Band (0.7 µm) image valid at 0847 UTC on 15 June [click to enlarge]
View only this post
Read Less


