The University of Wisconsin served as the official National Satellite Archive for many years before the National Climatic Data Center took over that responsibility. The original operational GOES satellite archive was acquired at the UW-SSEC Data Center onto Sony U-Matic tapes starting in 1978. When these... Read More

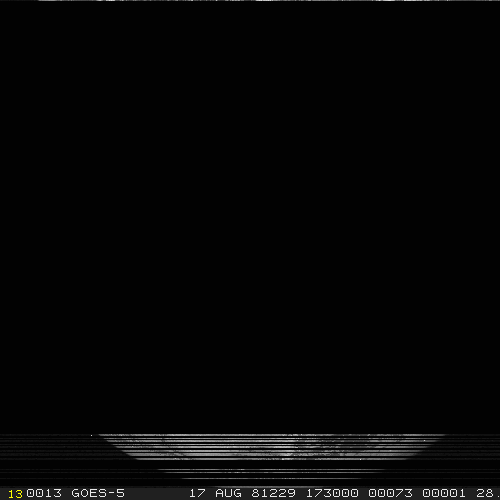
GOES-5 Visible Imagery of Hurricane Dennis over Florida in August 1981
The University of Wisconsin served as the official National Satellite Archive for many years before the National Climatic Data Center took over that responsibility. The original operational GOES satellite archive was acquired at the UW-SSEC Data Center onto Sony U-Matic tapes starting in 1978. When these data were converted from U-Matic tapes to IBM 3590 tapes in the mid-1990s through the early 2000s, notable gaps in the satellite record were obvious. (Click here for the image shown above in its originally ingested form).
Recent work at the SSEC Data Center has started to fill in those missing gaps using newly written software that reconciles redundant data and interrogates any anomalies found. Errors that arise from mis-tracking on the U-Matic tape, for example, can be corrected. Similarly, Ingest/signal transmit errors on the U-Matic tape can be rectified. It is important to note that no data are changed, averaged or otherwise manipulated in this processing; rather, data are uncovered by correcting errors in previous processing.
Playback from the U-Matic tapes in the 1990s and 2000s for one image may have occurred multiple times if the Engineer determined that tracking or other errors could be mitigated by adjusting the playback. Usually this involved manual tracking working with an oscilloscope. Present-day recovery involves reprocessing data saved on 3590s (originally pulled from U-Matic tapes), effectively re-ingesting all images, possibly resulting in multiple different ingested images (If an image was played back more than once from the U-Matic tape) that can be merged together into one image that is far more complete than its separate pieces. In a second type of recovery, the playback is redone only once, but smarter ingest software corrects tracking noise, signal noise and tape deterioration. All of the signal (including the noise) was saved onto the 3590s.
More examples of the correction results are shown below. In each case, the original version saved on 3590 is on the left, and the cleaned version is on the right.
About 2800 Mode-A images thought to be completely lost have been recovered by this processing. Nearly 8100 images had corrections to at least 95% of their lines. More than 25000 images had framing errors that were corrected, which errors affected every visible scan in the image. In sum, about 2 full years of data have been recovered from the archive by the smarter re-processing.

GOES-1 Visible Imagery from March 1979

GOES-1 Visible Imagery from May 1979

GOES-5 IR Window Channel Imagery from August 1981
View only this post
Read Less


 and GOES-13 (GOES-East) 0.63 µm visible images (click image to play animation)")
 images")


")
")

