The Sensor Processing Subsystem (SPS) for GOES-15 (operational as GOES-West) was changed at 20:45 UTC on March 12, 2012. This change that should have been transparent to the users introduced an error to the calibrated data that was especially apparent in the Imager Water Vapor Channel (Channel 3). The SPS... Read More
")
Color-enhanced GOES-15 Imager Water Vapor Imagery (click image to play animation)
The Sensor Processing Subsystem (SPS) for GOES-15 (operational as GOES-West) was changed at 20:45 UTC on March 12, 2012. This change that should have been transparent to the users introduced an error to the calibrated data that was especially apparent in the Imager Water Vapor Channel (Channel 3). The SPS is used to generate the GVAR data stream. The error was traced to a database issue in the new SPS that included the incorrect coefficients for the conversion to brightness temperature for the on-board blackbody. The blackbody temperature is used as part of the calibration of the IR bands. As a result, water vapor brightness temperatures were about 5% too cool for approximately five days. Other Imager channels were not so dramatically affected and Sounder Channels were not affected.
For example, in the image toggle above, the ‘Before’ image, at 20:30 UTC 12 March, shows the warmest brightness temperatures over the eastern Pacific Ocean west of Baja California. The brightness temperatures in that yellow region cooled by 2 K over those 30 minutes. Similarly, cold brightness temperatures over cirrus shield off the coast of Oregon/California cooled by 1-2 K. (The cold cloud tops over southwest Oregon also cooled, but that cooling is likely influenced by synoptic forcing). In contrast, Sounder data (below), shows little cooling between 20:02 UTC and 21:02 UTC on March 12th 2012. Brightness temperatures in the warm band west of Baja peak near 244.5 K in both images; brightness temperatures in the cirrus shield off the coast of California remain near 218 K (and actually show signs of warming between 2002 and 2102 UTC).
")
Color-enhanced GOES-15 Sounder Water Vapor Imagery (click image to play animation)

Color-enhanced GOES-15 Imager and Sounder Water Vapor Imagery
The four-panel image above also highlights the change in Imager data, and the static nature of the Sounder data. The enhanced Imager data, in the two panels on top, shows less yellow (that is, cooler temperatures) at 2100 UTC vs. 1800 UTC. Sounder data shows very little change over the same three hours.
The change in Brightness temperatures was first brought the attention of NOAA scientists via email from ECMWF. In preparation for the planned routine use of GOES-15 Imager data in the global model at ECMWF (starting in April of 2012), that center is monitoring observed and modeled radiances, and a big change started late in the day on March 12, 2012. This website shows the monitoring over the past three weeks. A similar site that shows how NCEP monitors Satellite Data is here. In addition, NOAA/NESDIS STAR compares GOES Imager observations to observations from high-spectral resolution measurements.
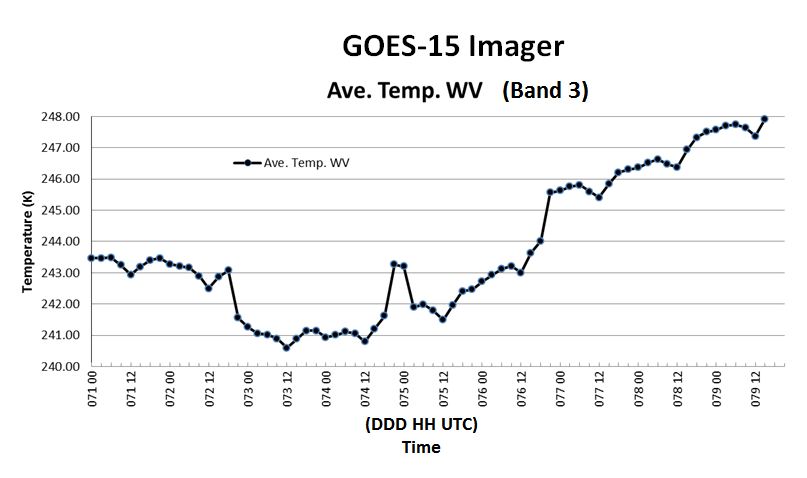
The image above shows GOES Imager Water Vapor Mean brightness temperatures over water from 90 S to 90 N and 110 W to 170 W. Note the big drop in mean temperature late in the day on March 12, and the big increase last in the day on March 16 2012. Comparisons between geo-located GOES-15 and MTSAT Mean Water Vapor Brightness temperatures, below, show good agreement until 2045 UTC on March 12, when the SPS change that accessed incorrect values in a different database was implemented. Database values were checked in a test starting at 21:00 UTC on March 14th until before the 00:52 UTC image on March 15th before the correct database values were used starting again at 2045 UTC on March 16th. (Link). At that time in both graphs, GOES-15 brightness temperatures return to more appropriate values.
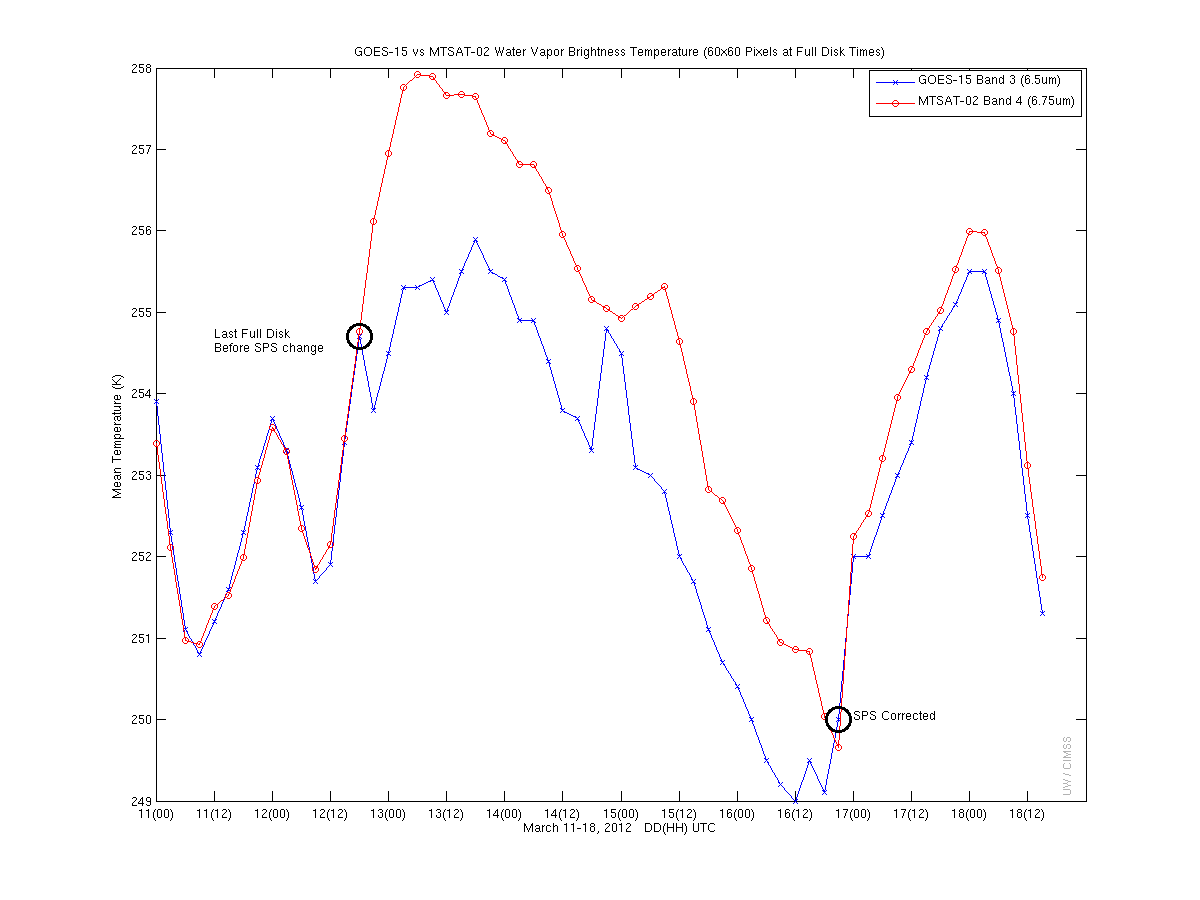
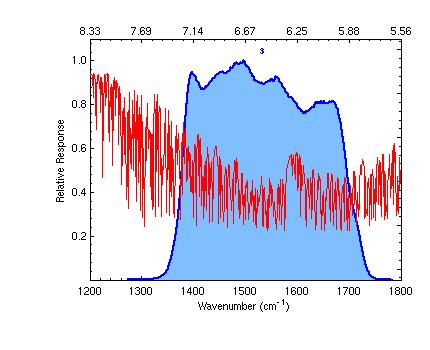
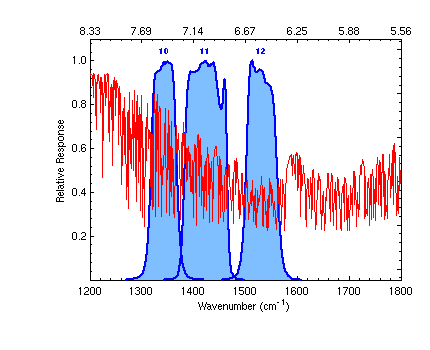
Interpretation of the Sounder vs. Imager water vapor imagery should be colored by the spectral response functions (SRF) of the two instruments. The GOES-15 Imager SRF for water vapor is a broad one centered near 6.5 micrometers. The three GOES-15 Sounder water vapor channel SRFs are much narrower and are centered at 6.5, 7.0 and 7.4 micrometers. In addition, nominal resolution for the GOES-15 imager is 4 kilometers at the sub-satellite point versus something closer to 10 kilometers for the GOES-15 Sounder.
Special thanks to Cristina Lupu at ECMWF for alerting us to this issue.
View only this post
Read Less
")
")
")


")
")
