The “cutoff low” system that had been slowly moving across the country for the past week spawned heavy rains which caused flooding in parts of the New York City (NYC) metropolitan area on the morning of 08 May 2013. The... Read More
")
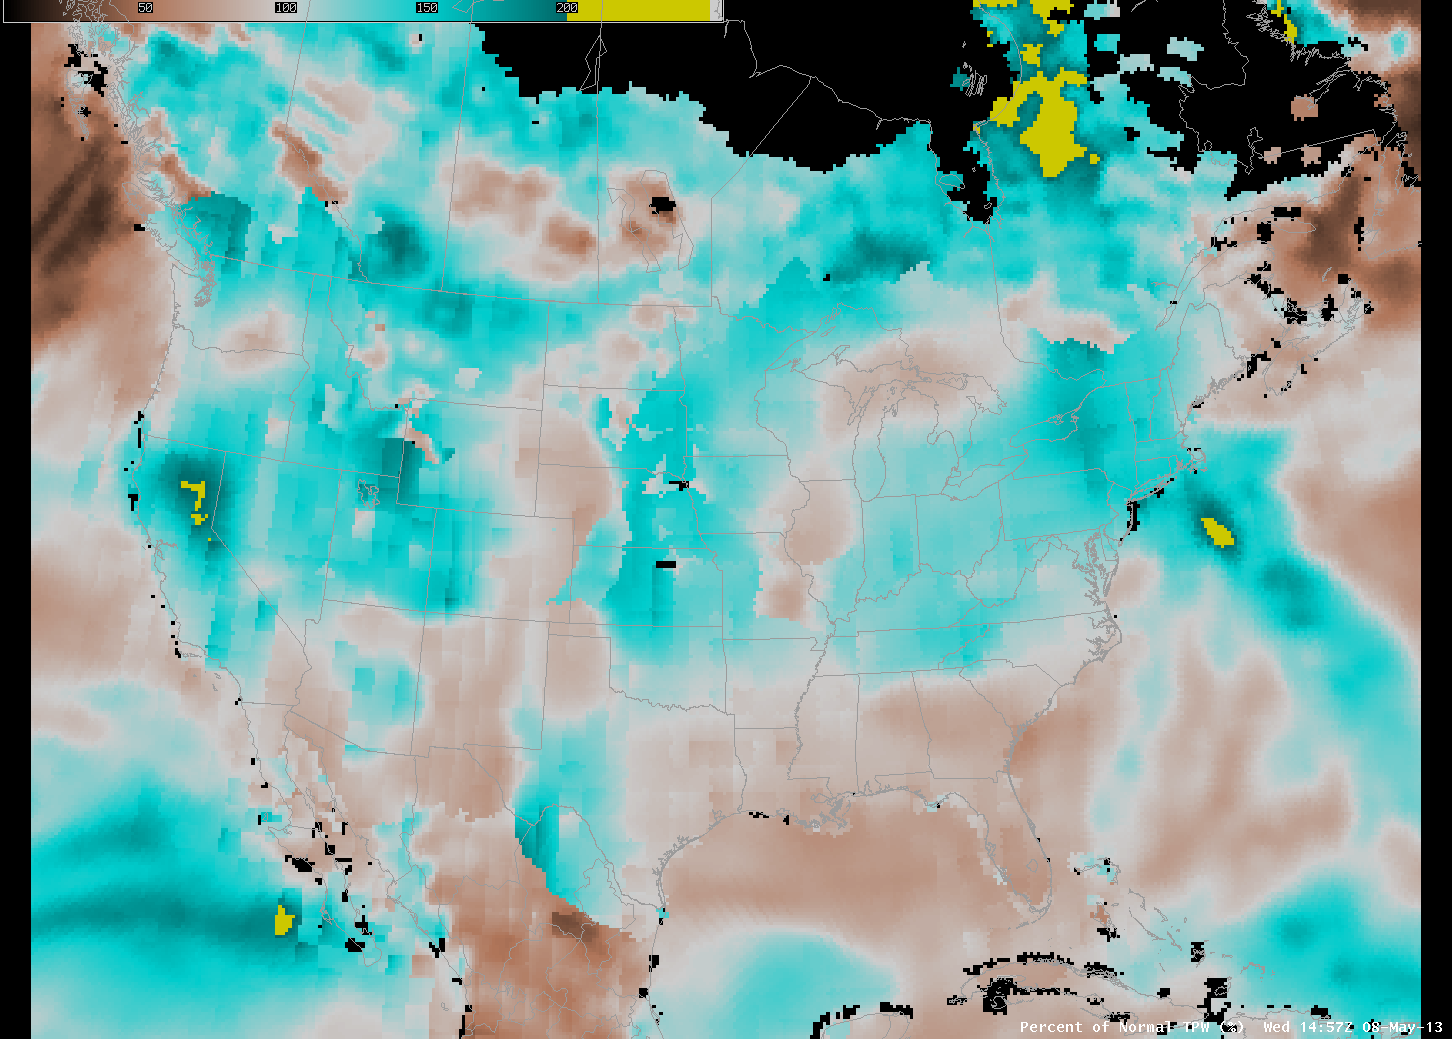
Morphed Total Precipitable Water (click image to play animation)
The “cutoff low” system that had been slowly moving across the country for the past week spawned heavy rains which caused flooding in parts of the New York City (NYC) metropolitan area on the morning of 08 May 2013. The image above, of MIMIC Total Precipitable Water, showed a plume of moisture-rich air moving northwestward from the tropical Atlantic towards New York (in advance of the surface frontal system associated with the cutoff low). This region of enhanced precipitable water was seen on the previous day as well. The blended Total Precipitable Water Product (as described here) also showed a plume of higher-than-normal precipitable water air moving over New York City — values of 170+% of normal are over New York City, with a value exceeding 200% (in yellow) sits over the Atlantic Ocean.
")
GOES-13 6.5 µm water vapor imagery (click image to play animation)
High values of Total Precipitable Water were being been entrained by the circulation of the upper-level low, as shown in the animation of GOES-13 water vapor channel images above. The cyclonic circulation had drawn the moisture north and west into the NYC metropolitan region, and convection developing in the cyclonic flow was responsible for the heavy rainfall. A Suomi/NPP VIIRS 11.45 µm IR image, below, overlain with model-based 500-mb geopotential height fields, showed the strong convection and the cyclonic flow moving into New York. It is interesting to note that the southern tail end of the convection sat right over the Gulf Stream.

Suomi/NPP VIIRS 11.45 µm imagery
The GOES-13 satellite had been placed into Rapid Scan Operations (RSO) mode, providing images as frequently as every 5-10 minutes. Discrete convective cells with cloud-top IR brightness temperatures colder than -60º C (darker red color enhancement) can be seen developing and moving northwestward over the NYC area on 4-km resolution GOES-13 10.7 µm IR channel images (below).
")
GOES-13 10.7 µm IR channel images (click image to play animation)
A closer view using 1-km resolution POES AVHRR 0.63 µm visible channel and 10.8 µm IR channel images at 10:09 UTC or 6:09 AM local time (below) revealed the texture and shadowing of overshooting tops on the visible image, with cloud-top IR brightness temperature values as cold as -67º C (dark red color enhancement).
POES AVHRR 0.64 µm visible channel and 10.8 µm IR channel images
GOES-13 0.63 µm visible channel imagery (below) showed the different bands of convection that developed offshore and moved inland across the NYC metropolitan area.
 during the day on May 8th (click image to play animation)")
GOES-13 Visible Imagery (0.63 µm) (click image to play animation)
View only this post
Read Less
")

")
")
")
 during the day on May 8th (click image to play animation)")
")
")


