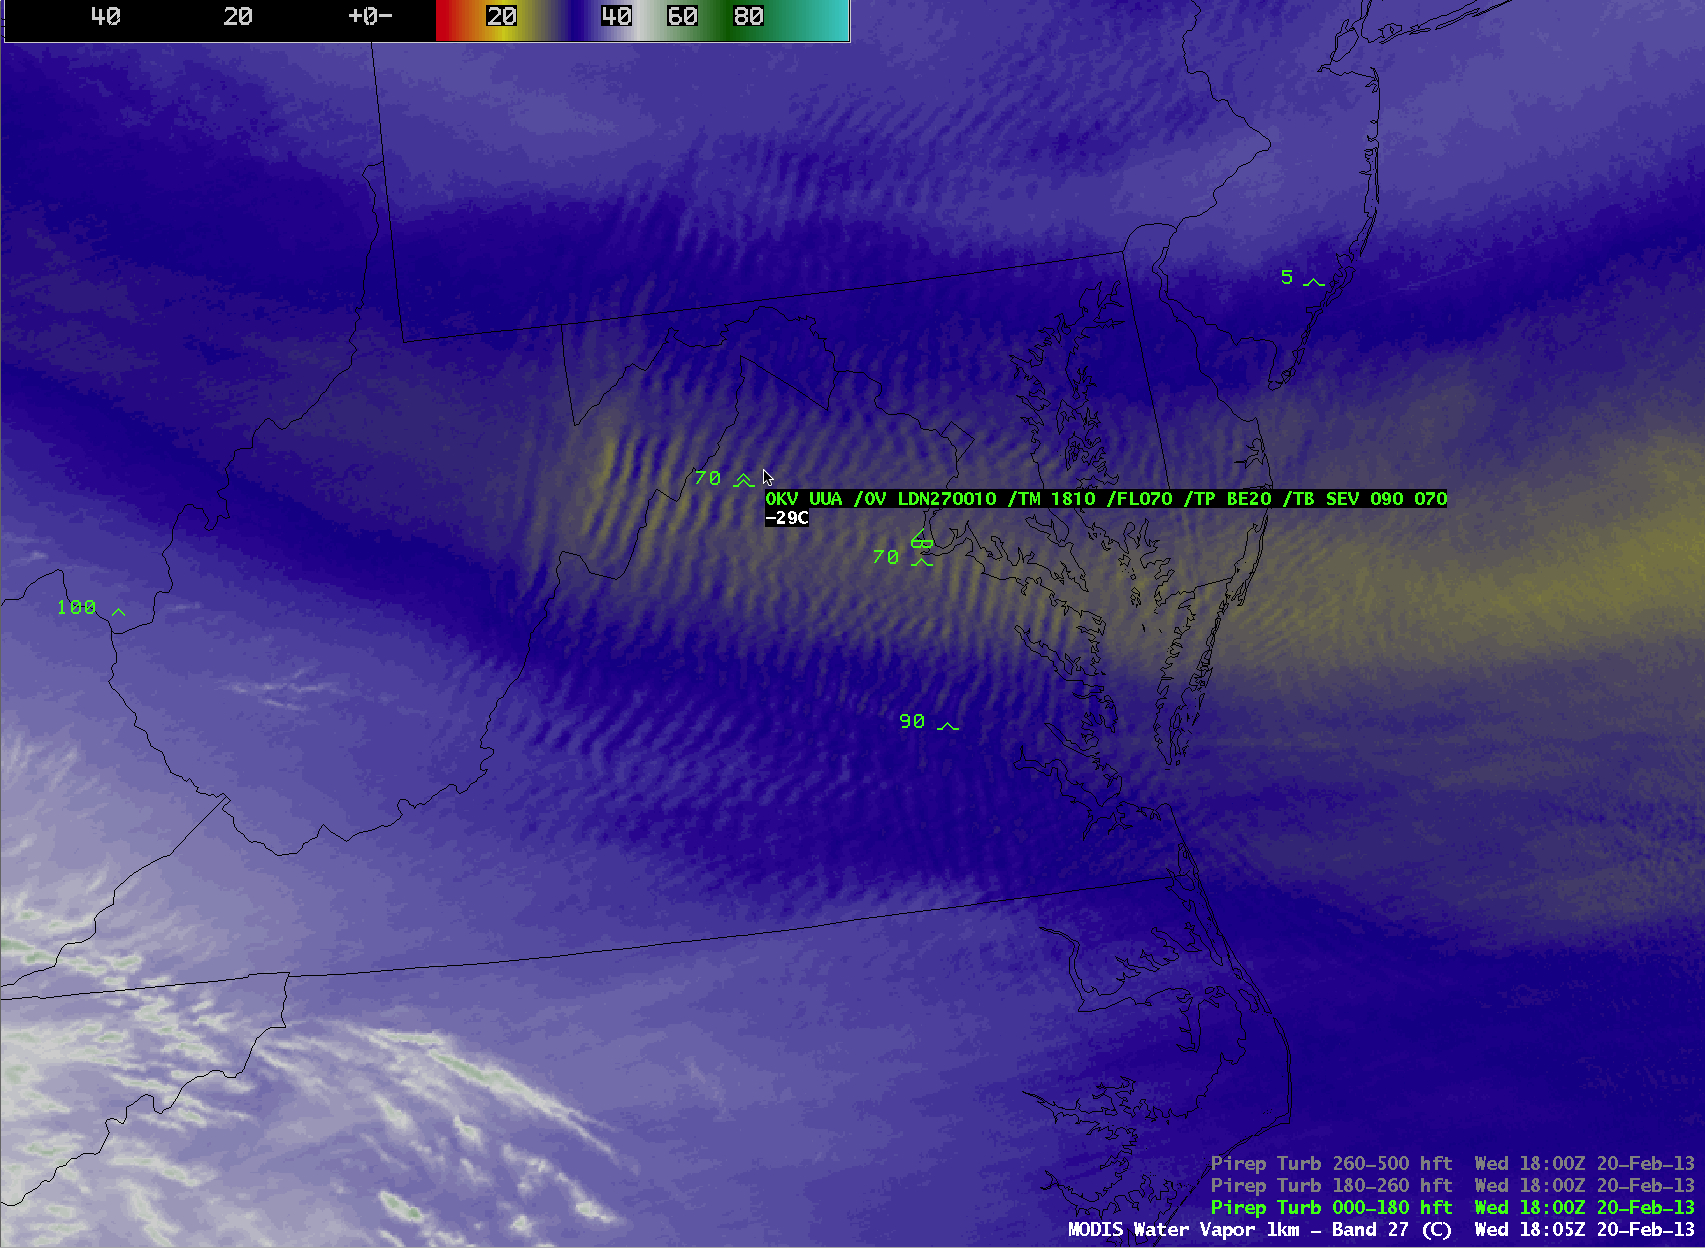
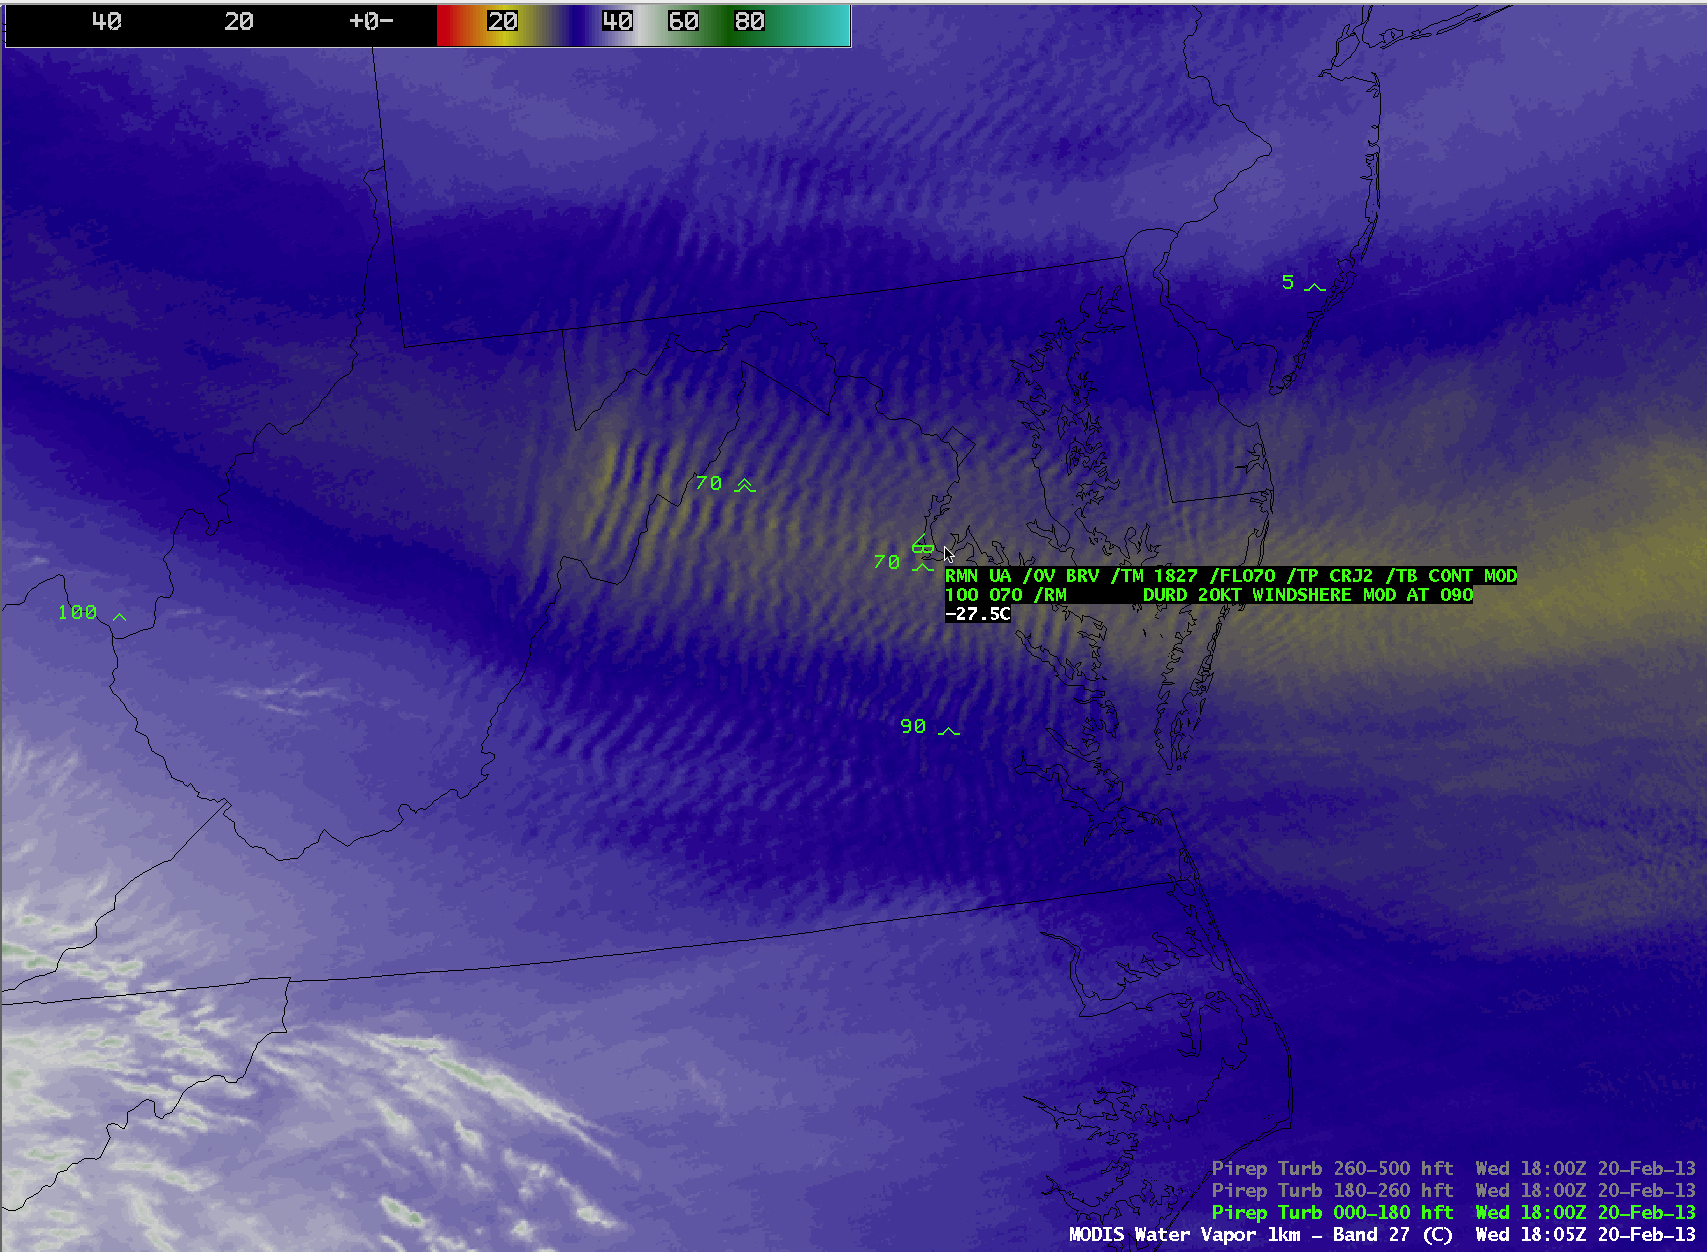
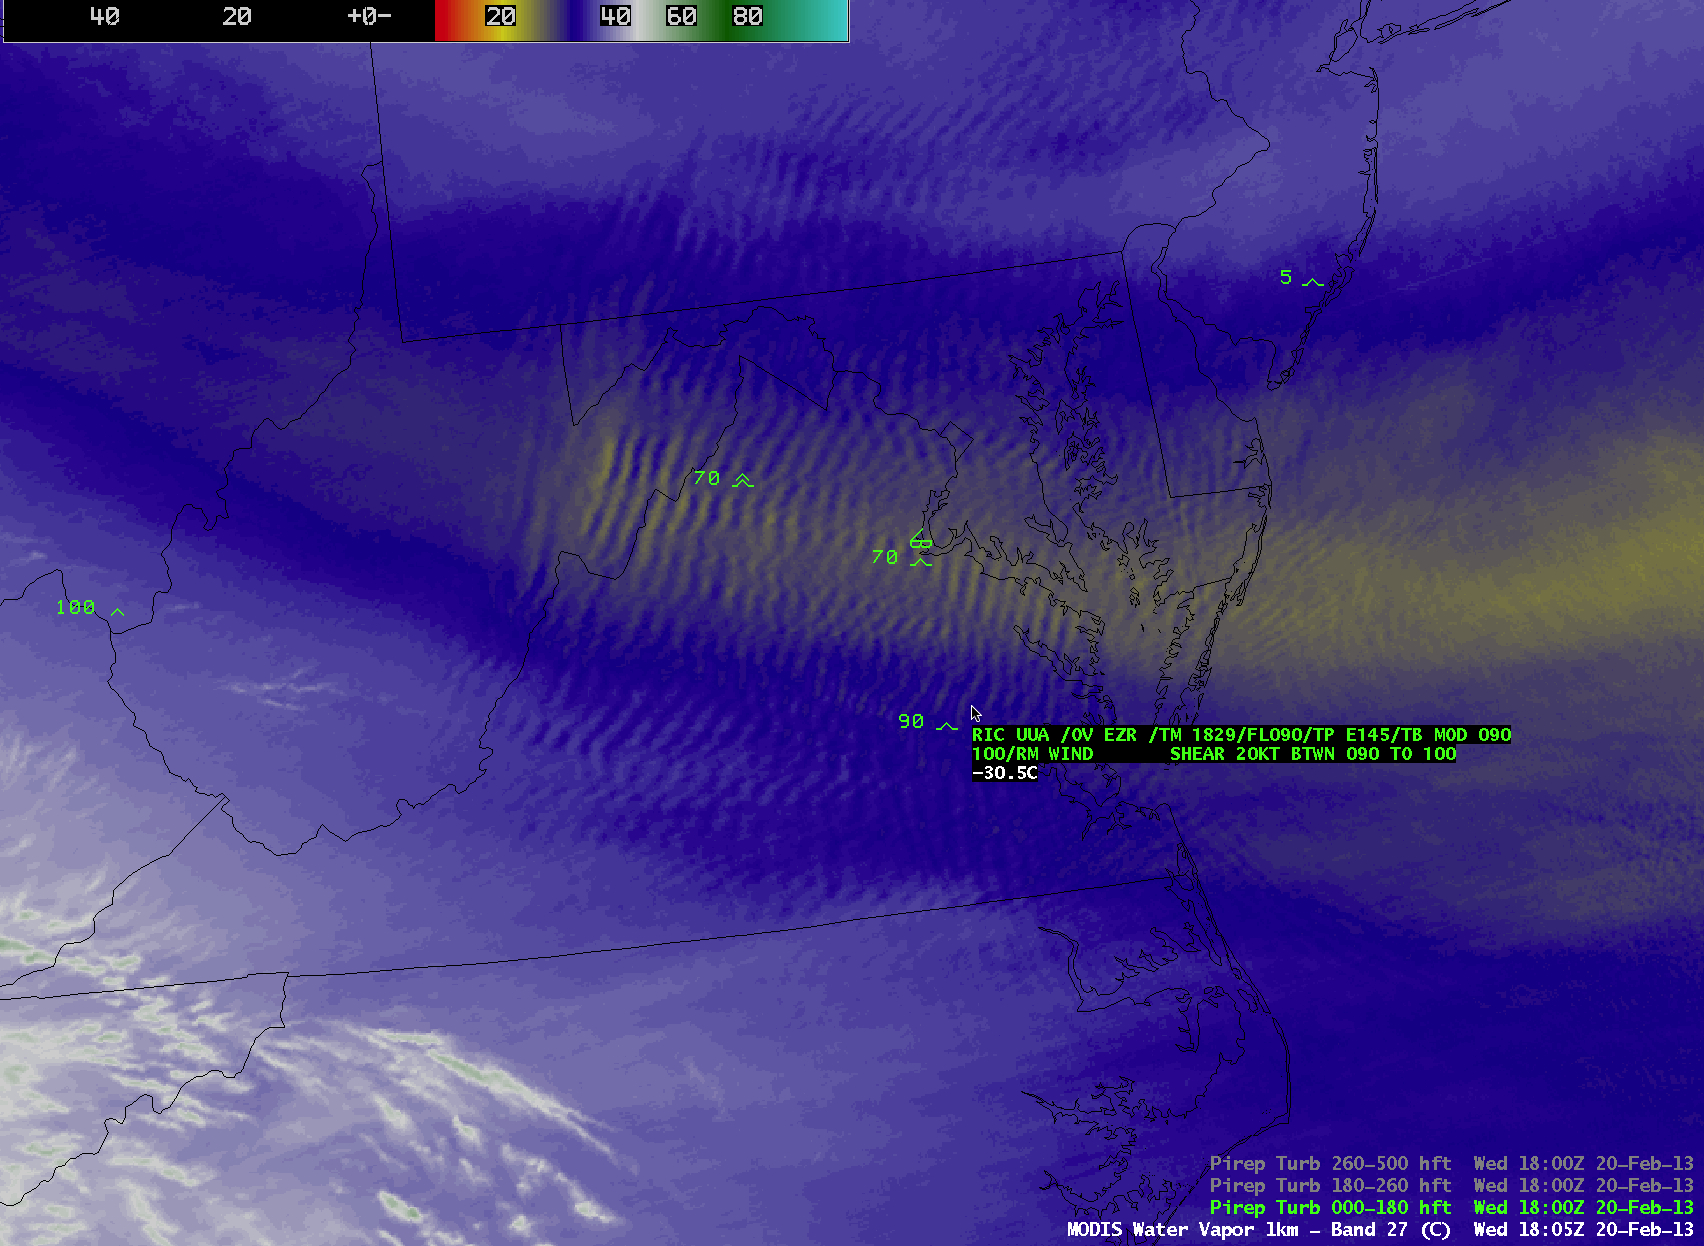
MODIS 0.65 µm visible channel and 6.7 µm water vapor channel images
A comparison of AWIPS images of 1-km resolution MODIS 0.65 µm visible channel and 6.7 µm water vapor channel data (above) revealed the presence of widespread mountain waves across parts of the Mid-Atlantic states on 20 February 2013. Parallel bands of rotor clouds helped to identify the location of these waves (caused by strong northwesterly winds interacting with the terrain of the Appalachian Mountains) where ample moisture was present, but in many areas the atmosphere at that altitude was too dry to support rotor cloud development — this demonstrated the advantage that water vapor imagery has in helping to know the total areal coverage of such mountain wave activity.
Mountain waves can be an aviation hazard, since they are capable of generating turbulence. Plots o pilot reports of turbulence within +/- 30 minutes of the MODIS overpass time indicated that there was one report of severe turbulence in the 7000-9000 foot altitude range over extreme northwestern Virginia, along with moderate turbulence likely associated with rotor circulation wind shear in northern Virginia and southern Virginia. In addition, there was a report of moderate clear air turbulence at 36,000 feet over eastern Chesapeake Bay, suggesting that these mountain waves might be vertically propagating.
View only this post Read Less
")

")

")
")
