 and 3.9 µm shortwave IR channel (bottom) images (click to play animation)")
GOES-13 0.63 µm visible channel (top) and 3.9 µm shortwave IR channel (bottom) images (click to play animation)
McIDAS images of GOES-13 0.63 µm visible channel and 3.9 µm shortwave IR channel data (above; click image to play animation) showed the large smoke plumes and fire “hot spots” (dark black pixels on the shortwave IR imagery) associated with the Germann Road Fire in northwestern Wisconsin and the Green Valley Fire in Minnesota on 14 May 2013. The Germann Road Fire burned 8495 acres, making it the largest wildfire in northern Wisconsin in 33 years. In Minnesota, the Green Valley fire burned 7100 acres.
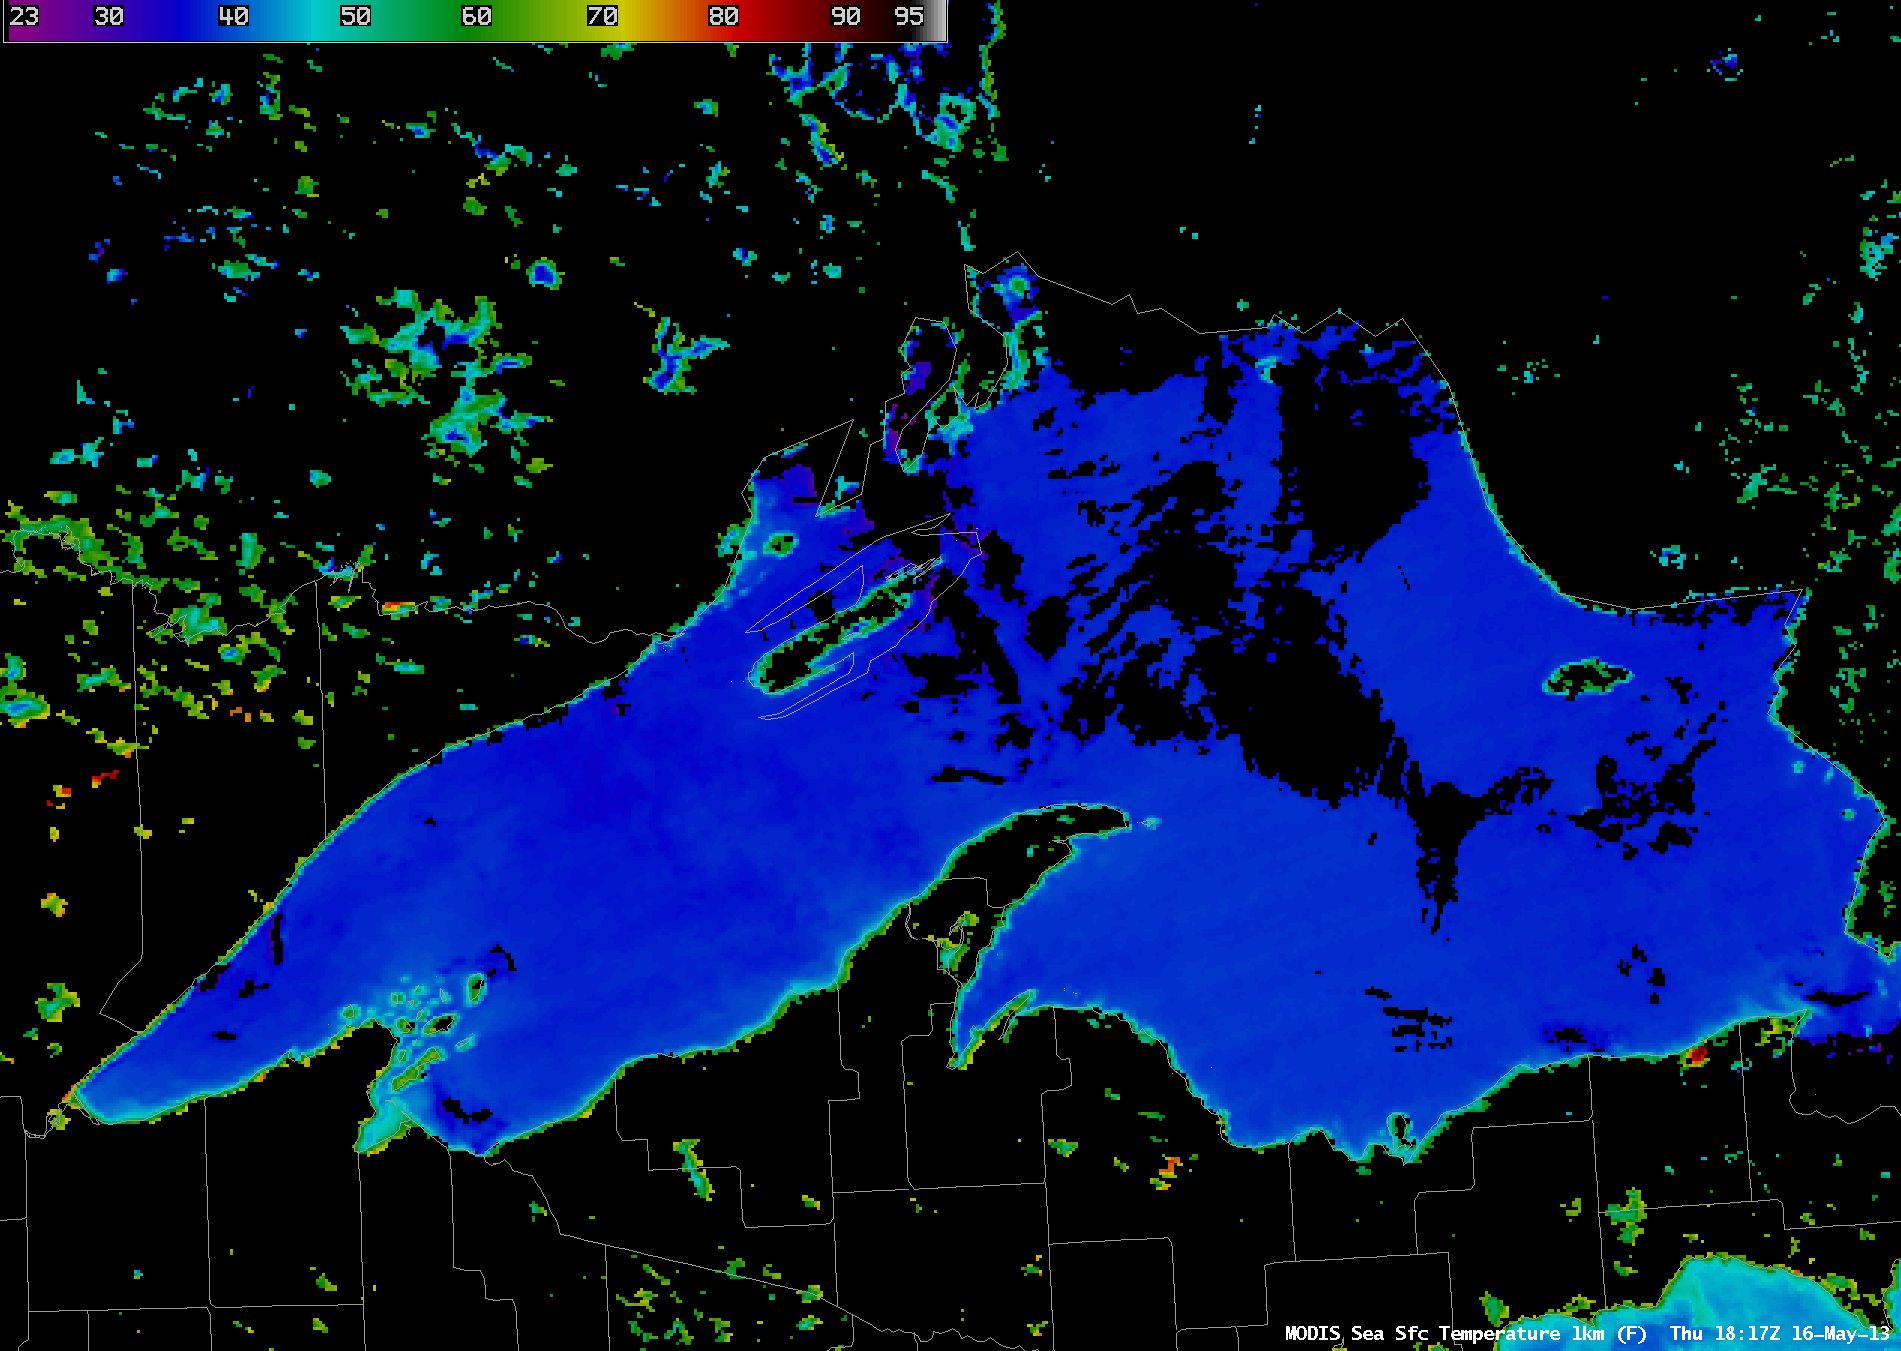
Items of interest to note on the GOES-13 imagery: (1) the presence of a well-defined lake breeze (lighter gray color enhancement on the IR images) which extended quite a distance inland from the colder waters of Lake Superior (which still exhibited Sea Surface Temperature values in the middle to upper 30s F); (2) the change in wind direction from southwesterly to westerly/northwesterly as a frontal boundary moved eastward across the region; (3) the apparent “flare-up” of the Germann Road Fire as the frontal boundary arrived around 00:45 UTC — the size of the cluster of black “hot spot” pixels increased on the shortwave IR image, concurrent with the rapid growth of an area of pyrocumulus clouds; (4) the eastward motion of the thin lake ice that remained on Mille Lacs in Minnesota (the large lake just south of the Green Valley smoke plume).
2 days after the fire, the burn scar was apparent on an Aqua MODIS false-color Red/Green/Blue (RGB) image (below), viewed using the SSEC Web Map Server. Note the “right turn”on the northern end of the burn scar, caused by a change from southwesterly winds to strong westerly winds in the wake of a frontal passage (which altered the direction of the fire’s progress).

Aqua MODIS false-color image showing wildfire location and burn scar
View only this post Read Less
")

")
")

")
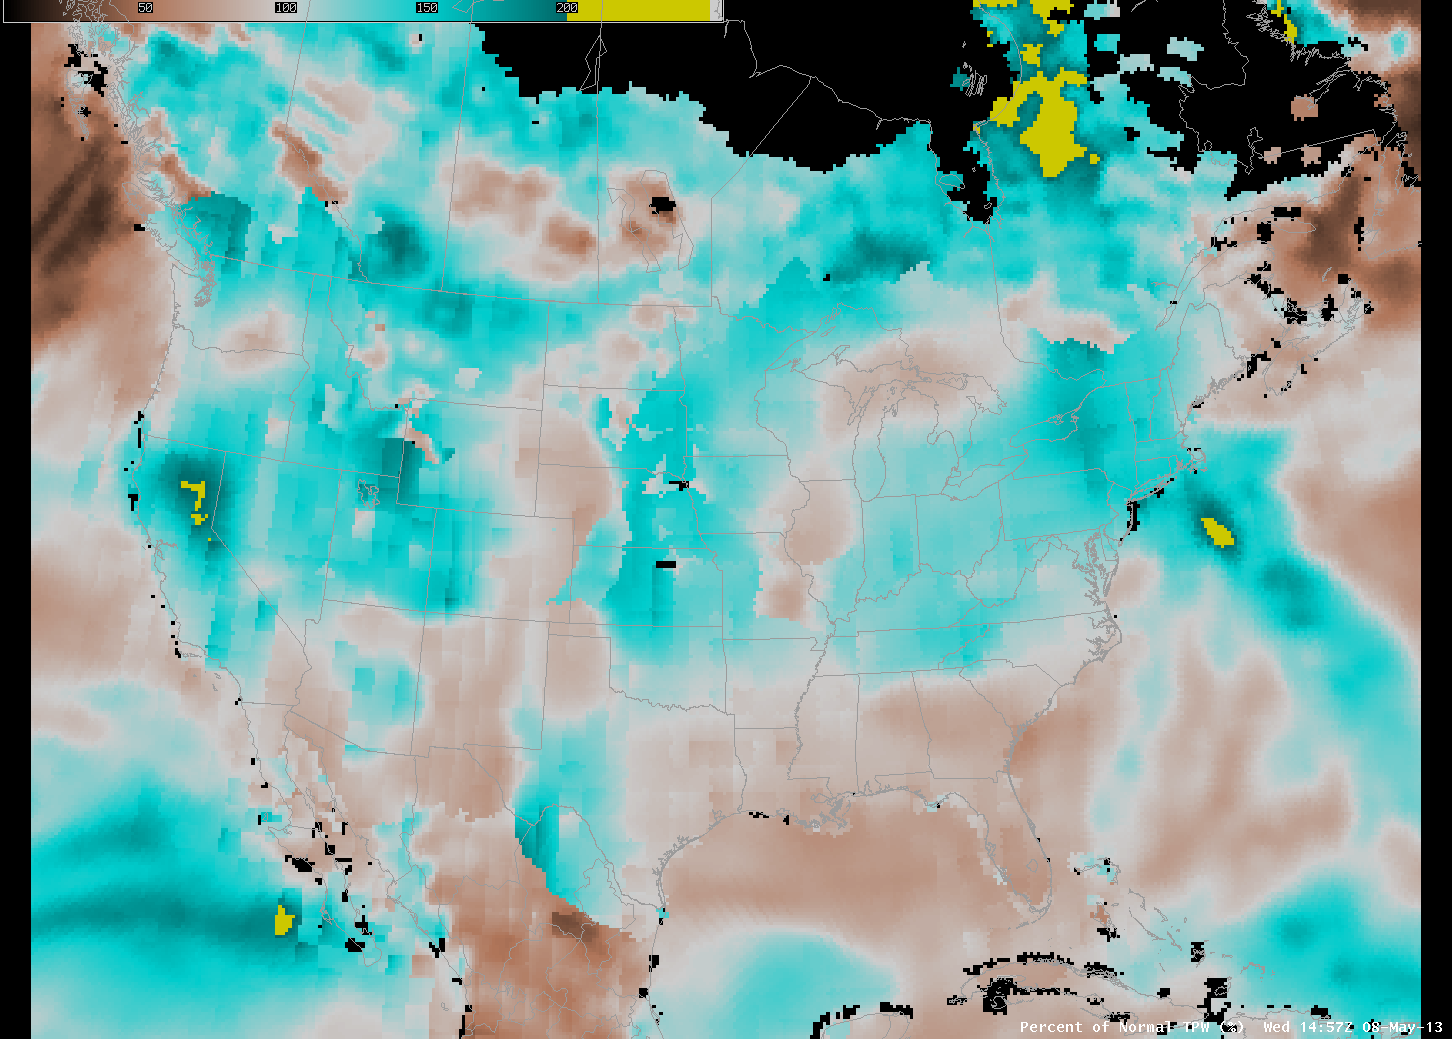
 during the day on May 8th (click image to play animation)")
")
")
