This website works best with a newer web browser such as Chrome, Firefox, Safari or Microsoft Edge. Internet Explorer is not supported by this website.

Summer Solstice in Alaska

GOES-15 (GOES-West) 0.63 µm visible channel images (above; click image to play animation) showed the cloud features over much of Alaska on 21 June 2013 (the day of the summer solstice). Record heat had been occurring across much of Alaska during the previous week, and Barrow (BRW) had a daily... Read More

GOES-15 0.63 µm visible channel images (click image to play animation)

GOES-15 0.63 µm visible channel images (click image to play animation)

GOES-15 (GOES-West) 0.63 µm visible channel images (above; click image to play animation) showed the cloud features over much of Alaska on 21 June 2013 (the day of the summer solstice). Record heat had been occurring across much of Alaska during the previous week, and Barrow (BRW) had a daily record high temperature of 62 F on 20 June. Note that there were numerous thunderstorms that developed over the Brooks Range and even over the North Slope regions of Alaska — on 20 June, over 4000 cloud-to-ground lightning strikes were detected. The haziness seen early in the animation was due to widespread smoke from wildfires that had been burning in southwestern Alaska a few days earlier.

View only this post Read Less

West Fork and East Park fires in southern Colorado

Two large fires burning in southern Colorado began to produce pyrocumulonimbus clouds and very large smoke plumes, as seen on GOES-13 0.63 µm visible channel (top panels) and 3.9 µm shortwave IR images (bottom panels)  on 19 June (above; click image to play... Read More

GOES-13 0.63 µm visible channel and 3.9 µm shortwave IR channel images (click image to play animation)

Two large fires burning in southern Colorado began to produce pyrocumulonimbus clouds and very large smoke plumes, as seen on GOES-13 0.63 µm visible channel (top panels) and 3.9 µm shortwave IR images (bottom panels)  on 19 June (above; click image to play animation) and on 20 June 2012 (below; click image to play animation). The larger fire on the left is the West Fork Complex, while the smaller fire on the right is the East Park fire.

GOES-13 0.63 µm visible channel and 3.9 µm shortwave IR channel images (click image to play animation)

A comparison of AWIPS images of POES AVHRR 0.86 µm visible channel, Cloud Top Temperature (CTT) product, and Cloud Top Height (CTH) product at 21:25 UTC (below) showed that CTT values just downstream of the fire source were as cold as -60 C (darker red color enhancement), where CTH values were as high as 12 km (darker green color enhancement).

POES AVHRR visible channel image, Cloud Top Temperature product, and Cloud Top Height product

POES AVHRR visible channel image, Cloud Top Temperature product, and Cloud Top Height product

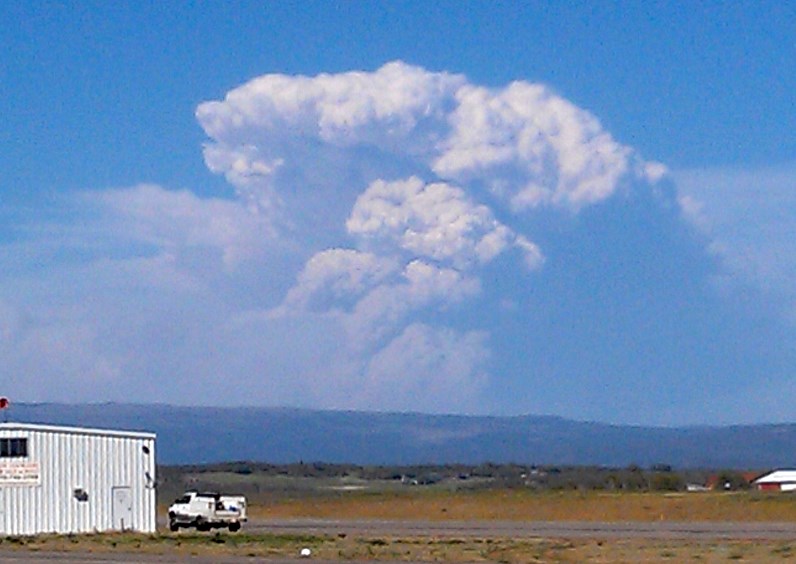
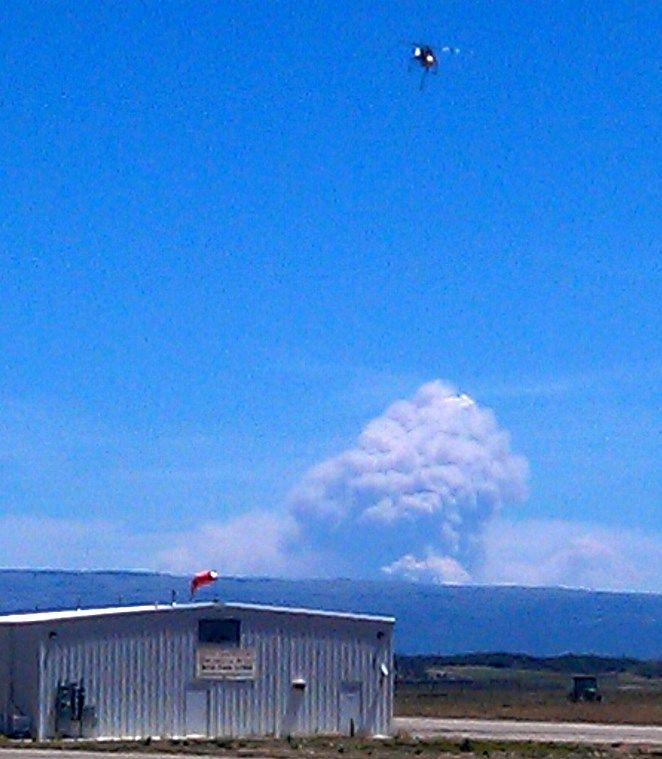
Some photos of the West Fork Complex pyrocumulonimbus clouds are shown below, from the Wildfire Today site.

Photo of West Fork Complex fire

Photo of West Fork Complex fire

 ===== 21 June Update =====

GOES-15 (left panels) and GOES-13 (right panels) visible and shortwave IR channel  images (click image to play animation)

The West Fork fire complex continued to burn at an explosive rate on 21 June — a comparison of GOES-15 (left panels) and GOES-13 (right panels) 0.63 µm visible channel and 3.9 µm shortwave IR channel images ((above; click image to play animation) showed two very large smoke plumes with pyrocumulonimbus (pyroCb) clouds forming near the source of the fires.

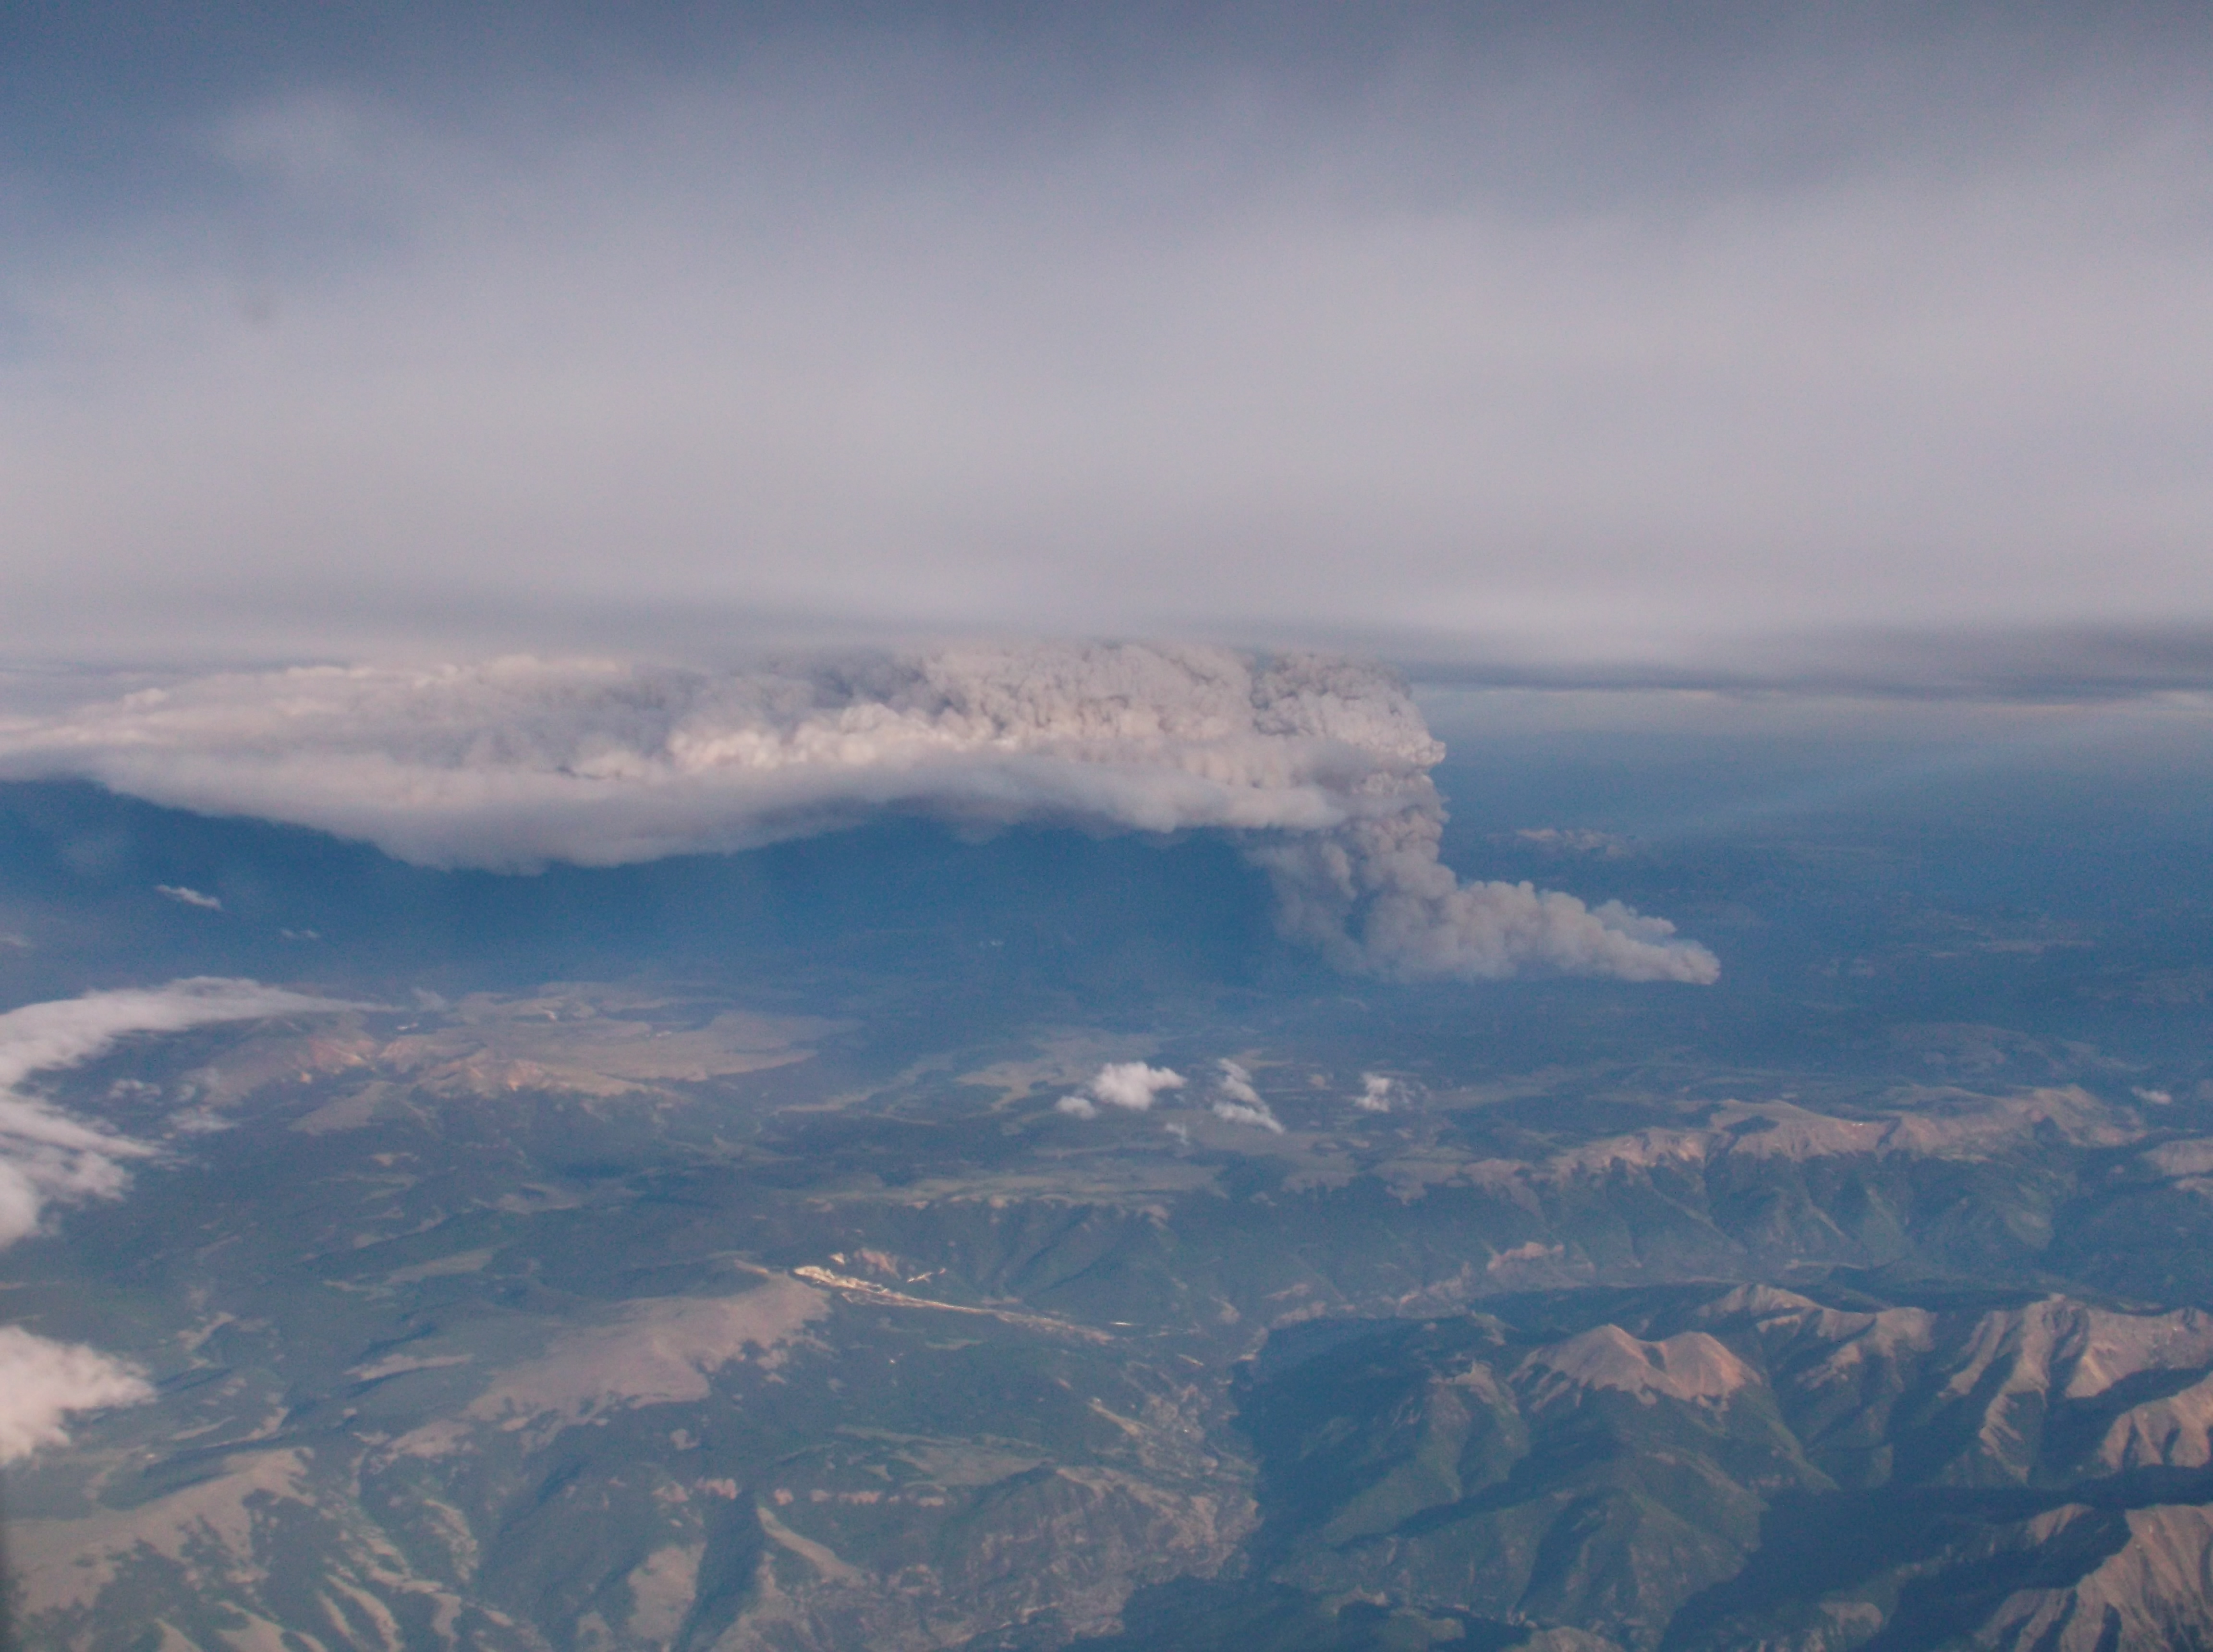
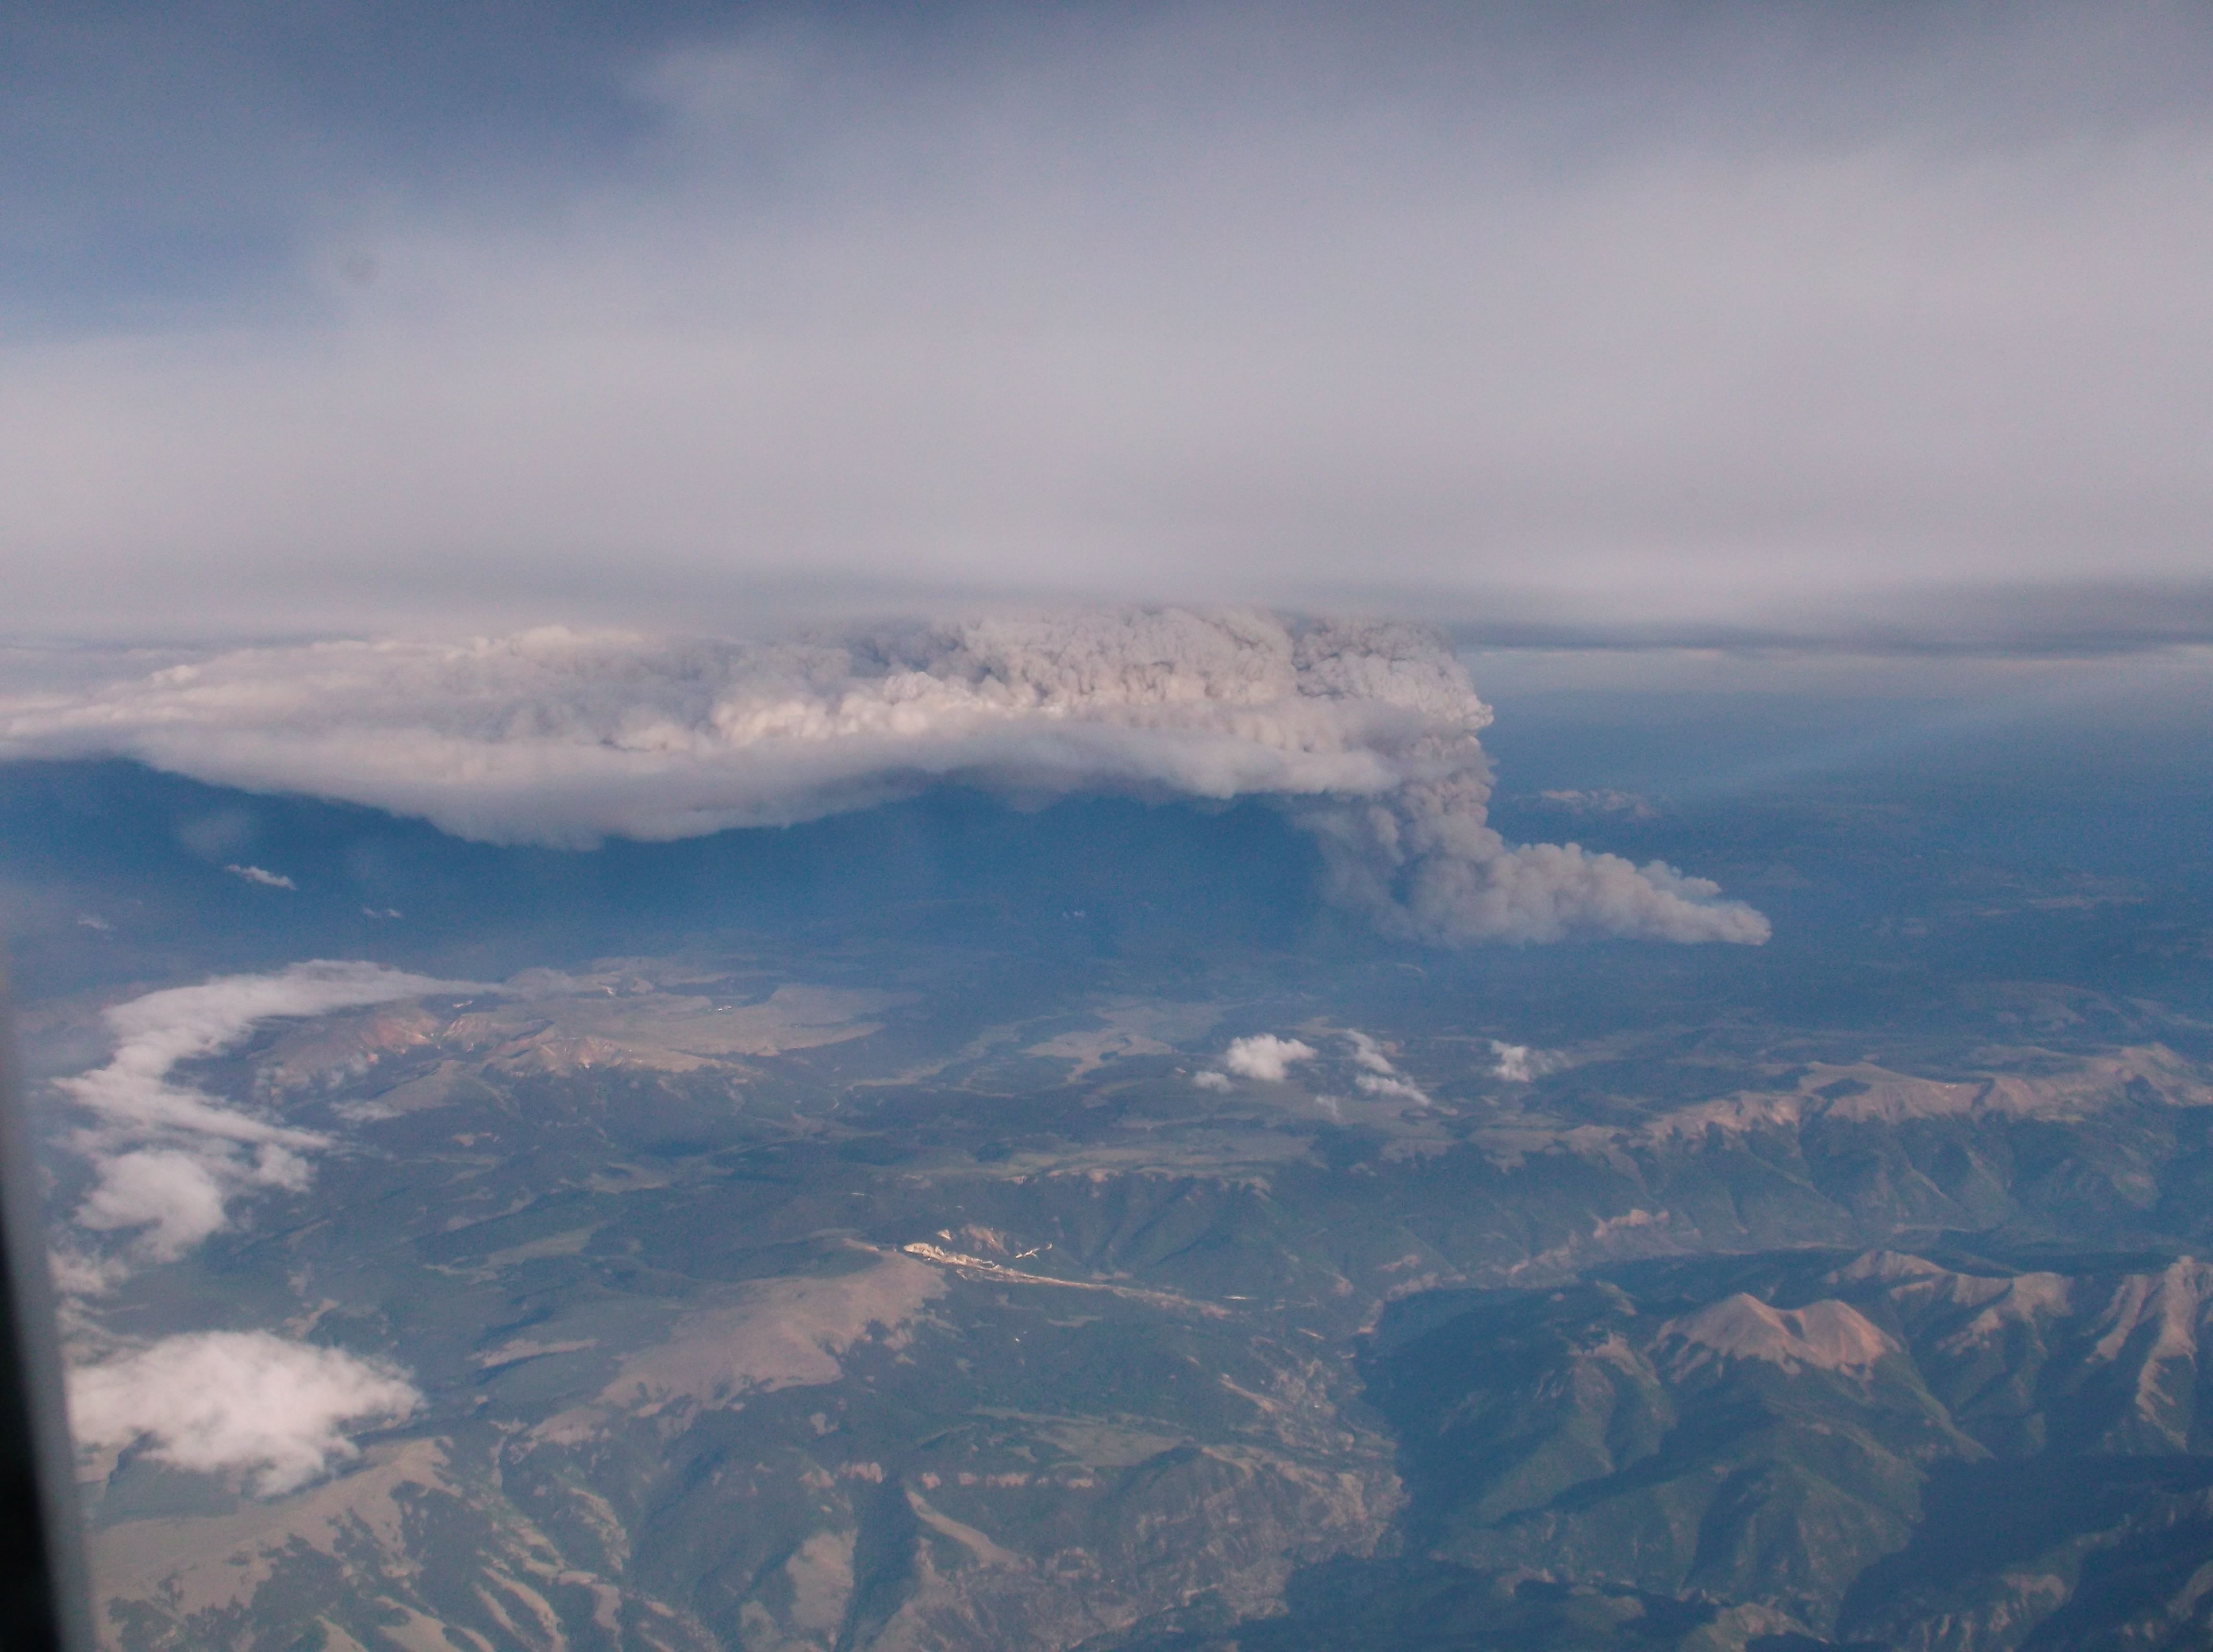
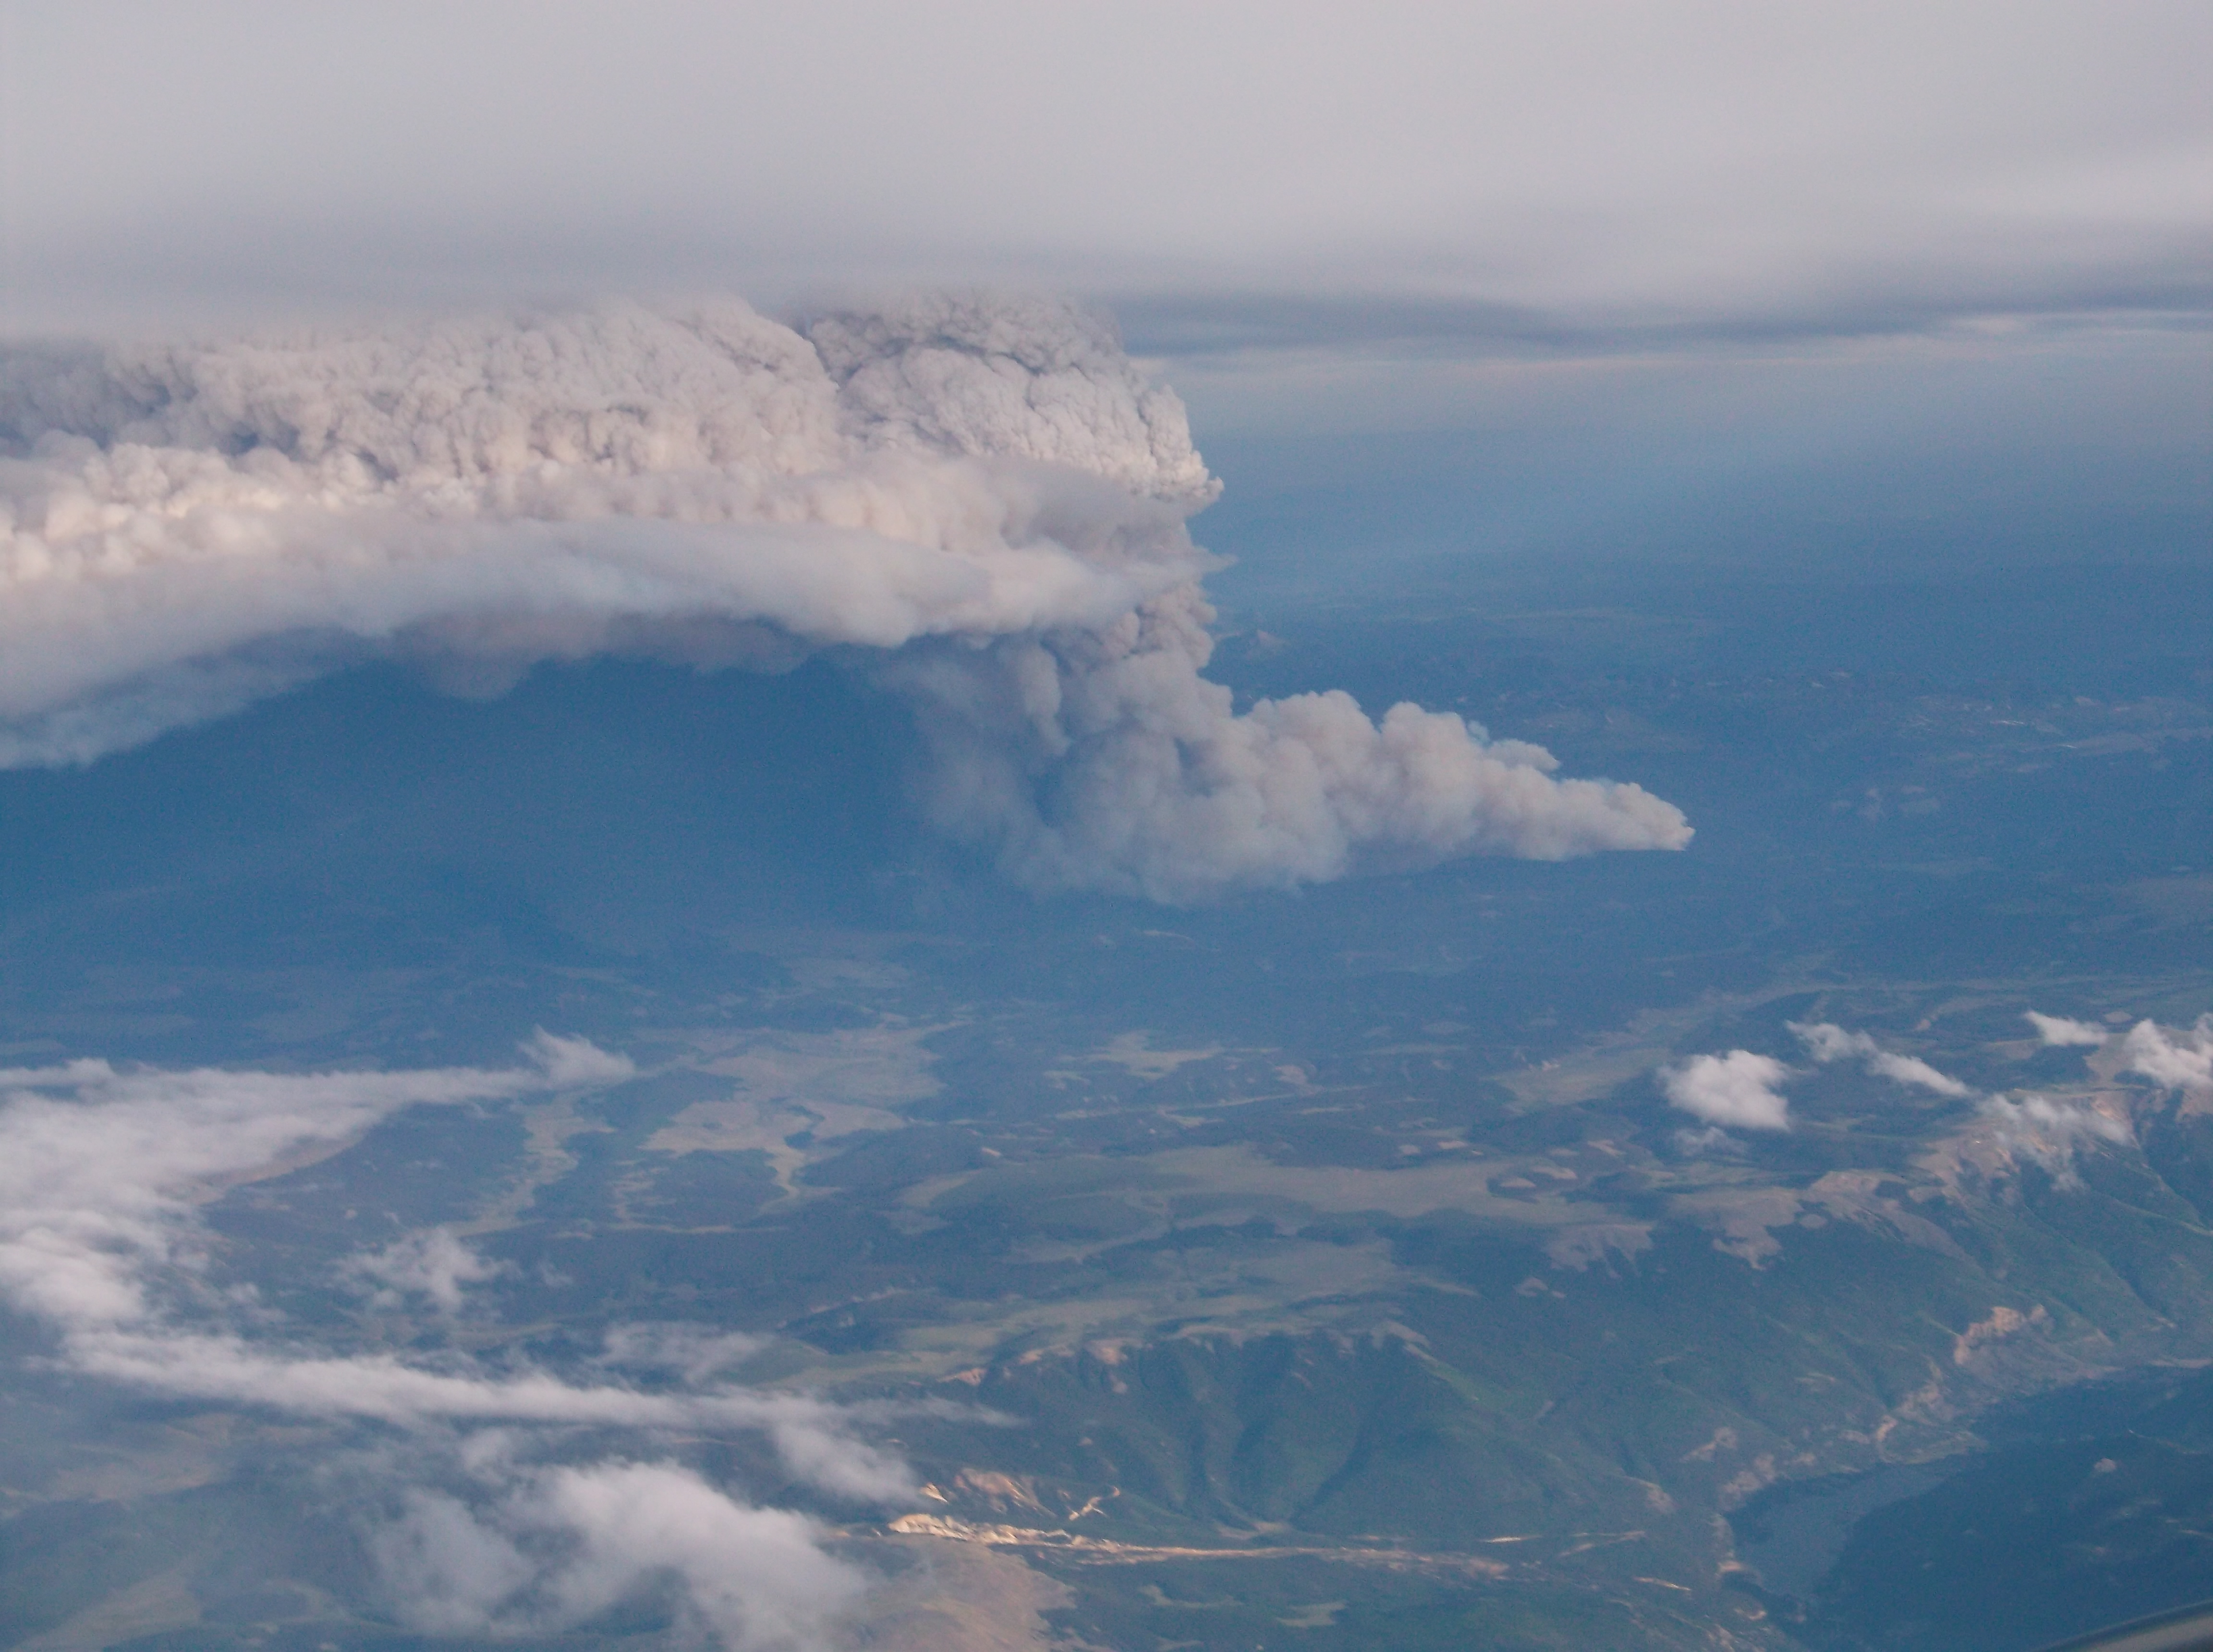
A layer of high cirrus clouds began to move over the fire region later in the afternoon and early evening (01 UTC satellite images), masking the view of the pyroCb clouds and smoke plumes; however, the fire “hot spots” (red enhanced pixels) could still be sensed through the veil of high clouds. At around 01:04 UTC, a fantastic photo (photo 2 | photo 3 | photo 4) of the fire was taken by Luis Rosa (NWS San Juan Puerto Rico) from a passenger aircraft flying at 35,000 feet which showed the northernmost pyroCb cloud — likely the Papoose Fire –  beneath the cirrus cloud layer (below).

Aerial view of pyrocumulonimbus cloud associated with the West Fork Fire Complex

Aerial view of pyrocumulonimbus cloud associated with the West Fork Fire Complex

View only this post Read Less

Tornado at Denver International Airport

A tornado touched down just east of the Denver International Airport concourses at 20:21 UTC on 18 June 2013, producing a peak wind gust of 97 mph (before the wind instrumentation stopped transmitting data).  AWIPS images of Suomi NPP VIIRS 0.64 µm visible... Read More

Suomi NPP VIIRS 0.64 um visible image and 11.45 um IR channel image (with overlay of METAR surface reports)

Suomi NPP VIIRS 0.64 um visible image and 11.45 um IR channel image (with overlay of METAR surface reports)

A tornado touched down just east of the Denver International Airport concourses at 20:21 UTC on 18 June 2013, producing a peak wind gust of 97 mph (before the wind instrumentation stopped transmitting data).  AWIPS images of Suomi NPP VIIRS 0.64 µm visible channel and 11.45 µm IR channel data at 20:03 UTC (above) showed the storm about 20 minutes before it produced the tornado. The minimum cloud-top IR brightness temperature was -68º C (darker red color enhancement), which was significantly colder that the tropopause temperature of -56º C on the 12 UTC Denver rawinsonde data.

The corresponding Suomi NPP VIIRS true-color Red/Green/Blue (RGB) image (viewed using the SSEC Web Map Server) is shown below.

Suomi NPP VIIRS true-color Red/Green/Blue (RGB) image

Suomi NPP VIIRS true-color Red/Green/Blue (RGB) image

The series of METAR surface reports from Denver (KDEN) during the period from 20:20 to 20:37 UTC:

KDEN 182037Z 09026KT 9SM -TSRA FEW050 BKN080CB BKN180 24/04 A3002 RMK FUNNEL CLOUD B18 FUNNEL CLOUD E20 TORNADO B21 TORNADO E36 AO2 LTG DSNT NE-S RAB03 TORNADO 2 SE MOV N P0005
KDEN 182032Z 09026KT 7SM +FC -TSRA FEW050 BKN080CB BKN180 22/08 A3001 RMK FUNNEL CLOUD B18 FUNNEL CLOUD E20 TORNADO B21 AO2 LTG DSNT NE-S RAB03 TORNADO 2 SE MOV N P0005
KDEN 182022Z 06021G28KT 5SM +FC TSRA FEW050 BKN080CB BKN180 21/07 A3002 RMK FUNNEL CLOUD B18 FUNNEL CLOUD E20 TORNADO B21 AO2 PK WND 07028/2020 LTG DSNT E-S RAB03 OCNL LTGICCG VC E TS OHD MOV E VIRGA SW P0005
KDEN 182021Z 06022G28KT 5SM +FC TSRA FEW050 BKN080CB BKN180 21/06 A3003 RMK FUNNEL CLOUD B18 FUNNEL CLOUD E20 TORNADO B21 AO2 PK WND 07028/2020 LTG DSNT E-S RAB03 OCNL LTGICCG VC E TS OHD MOV E VIRGA SW P0005
KDEN 182020Z 07020G28KT 5SM FC +TSRA FEW050 BKN080CB BKN180 21/07 A3003 RMK FUNNEL CLOUD B18 AO2 PK WND 07028/2020 LTG DSNT E-S RAB03 OCNL LTGICCG VC E TS OHD MOV E VIRGA SW P000

McIDAS images of GOES-13 0.63 µm visible channel data (below; click image to play animation) showed the development of the thunderstorms over the region

GOES-15 0.63 µm visible channel images (click image to play animation)

GOES-15 0.63 µm visible channel images (click image to play animation)

View only this post Read Less

Uncharacteristically cloud-free and warm across interior Alaska

McIDAS images of GOES-15 0.63 µm visible channel data (above; click image to play animation) revealed an uncharacteristically cloud-free view of most of the interior of Alaska on 17 June 2013. A large blocking ridge of high... Read More

GOES-15 0.63 µm visible channel images (click image to play animation)

GOES-15 0.63 µm visible channel images (click image to play animation)

McIDAS images of GOES-15 0.63 µm visible channel data (above; click image to play animation) revealed an uncharacteristically cloud-free view of most of the interior of Alaska on 17 June 2013. A large blocking ridge of high pressure had been building across the region, which helped to set the stage for record high temperatures at a number of locations — on 16 June many sites reported daily maximum temperatures in the middle to upper 80s F, with a few sites hitting the 90º F mark (regional temperatures and precipitation). In south-central Alaska, several locations set all-time record highs on 17 June.

On the previous day, a comparison of AWIPS images of Suomi NPP VIIRS 0.64 µm visible channel and 3.74 µm shortwave IR data (below) showed that the Alaska fire season was well underway, with a number of fire “hot spots” (black to yellow to red color enhancement) appearing on the shortwave IR image; some of these larger fires were producing smoke plumes that could be seen on the visible image. Again, note the unusually warm tempertures at many of the reporting sites. Smoke plumes from a couple of the larger fires could also be seen in southwestern and southeastern Alaska on the animation of GOES-15 visible images above. Closer views of pyrocumulonimbus clouds associated with the largest fires can be seen here.

Suomi NPP VIIRS 0.64 µm visible channel and 3.74 µm shortwave IR channel images

Suomi NPP VIIRS 0.64 µm visible channel and 3.74 µm shortwave IR channel images

View only this post Read Less