According to the Alaska Volcano Observatory, an eruption of the Pavlof Volcano began around 01:50 UTC on 13 November 2014. A comparison of nighttime images of Suomi NPP VIIRS 0.7 µm Day/Night Band (DNB) and 3.74 µm shortwave IR data at 13:07 UTC... Read More
Suomi NPP VIIRS 0.7 µm Day/Night Band and 3.74 µm shortwave IR images
According to the Alaska Volcano Observatory, an eruption of the Pavlof Volcano began around 01:50 UTC on 13 November 2014. A comparison of nighttime images of Suomi NPP VIIRS 0.7 µm Day/Night Band (DNB) and 3.74 µm shortwave IR data at 13:07 UTC or 4:07 am local time on 14 November (above) showed the bright glow of the eruption on the DNB image, with the hottest pixel being 52º C (red color enhancement) on the shortwave IR image.
With the subsequent arrival of daylight, a break in the clouds allowed the faint volcanic plume to be observed on GOES-15 0.63 µm visible channel images (below; click image to play animation), drifting northwestward over the Bering Sea.
GOES-15 0.63 µm visible channel images (click to play animation)
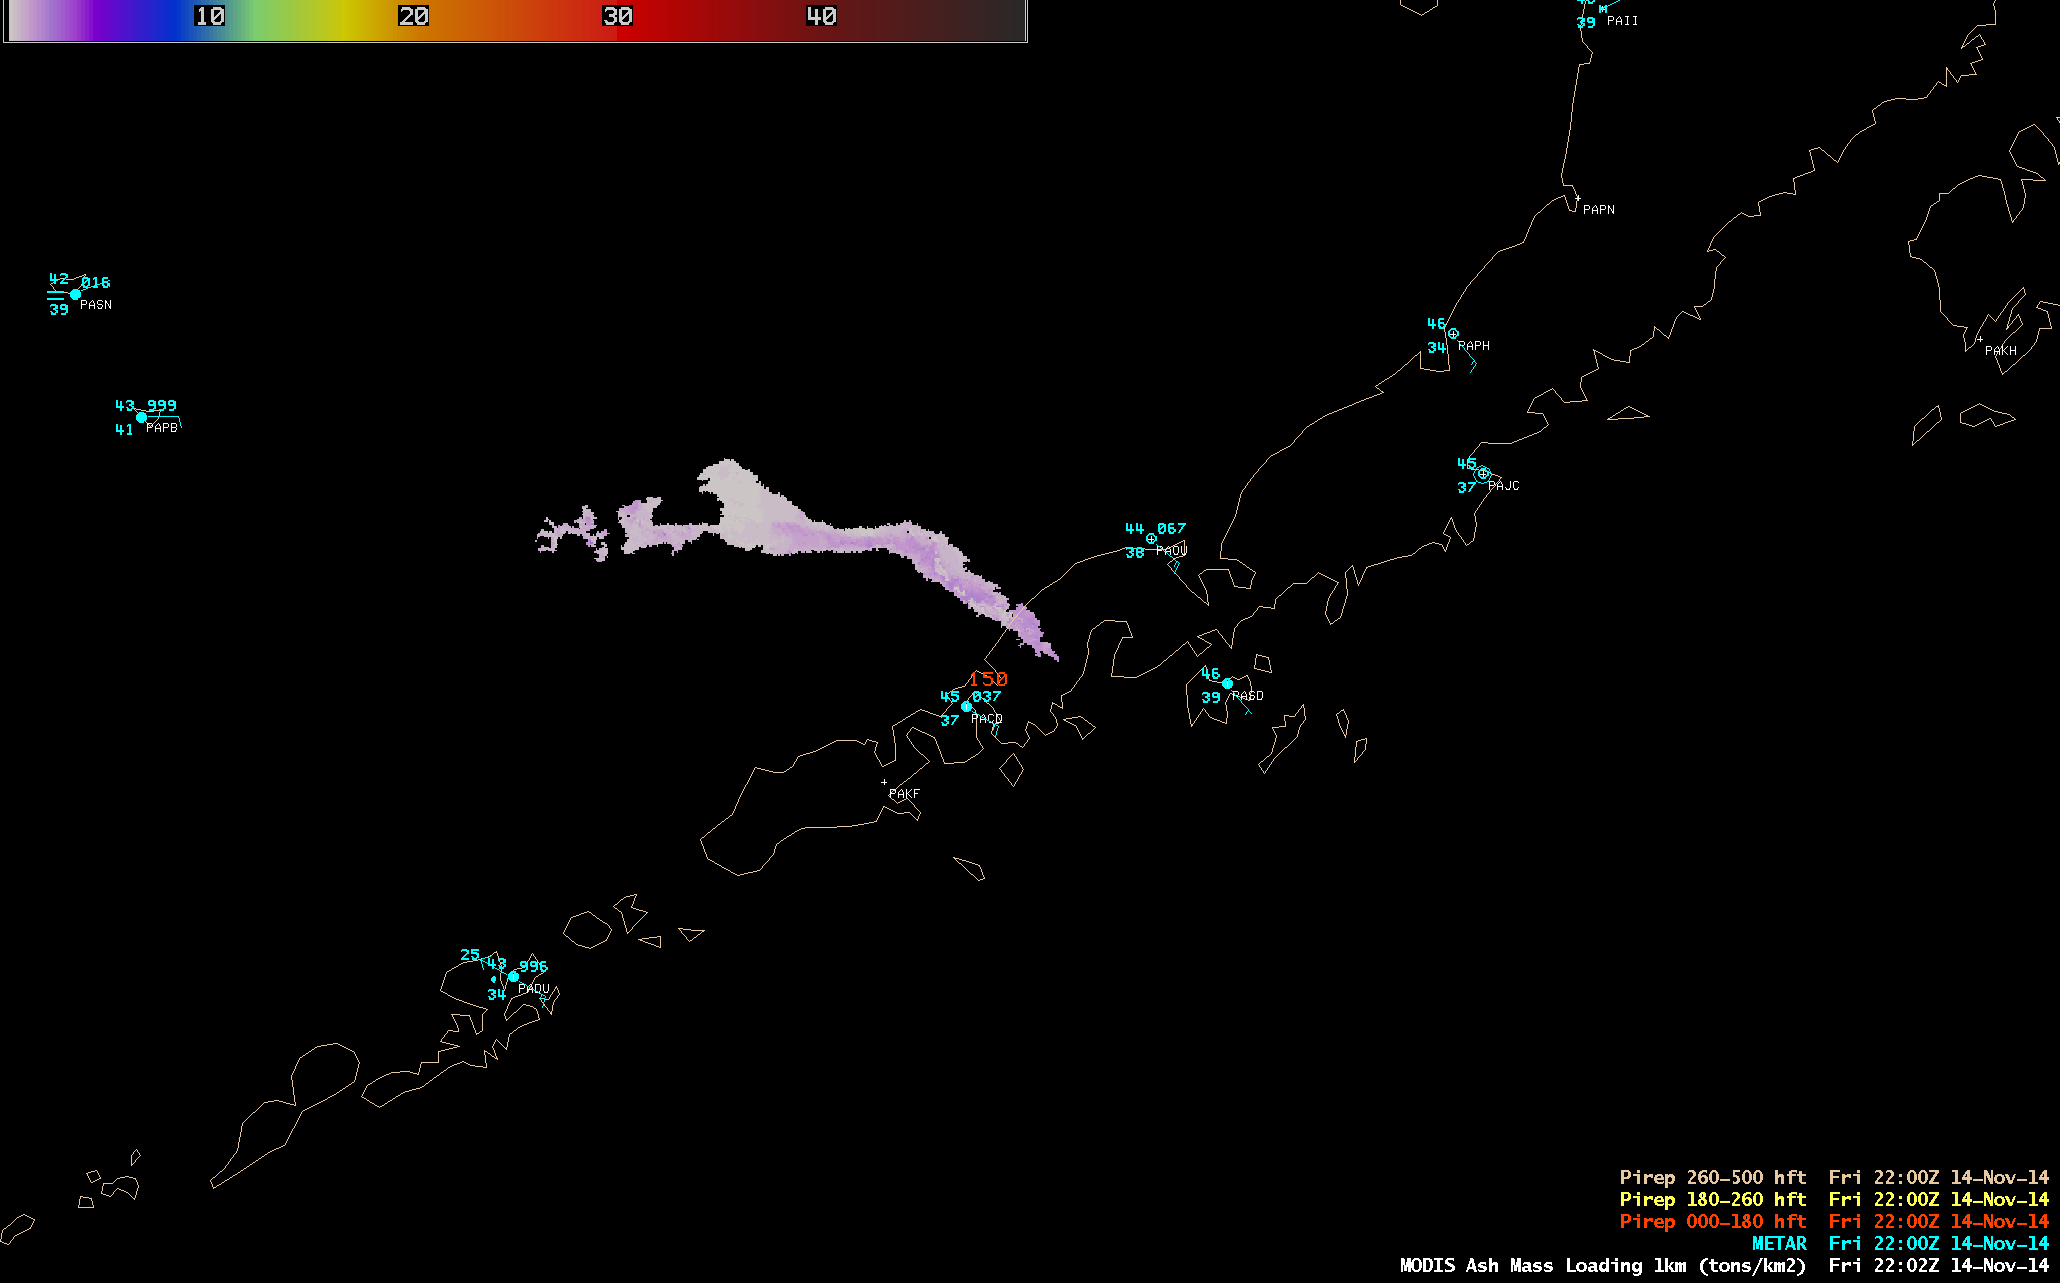
At 22:02 UTC on 14 November, the radiometrically-retrieved maximum volcanic ash mass loading value was 1.8 tons per km2, the maximum ash height was 16.8 km, and the maximum ash mass effective radius was 7.81 µm (below).

MODIS volcanic ash mass loading, ash height, and ash mass effective radius products
About an hour later, the volcanic ash plume could be seen on a 23:03 UTC Suomi NPP VIIRS Day/Night Band image, with a maximum 3.74 µm shortwave IR brightness temperature of 46º C at the summit of the volcano (below).
Suomi NPP VIIRS 0.7 µm Day/Night Band and 3.74 µm shortwave IR images
The brown hue of the volcanic ash plume was very evident on Suomi NPP VIIRS true-color Red/Green/Blue (RGB) images from the SSEC RealEarth web map server (below).
Suomi NPP VIIRS true-color RGB images
The intensity of the Pavlof eruption increased on 15 November, and a well-defined volcanic ash plume could be seen on GOES-15 0.63 µm visible channel images (below; click image to play animation). Pilot reports estimated that the top of the plume was as high as 38,000 feet.
GOES-15 0.63 µm visible channel images (click to play animation)
On a comparison of Suomi NPP VIIRS 0.64 µm visible channel and 11.45 µm IR channel images at 22:45 UTC (below), the coldest cloud-top IR brightness temperature value was -55º C.
Suomi NPP VIIRS 0.64 µm visible channel and 11.45 µm IR channel images
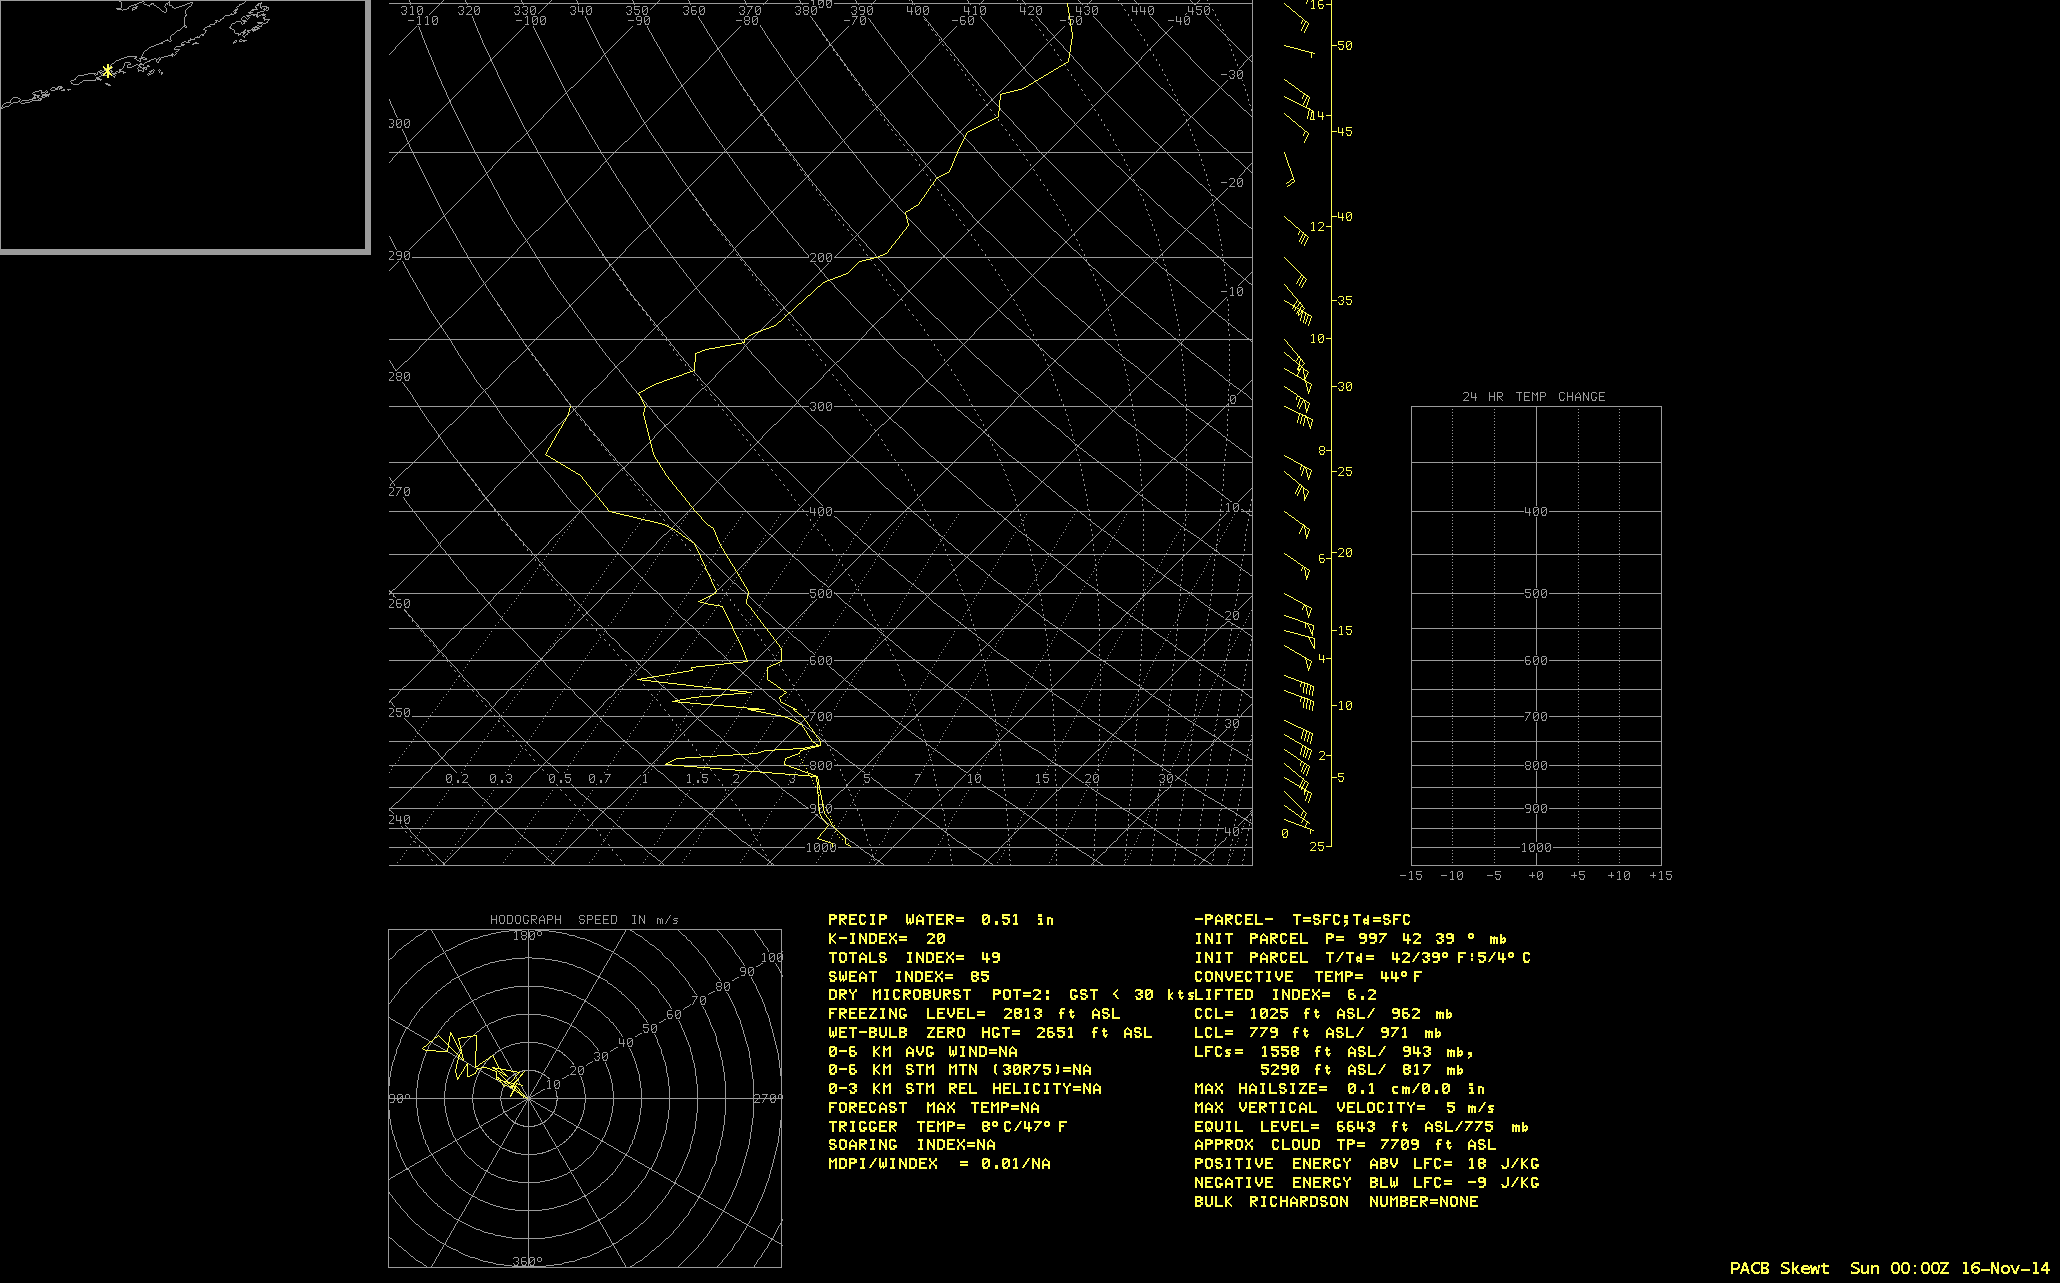
At 22:29 UTC, the CLAVR-x POES AVHRR Cloud Top Temperature product indicated a minimum value of -54º C, with a maximum Cloud Top Height value of 9 km; the -54º C cloud top temperature corresponded to an altitude of around 29,000 feet or 8.7 km on the 16 November/00 UTC Cold Bay AK rawinsonde profile.
POES AVHRR Cloud Top Temperature and Cloud Top Height products
A Suomi NPP VIIRS true-color RGB image at 23:04 UTC (below) suggested that the volcanic plume consisted of a dense layer of tan-colored ash, with a layer of mostly ice cloud at the top of the plume.
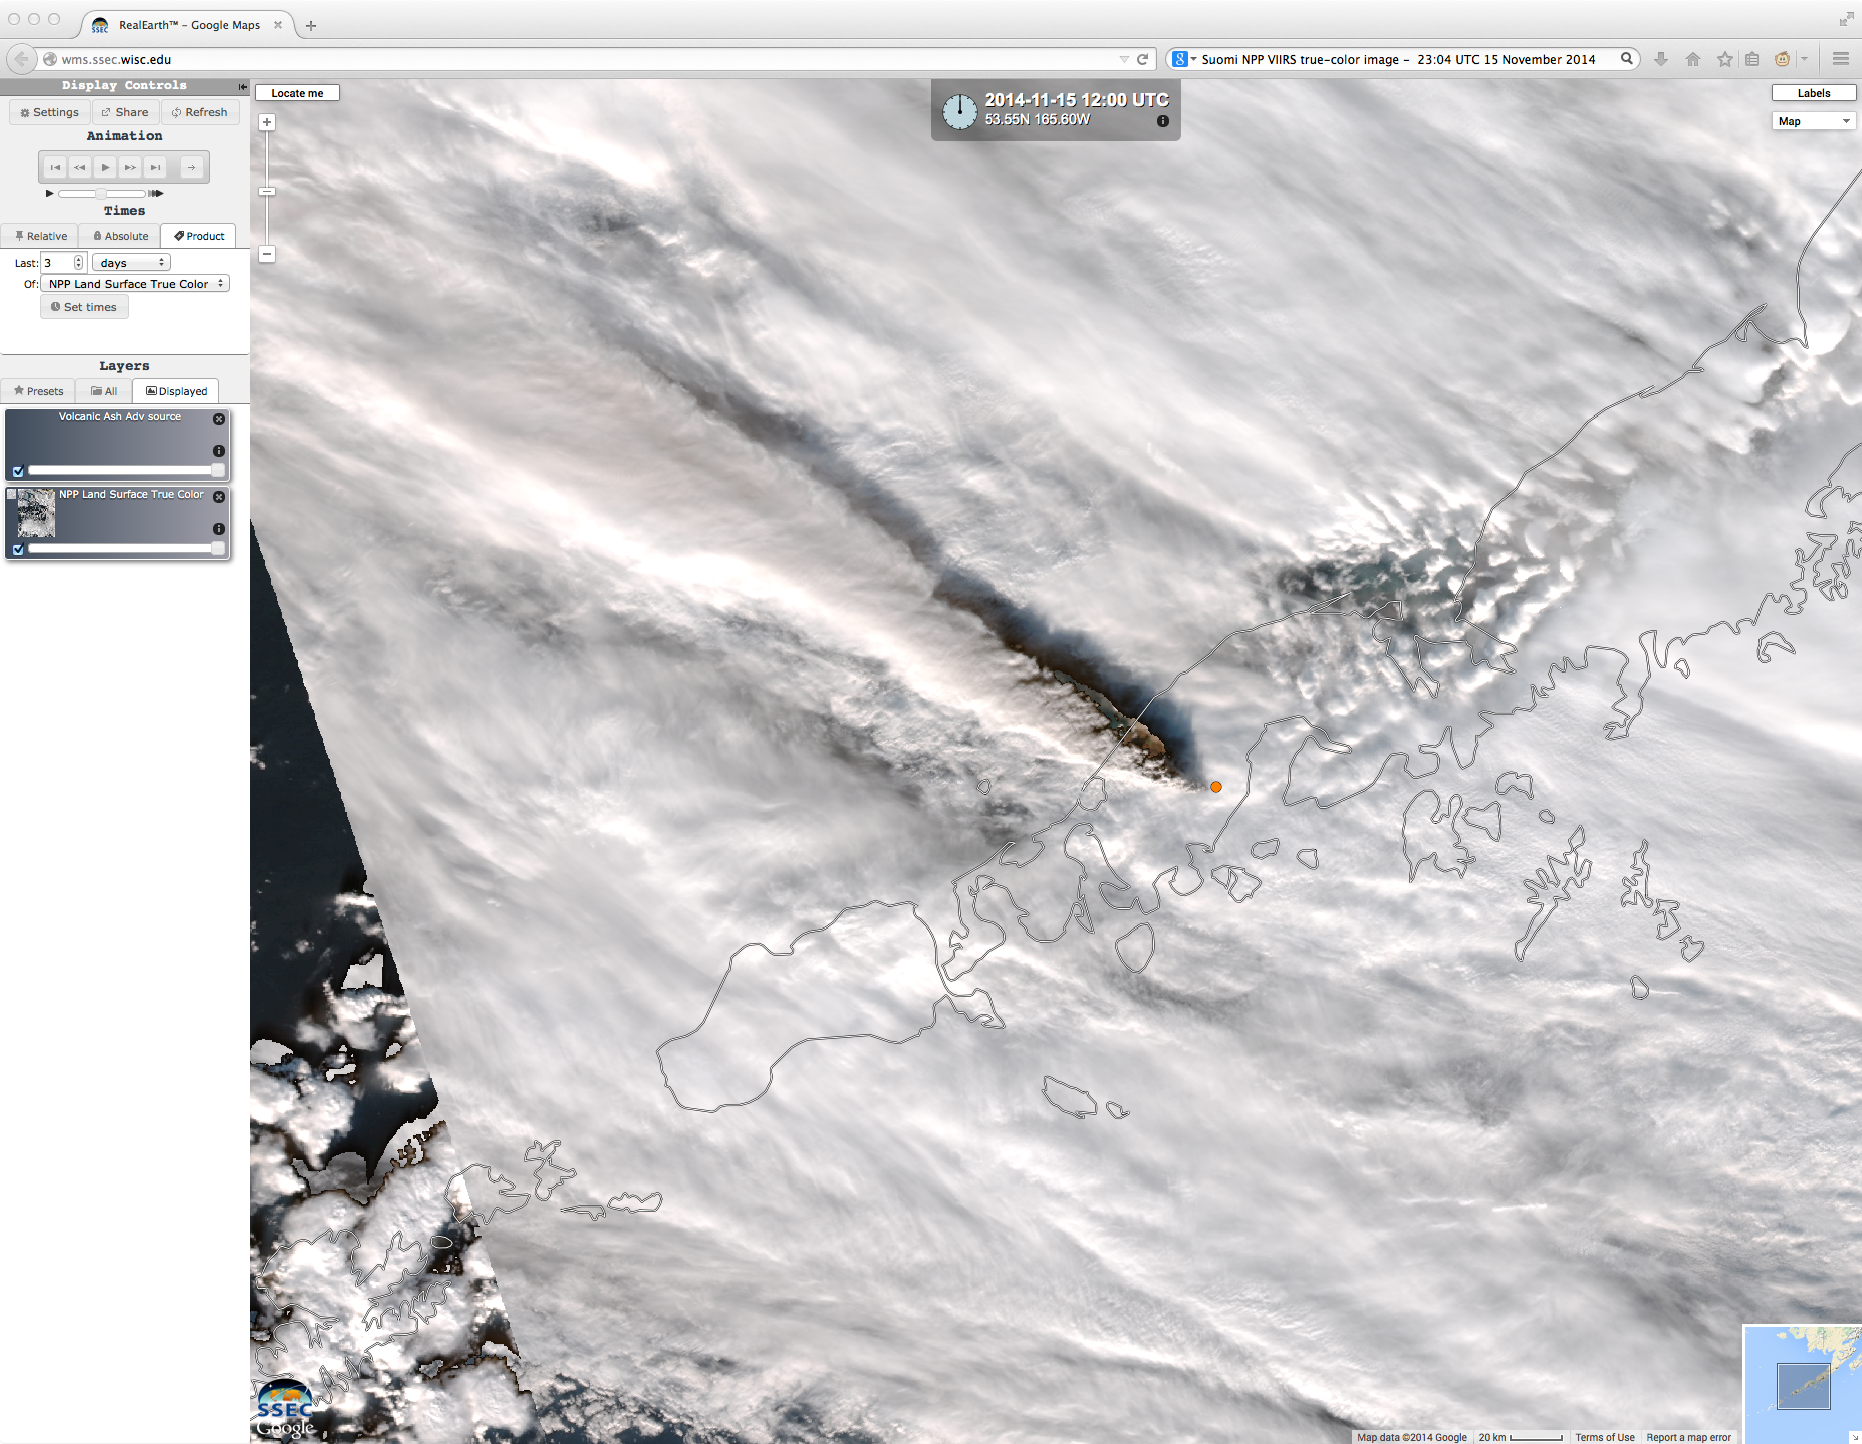
Suomi NPP VIIRS true-color RGB image
View only this post
Read Less

