

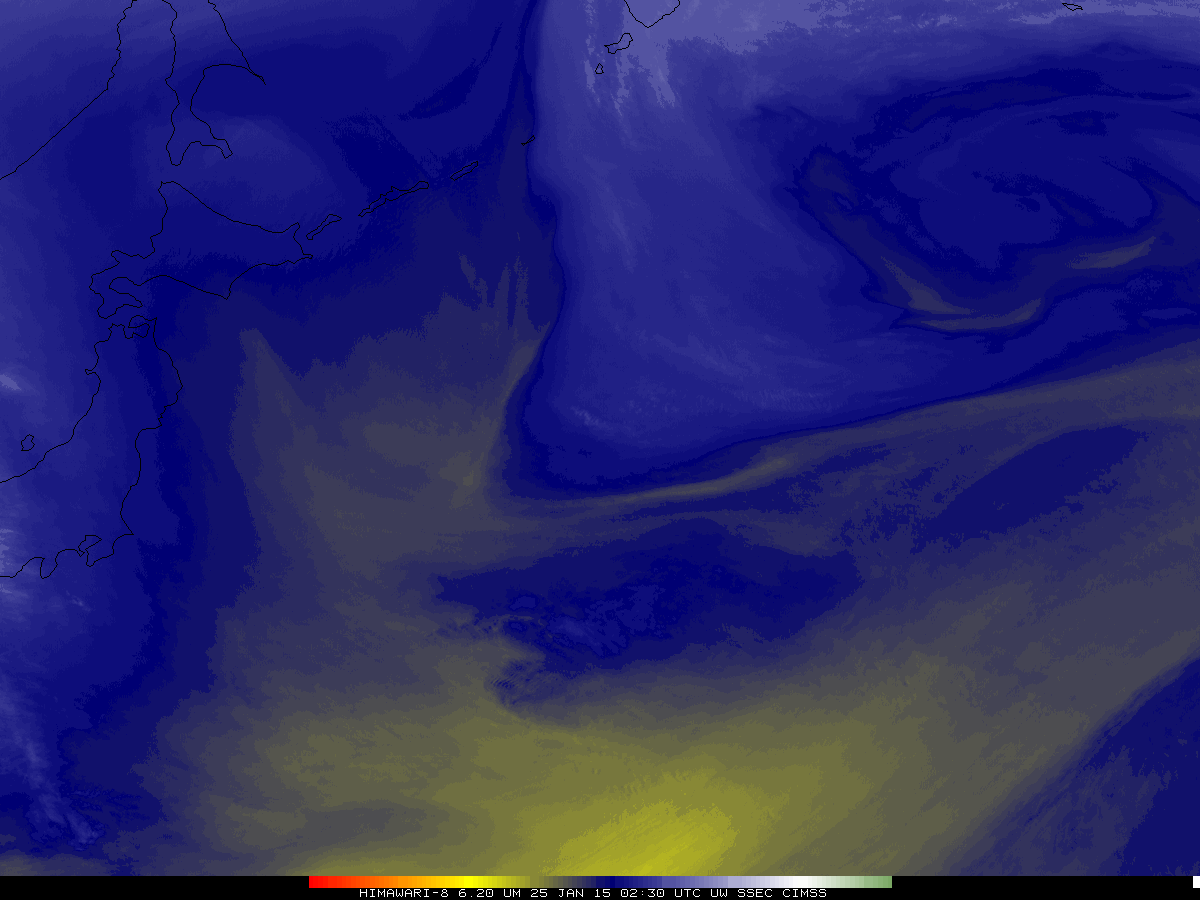
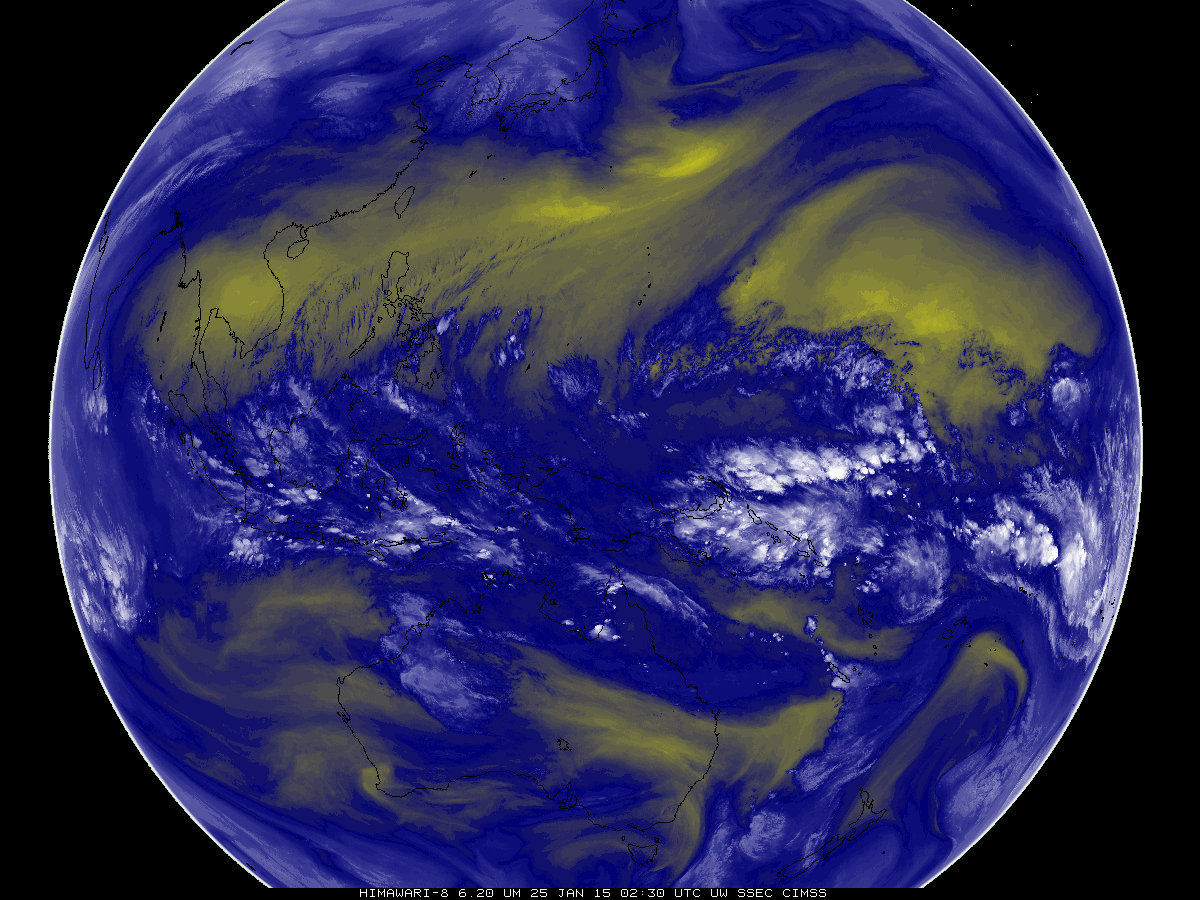
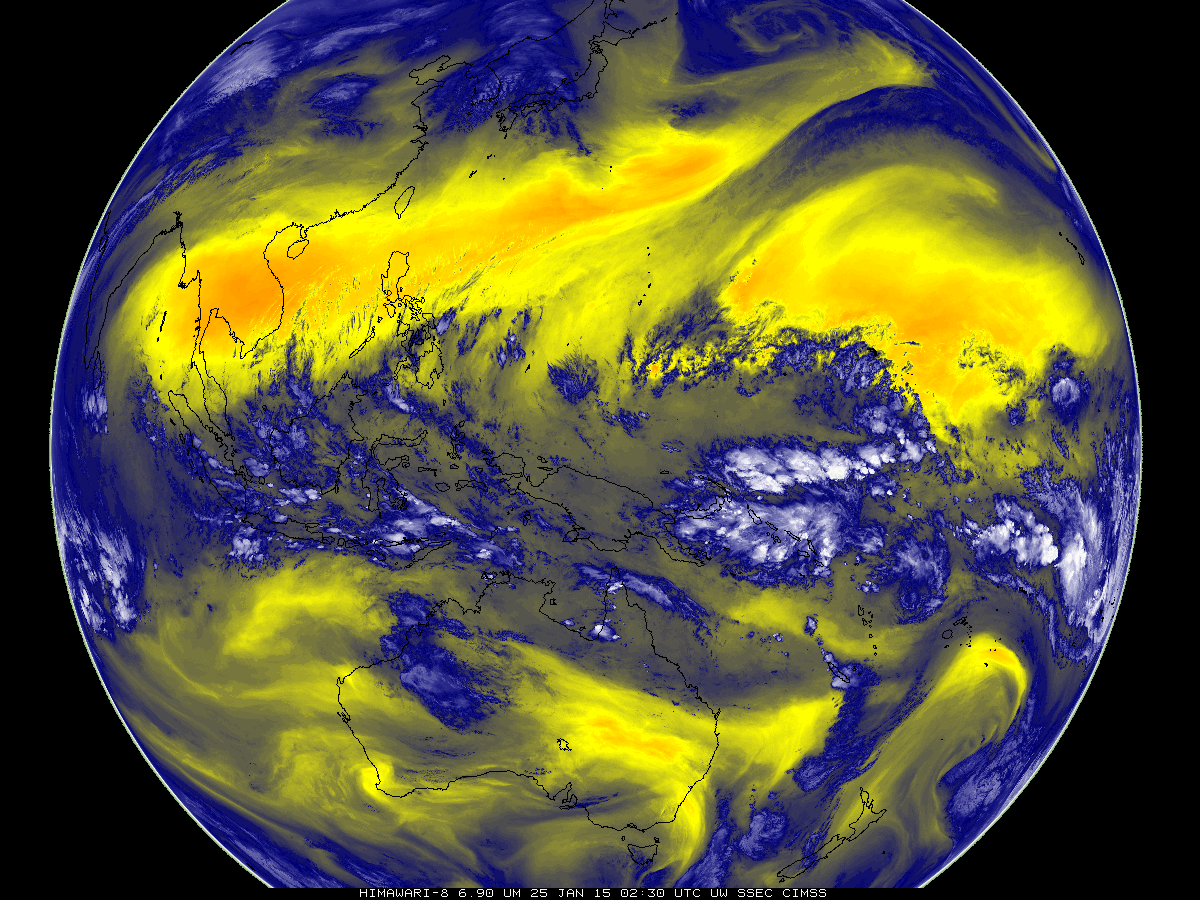
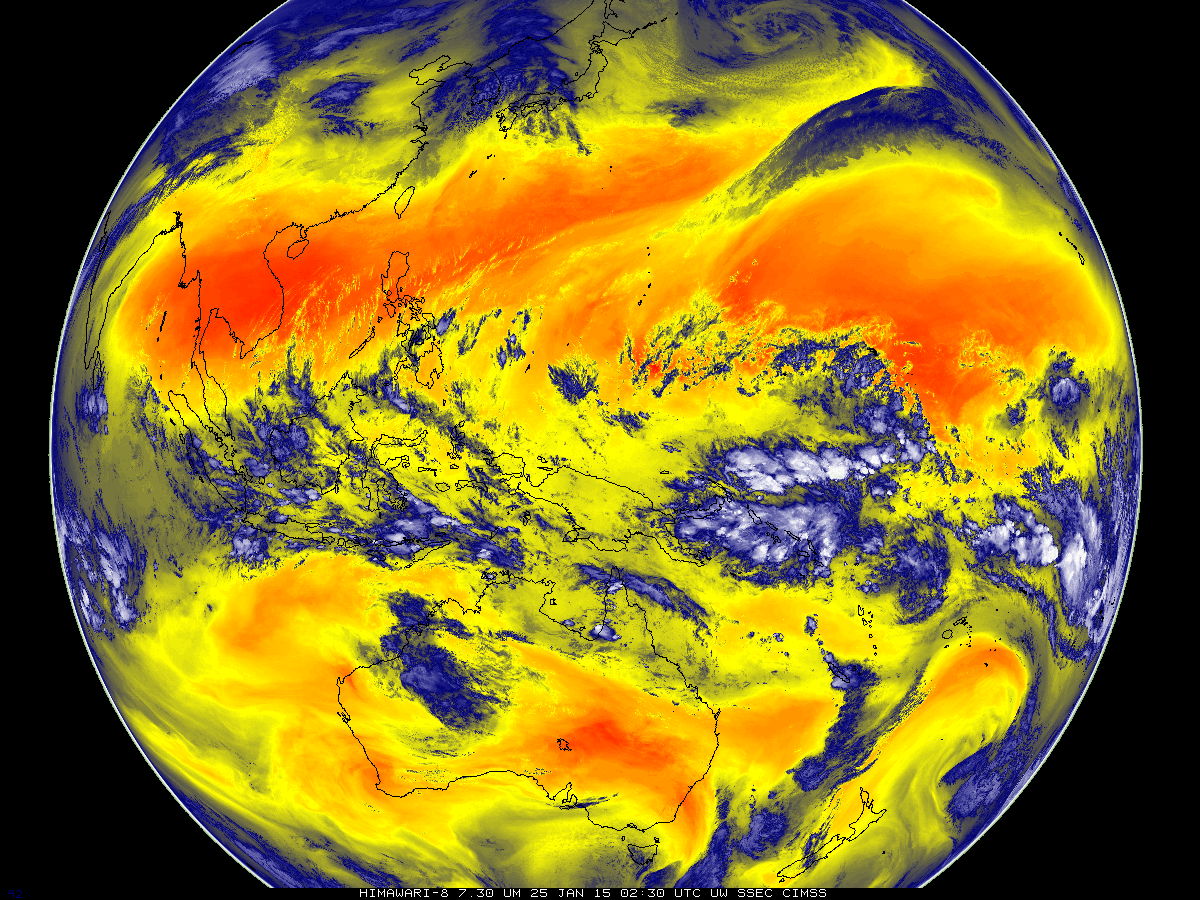
Himawari-8 Water Vapor Imagery at 0230 UTC on 25 January 2015 (click to enlarge)
Himawari-8, launched by the Japanese Meteorological Agency in October 2014, is in its check-out phase with the satellite located near 0º North 140º East. The animation above shows the three water vapor bands (Bands 8, 9 and 10 centered at 6.2 µm, 6.9 µm and 7.3 µm, respectively) from the AHI on Himawari-8.
The strength of three water vapor channels is that they provide information about moisture at three different levels in the atmosphere. Water vapor channel weighting functions (computed from this website) for ABI on GOES-R (an instrument that is very similar to the AHI on Himawari-8) show a peak response near 350-400 mb for the 6.2 µm channel but a peak response near 600-700 mb for the 7.3 µm channel (the 6.9 µm channel is in between). The longer-wavelength water vapor channel can provide information about features located farther down into the atmosphere. In the imagery above, the 7.3 µm imagery shows open cellular convection in the cold advection south of the occluded low pressure system over the northern Pacific, east of Japan. In contrast, the 6.2 µm imagery shows only the higher clouds and moisture.
The effect is far more pronounced at full resolution, below. The 6.2 µm data shows only high clouds and moisture; those high-altitude features are not well represented at 7.3 µm. In contrast, low clouds that cannot be seen in the 6.2 µm data are very apparent in the 7.3 µm imagery.
Full Resolution Himawari-8 Water Vapor Imagery at 0230 UTC on 25 January 2015 (click to enlarge)
Similarly, over south central Australia, there is a strong cold signal in the 6.2 µm imagery east of Adelaide. The 6.9 µm and 7.3 µm imagery does not show such a strong signal, suggesting that only high clouds are present.
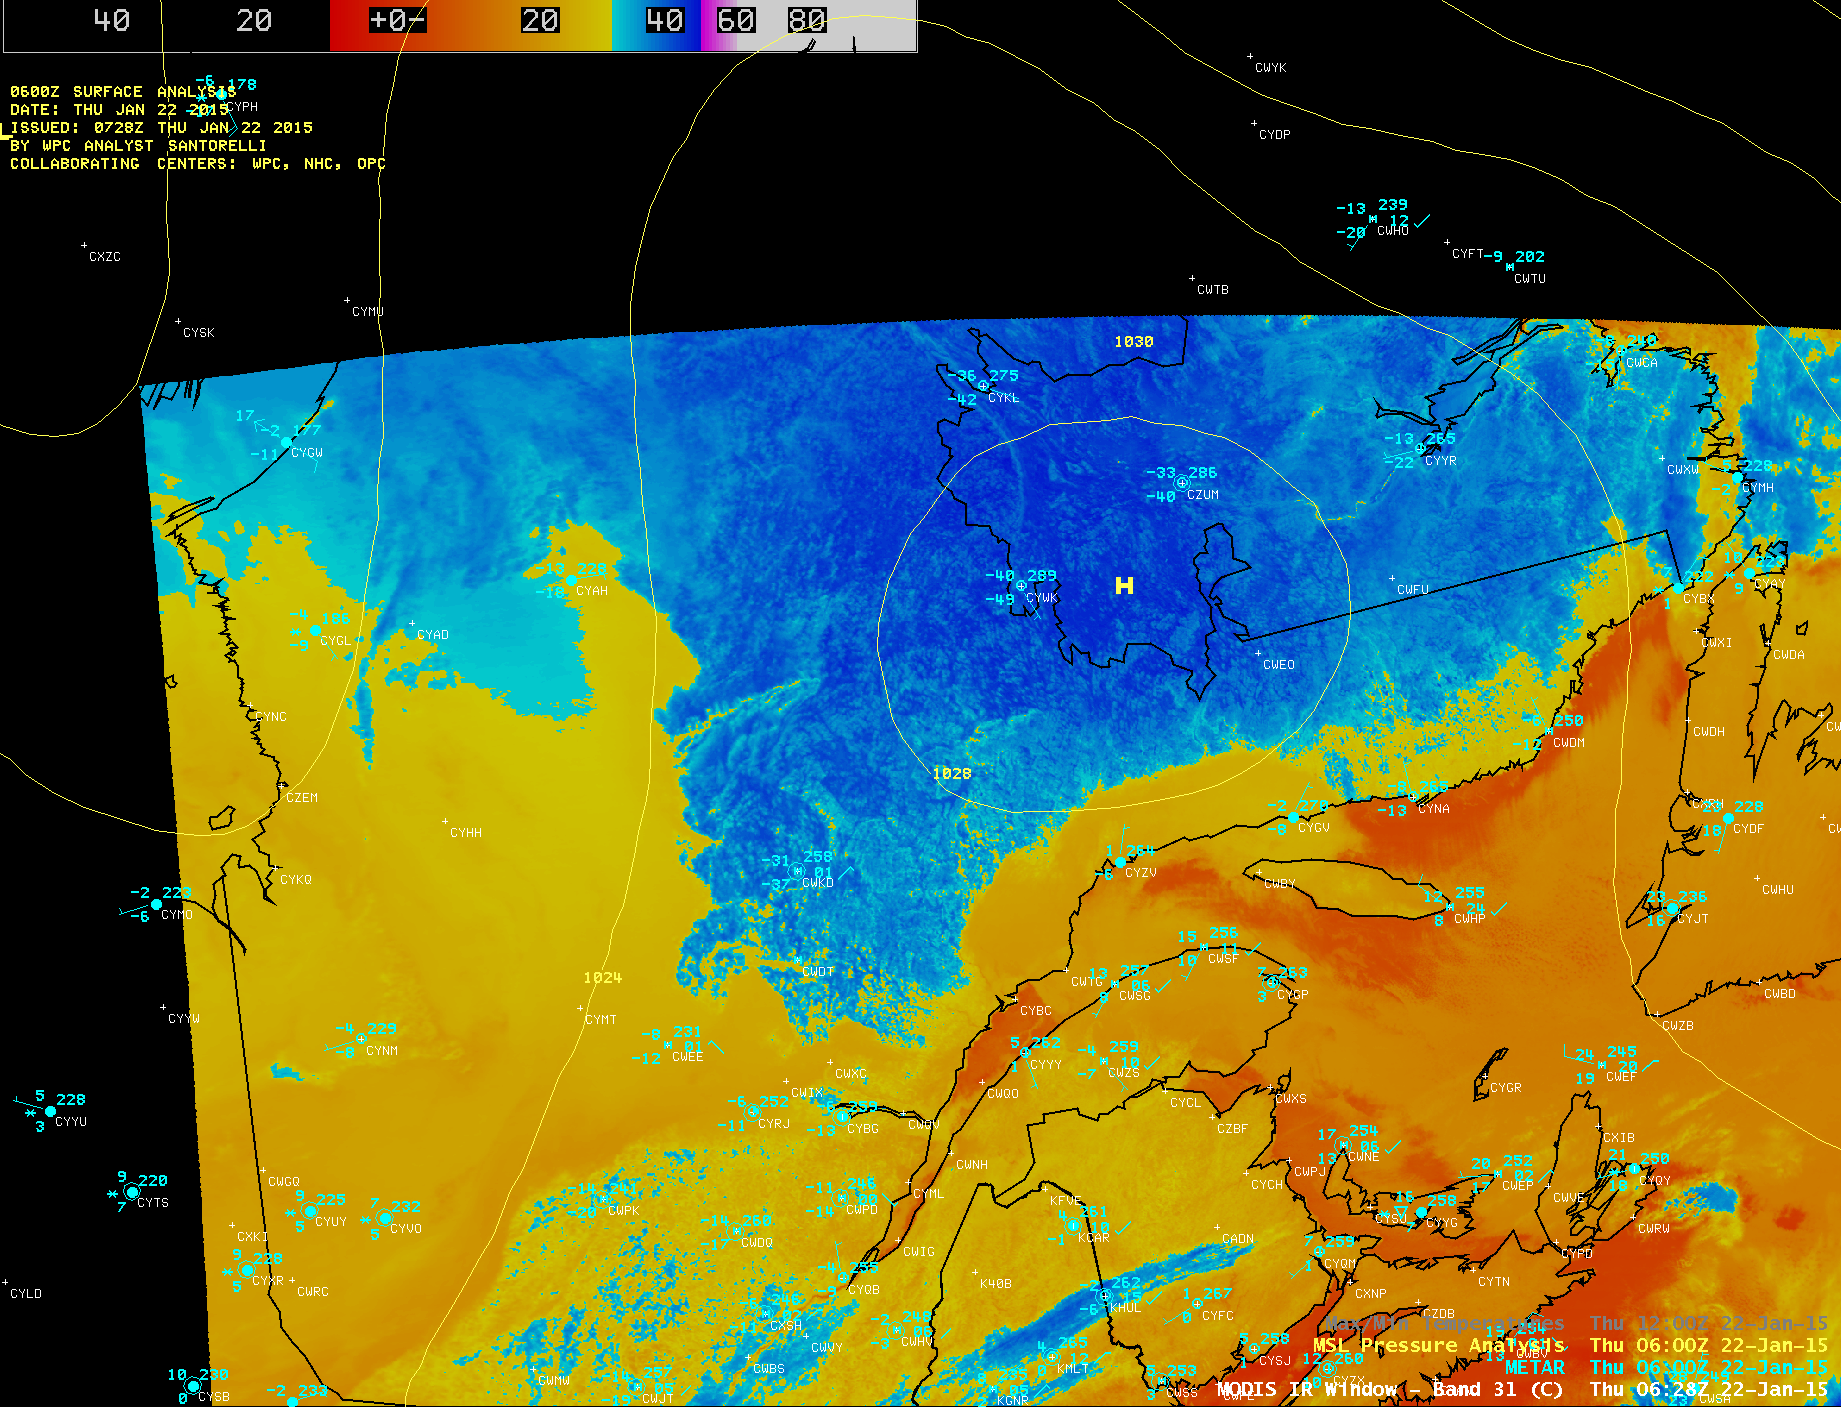
Multiple water vapor channels are present now on the GOES Sounder (see here), and those data are used in the CIMSS NearCasting product. GOES Sounder data has a limited domain, however, and relatively coarse resolution. Himawari-8 (and GOES-R) offers a great increase in spatial and temporal resolution over the three GOES Sounder water vapor channels.
These AHI Images are from data posted at JMA‘s AHI webpage: Link. A comparison of Himawari-8 and MTSAT-2 visible and IR images is available here.
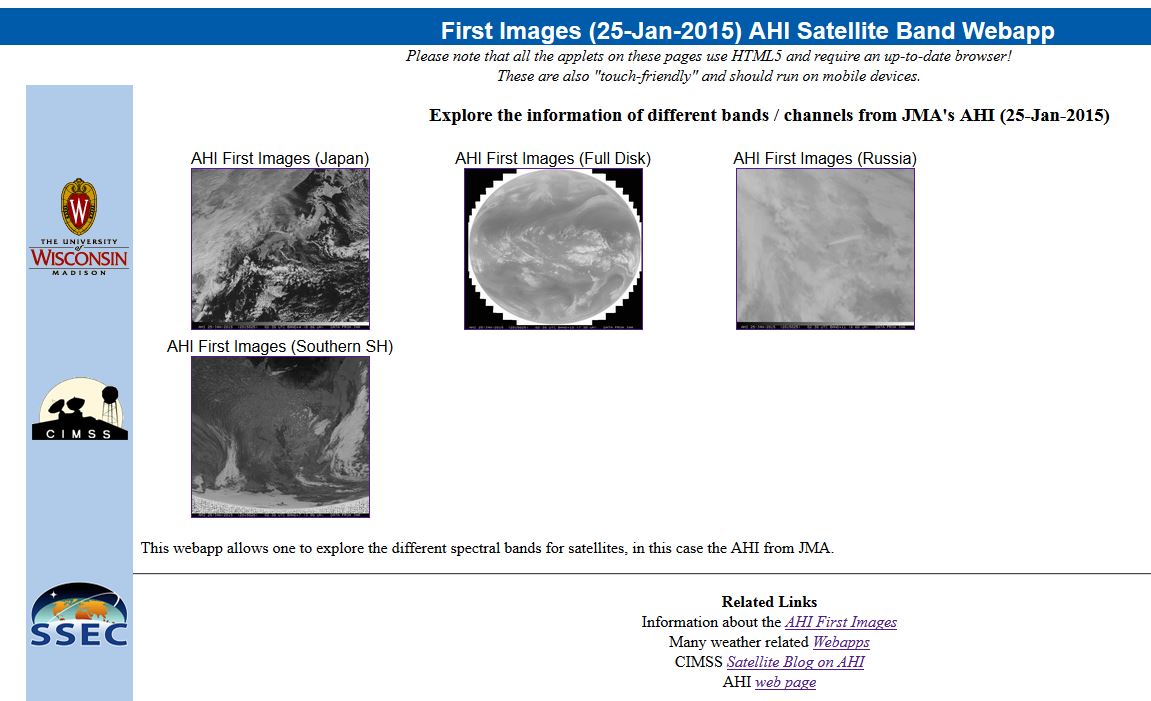
Himawari-8 AHI Satellite Band Webapp page
A collection of “webapps” (above) was created which allows one to explore the different spectral bands of the Himawari-8 AHI from the 25 January 2015 First Images. An example from the Full Disk webapp is shown below.
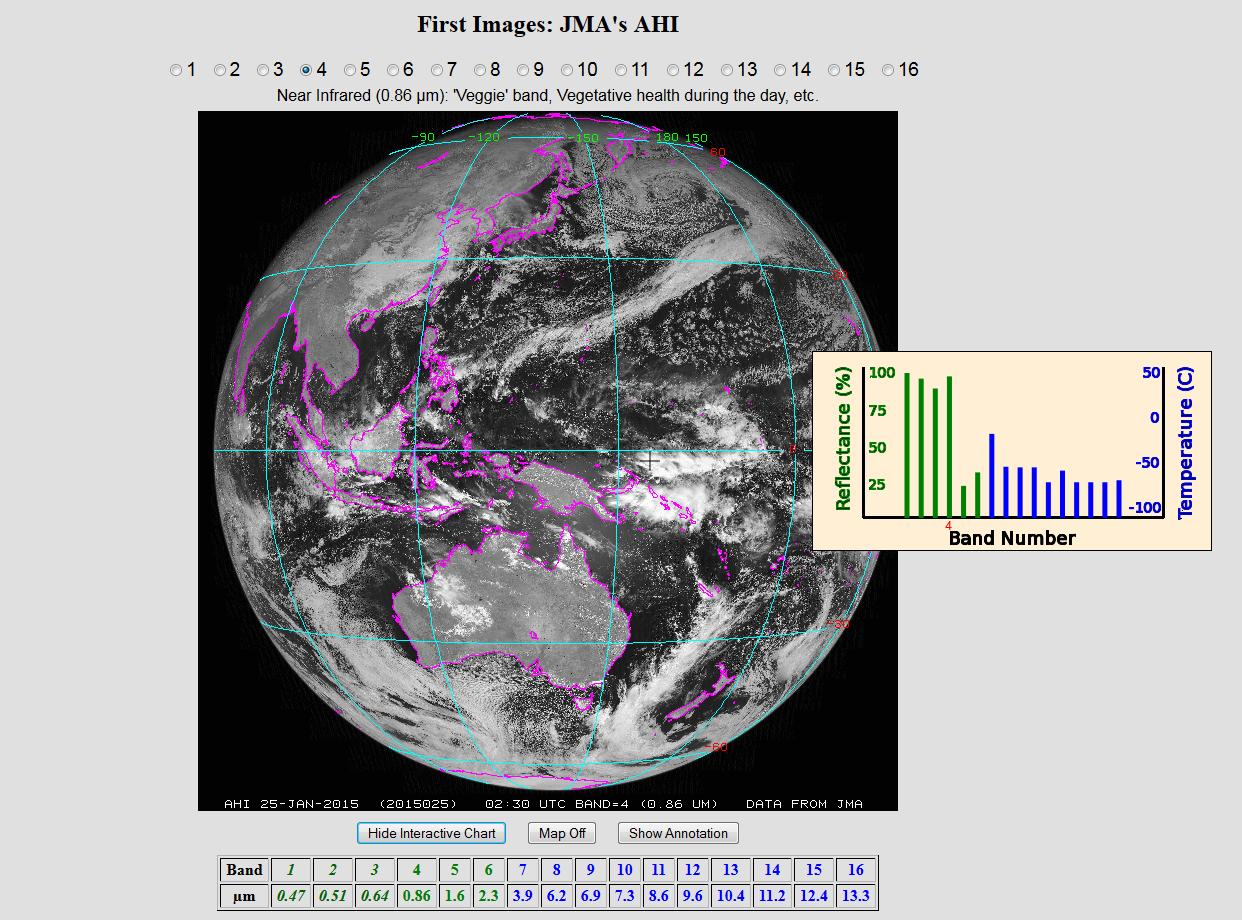
Example from the AHI Full Disk image webapp
View only this post Read Less


