A strong winter storm impacted much of the Northeast US on 09 February 2017, dropping up to 24 inches of snow in Maine and producing wind gusts of 70 mph in Massachusetts (WPC storm summary). GOES-13 (GOES-East) Water Vapor (6.5 µm) images with surface fronts and Mean Sea Level Pressure (above) showed the rapid... Read More
![GOES-13 Water Vapor (6.5 µm) images, with surface fronts and MSLP pressure [click to play animation]](https://cimss.ssec.wisc.edu/satellite-blog/wp-content/uploads/sites/5/2017/02/screenCapture-20170209_180000.png)
GOES-13 Water Vapor (6.5 µm) images, with surface fronts and MSLP pressure [click to play animation]
A strong winter storm impacted much of the Northeast US on
09 February 2017, dropping up to 24 inches of snow in Maine and producing wind gusts of 70 mph in Massachusetts (
WPC storm summary). GOES-13
(GOES-East) Water Vapor (6.5 µm) images with surface fronts and Mean Sea Level Pressure
(above) showed the rapid intensification of the mid-latitude cyclone.
![GOES-13 Visible (0.63 µm) images, with hourly surface weather symbols [click to play animation]](https://cimss.ssec.wisc.edu/satellite-blog/wp-content/uploads/sites/5/2017/02/960x1280_EASTL_B1_GOES13_VIS_NEUS_WINTER_STORM_09FEB2017_2017040_181500_0001PANEL.GIF)
GOES-13 Visible (0.63 µm) images, with hourly surface weather symbols [click to play animation]
GOES-13 Visible images
(above) and Water Vapor images
(below) with hourly surface weather symbols revealed the extent of thunderstorms in the south and heavy snow in the north. A number of sites in New England also reported thundersnow.
![GOES-13 Water Vapor (6.5 Âm) images, with hourly surface weather symbols [click to play animation]](https://cimss.ssec.wisc.edu/satellite-blog/wp-content/uploads/sites/5/2017/02/960x1280_EASTL_B3_GOES13_WV_NEUS_WINTER_STORM_09FEB2017_2017040_213000_0001PANEL.GIF)
GOES-13 Water Vapor (6.5 Âm) images, with hourly surface weather symbols [click to play animation]
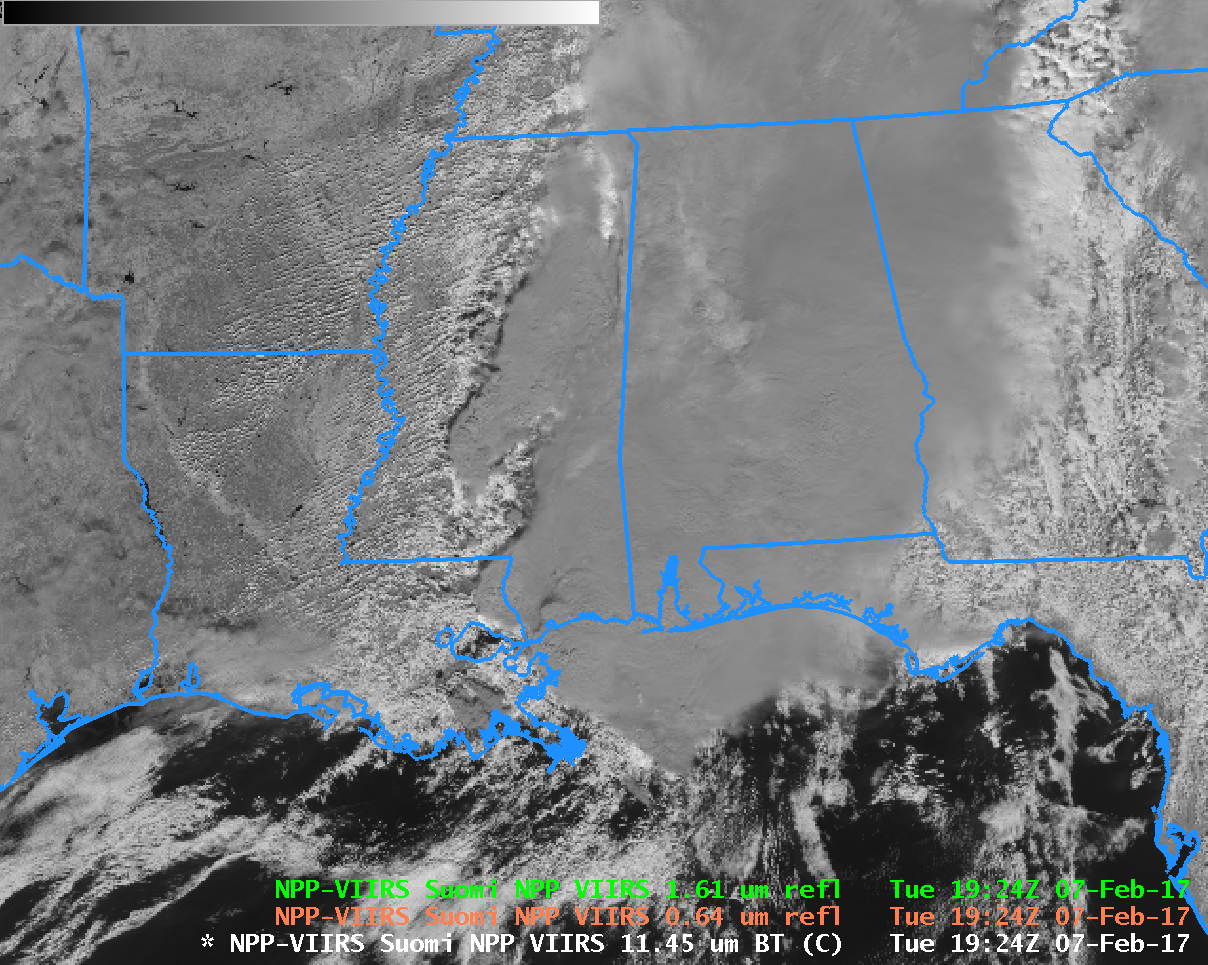
Suomi NPP VIIRS Visible (0.64 µm) and infrared Window (11.45 µm) images
(below) provided a high-resolution snapshot of the storm at 1708 UTC. Note the areas of banded convective elements both south of the storm center over the Atlantic, and also inland over parts of New England.
![Suomi NPP VIIRS Visible (0.64 µm) and Infrared Window (11.45 µm) images, with surface fronts and MSLP [click to enlarge]](https://cimss.ssec.wisc.edu/satellite-blog/wp-content/uploads/sites/5/2017/02/170209_1708utc_suomi_npp_viirs_Visible_InfraredWindow_anim.gif)
Suomi NPP VIIRS Visible (0.64 µm) and Infrared Window (11.45 µm) images, with surface fronts and MSLP [click to enlarge]
===== 10 February Update =====
![Terra and Aqua MODIS false-color RGB images [click to enlarge]](https://cimss.ssec.wisc.edu/satellite-blog/wp-content/uploads/sites/5/2017/02/170210_1601utc_1743utc_modis_snow_cloud_discrimination_rgb_anim.gif)
Terra and Aqua MODIS false-color RGB images [click to enlarge]
As the storm moved northward over Newfoundland and Labrador in eastern Canada on
10 February, a toggle between Terra (1601 UTC) and Aqua (1743 UTC) MODIS false-color “snow/cloud discrimination” Red/Green/Blue (RGB) images
(above) showed the extent of the snow cover
(darker shades of red), although supercooled water droplet clouds
(shades of white) persisted over many areas at the times of the 2 images. Glaciated ice crystal clouds also appeared as shades of red.
Snowfall totals in the Canadian Maritimes were as high as 38 cm (15 inches).
View only this post
Read Less
![GOES-13 Water Vapor (6.5 µm) images, with surface fronts and MSLP pressure [click to play animation]](https://cimss.ssec.wisc.edu/satellite-blog/wp-content/uploads/sites/5/2017/02/170209_goes13_water_vapor_surface_analyses_anim.gif)
![GOES-13 Visible (0.63 µm) images, with hourly surface weather symbols [click to play animation]](https://cimss.ssec.wisc.edu/satellite-blog/wp-content/uploads/sites/5/2017/02/170209_goes13_visible_Northeast_US_winter_storm_anim.gif)
![GOES-13 Water Vapor (6.5 Âm) images, with hourly surface weather symbols [click to play animation]](https://cimss.ssec.wisc.edu/satellite-blog/wp-content/uploads/sites/5/2017/02/170209_goes13_water_vapor_Northeast_US_winter_storm_anim.gif)
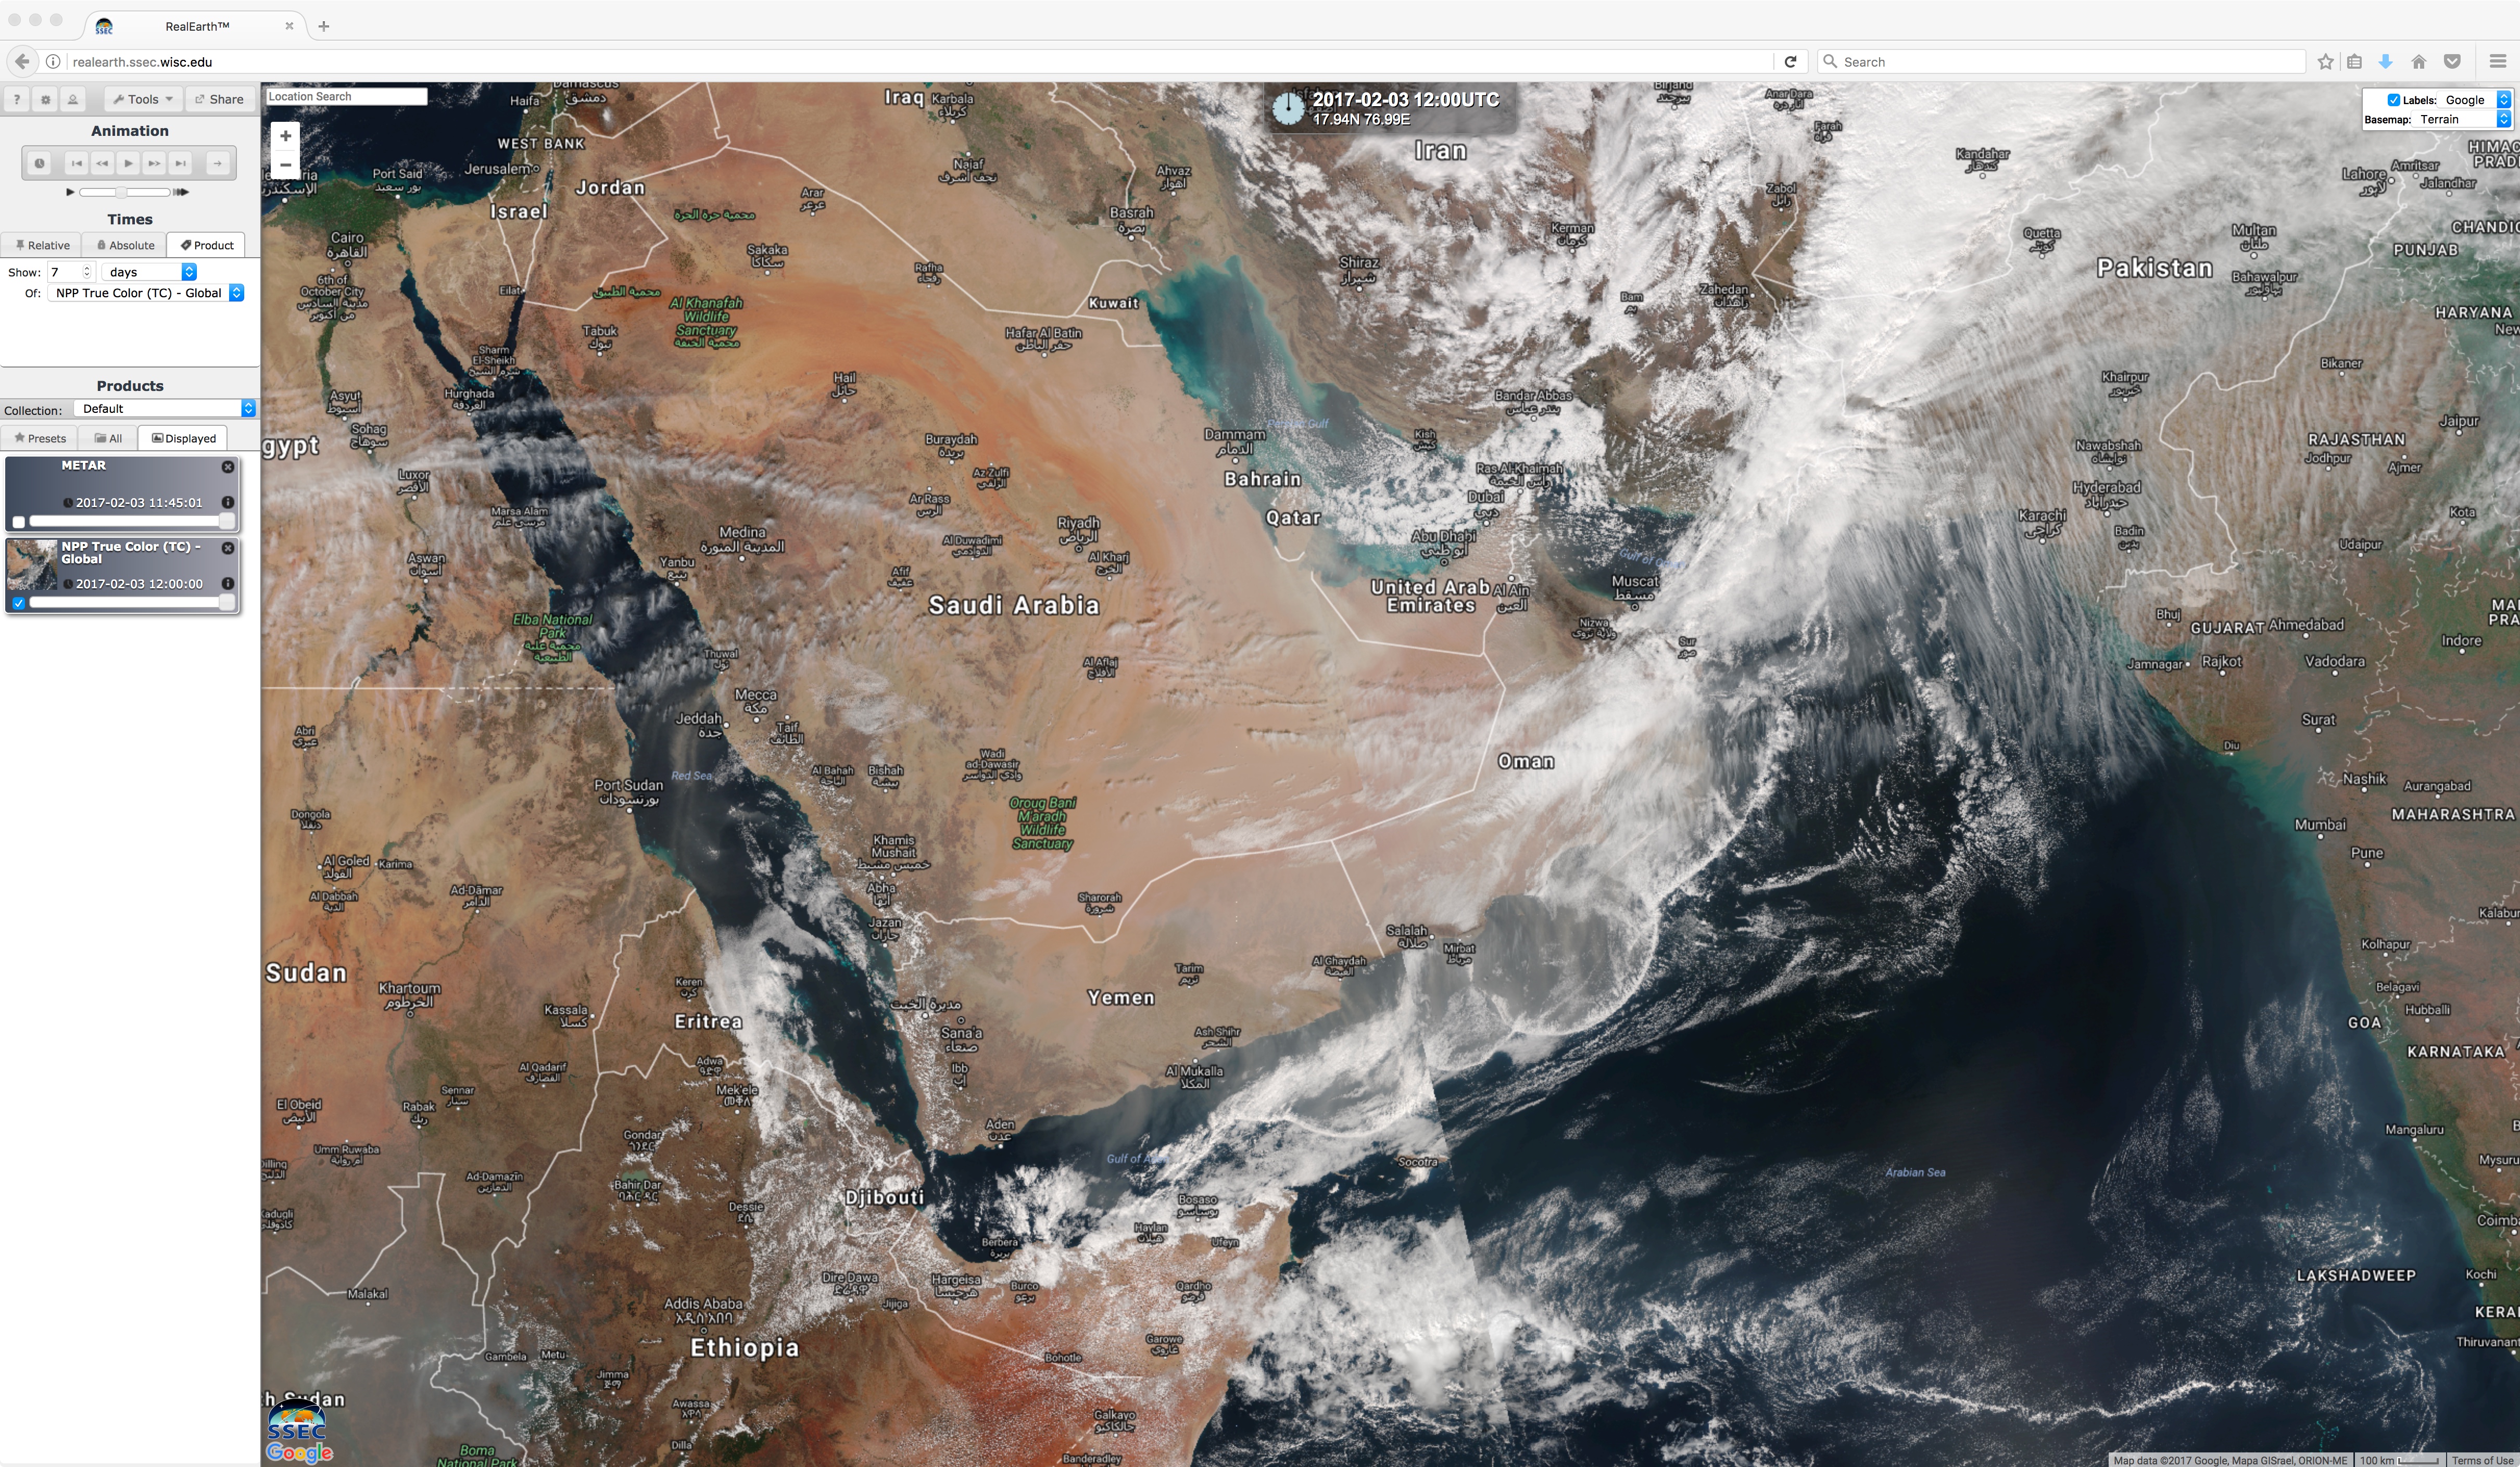
![Daily composites of Suomi NPP VIIRS true-color images [click to play animation]](https://cimss.ssec.wisc.edu/satellite-blog/wp-content/uploads/sites/5/2017/02/1701311-170205_suomi_npp_viirs_truecolor_Arabian_Peninsula_anim.gif)
![Daily composites of Suomi NPP VIIRS true-color images, with METAR surface observations [click to enlarge]](https://cimss.ssec.wisc.edu/satellite-blog/wp-content/uploads/sites/5/2017/02/170201-170204_suomi_npp_viirs_truecolor_metars_Persian_Gulf_anim.gif)
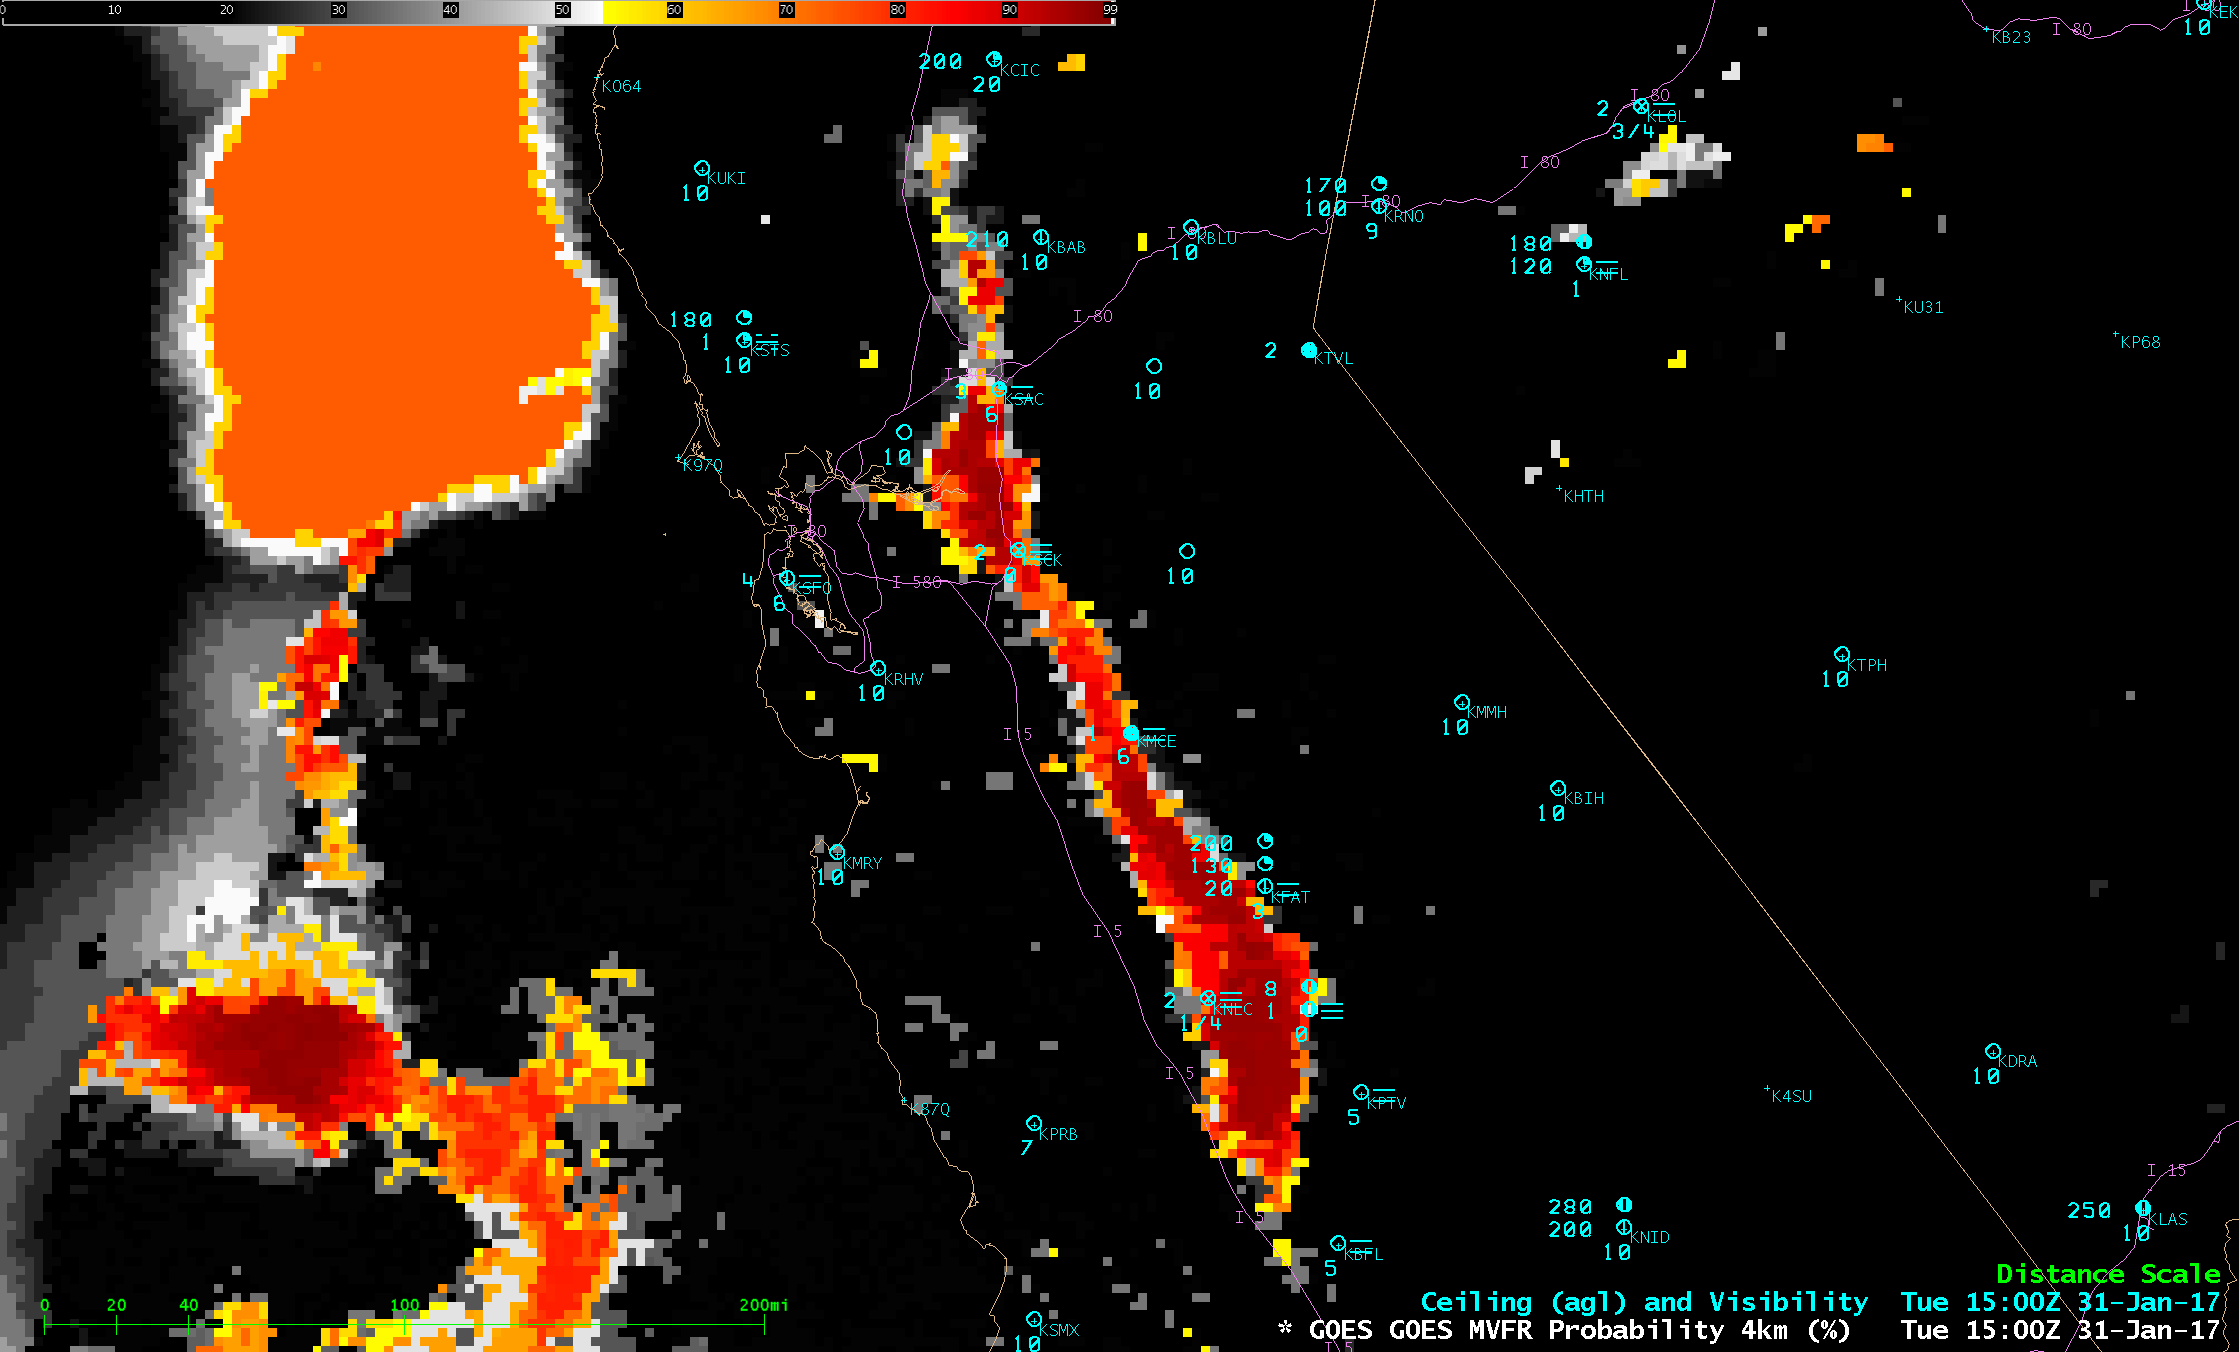
![GOES-15 MVFR Probability product [click to play animation]](https://cimss.ssec.wisc.edu/satellite-blog/wp-content/uploads/sites/5/2017/01/170131_goes15_mvfr_probability_CA_Tule_fog_anim.gif)
![GOES-15 MVFR Probability and Aqua MODIS Infrared Brightness Temperature Difference (BTD) products [click to enlarge]](https://cimss.ssec.wisc.edu/satellite-blog/wp-content/uploads/sites/5/2017/01/170131_0900utc_goes15_mvfr_aqua_modis_btd_anim.gif)
![GOES-15 MVFR Probability and Suomi NPP VIIRS infrared Brightness Temperature Difference (BTD) products [click to enlarge]](https://cimss.ssec.wisc.edu/satellite-blog/wp-content/uploads/sites/5/2017/01/170131_1015utc_goes15_mvfr_suomi_npp_viirs_btd_anim.gif)
![GOES-15 Visible (0.63 µm) images [click to play animation]](https://cimss.ssec.wisc.edu/satellite-blog/wp-content/uploads/sites/5/2017/01/170131_goes15_visible_Tule_fog_CA_anim.gif)
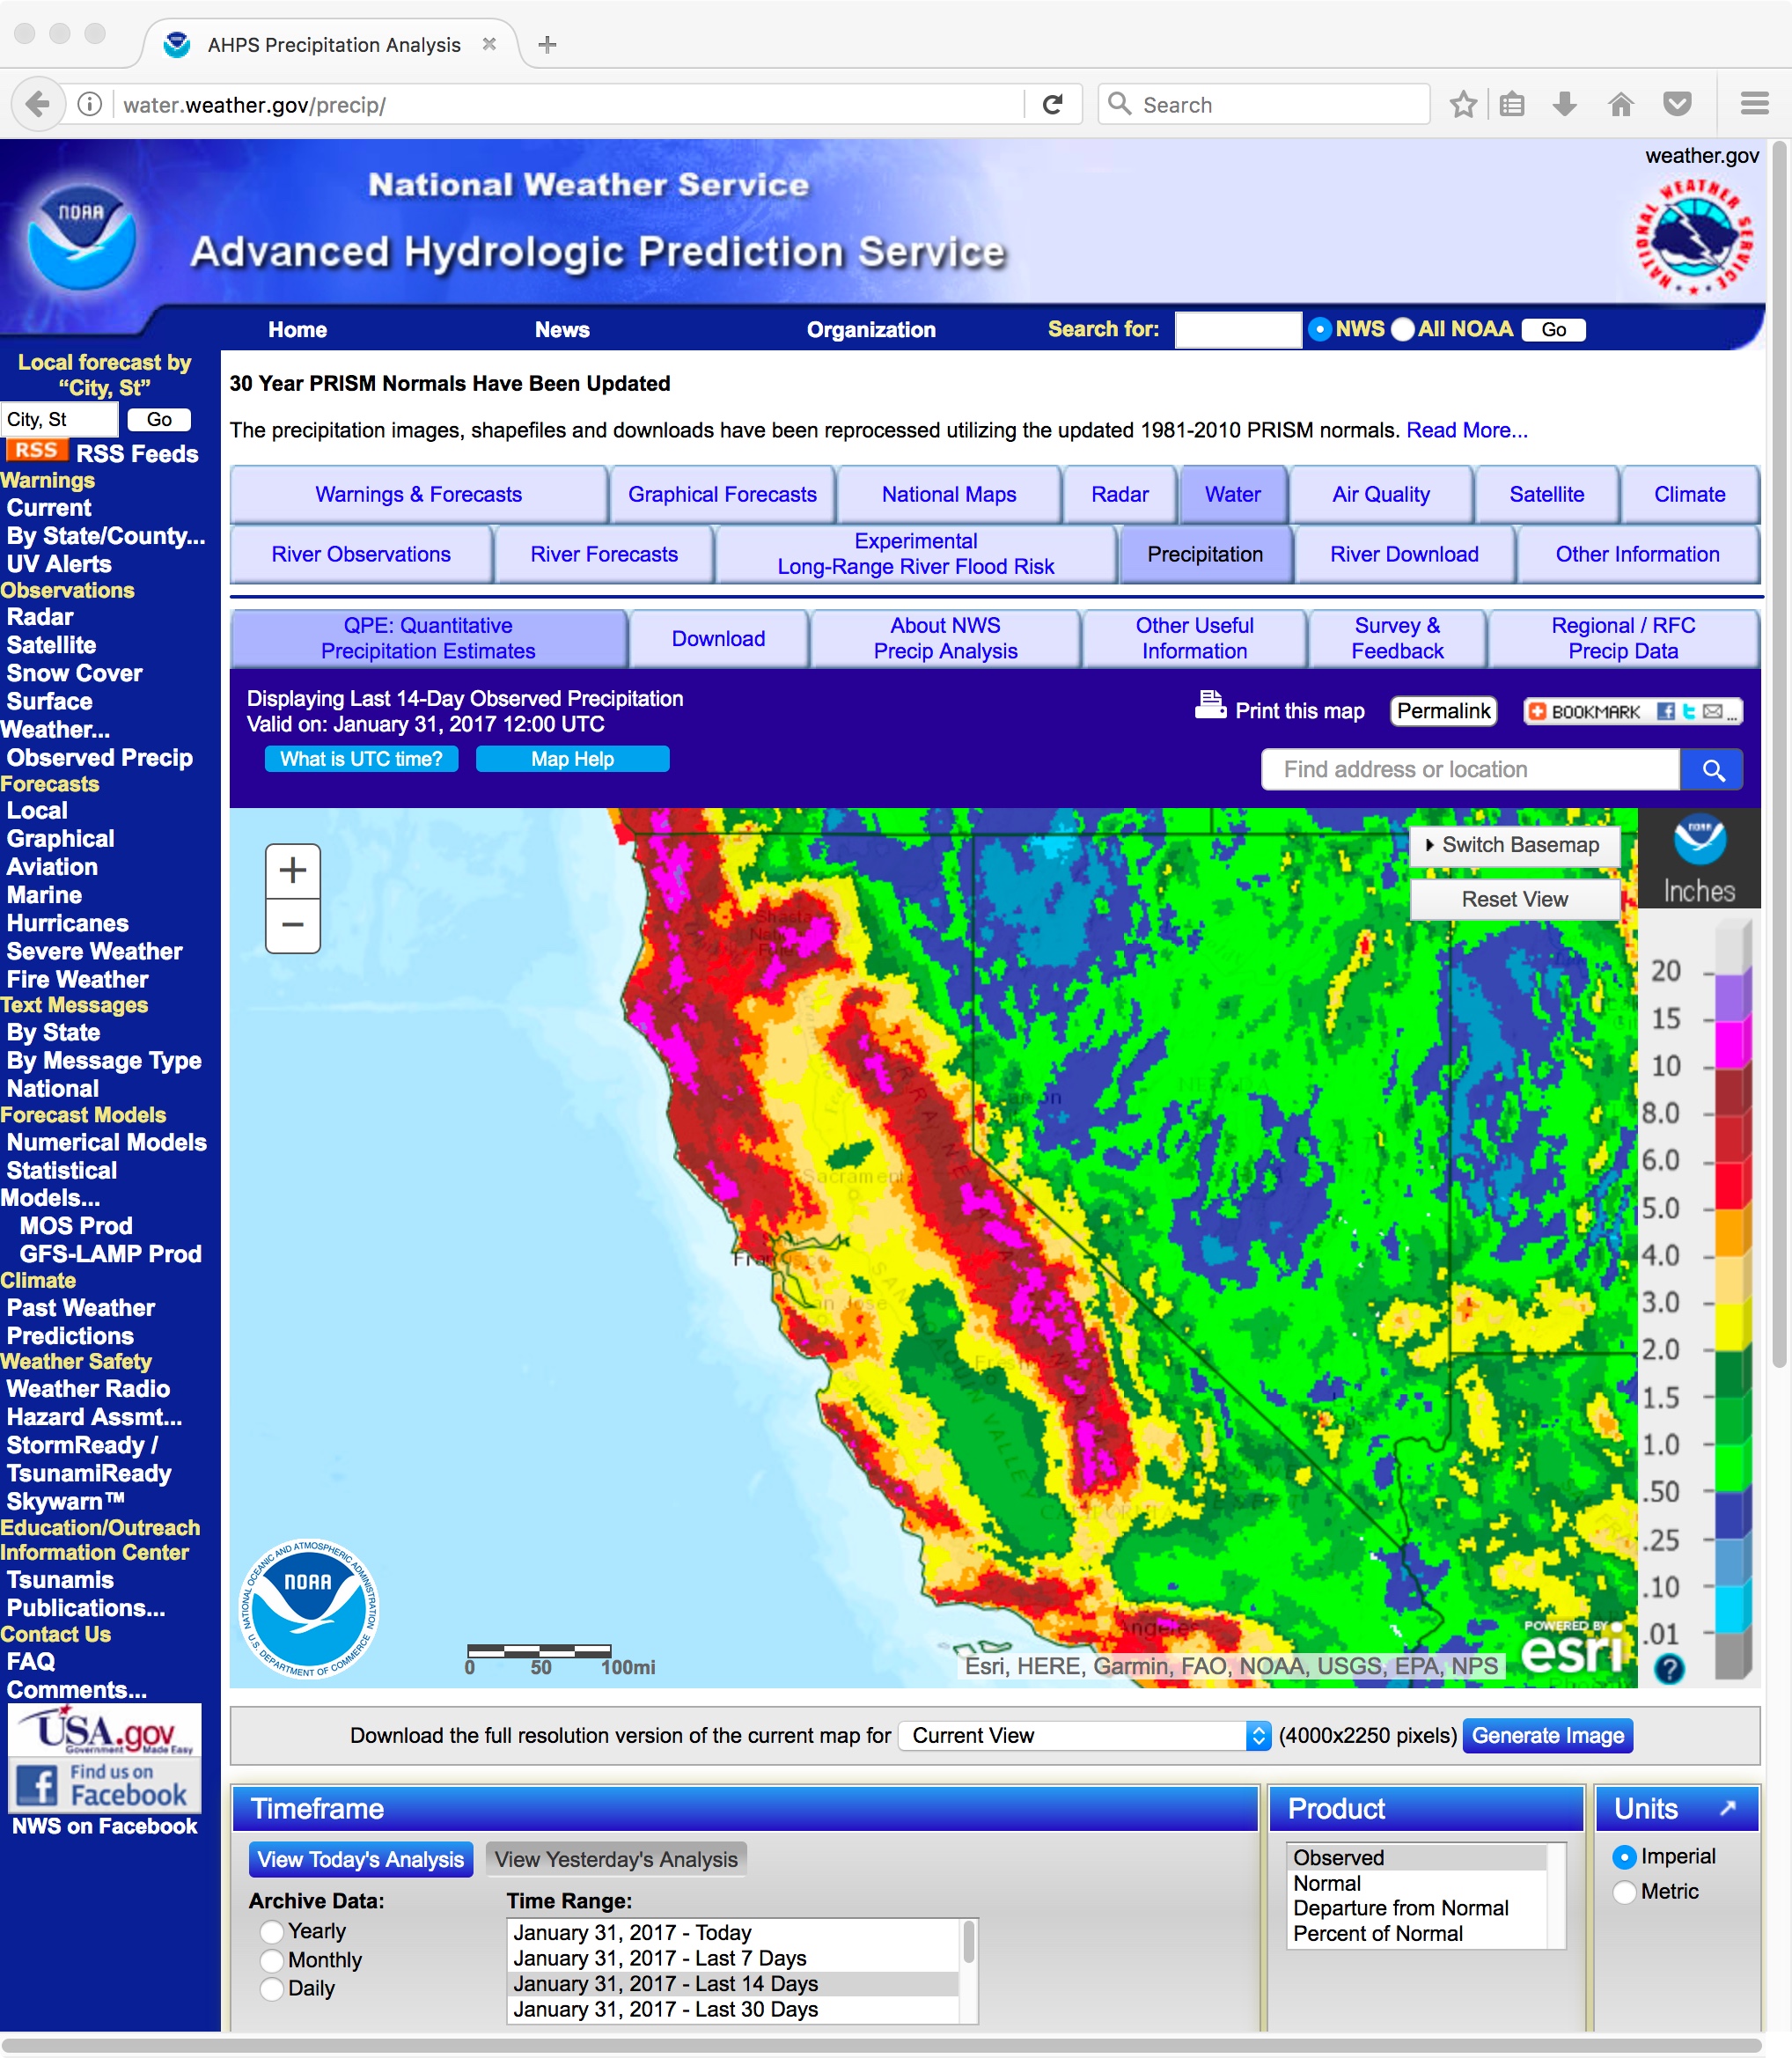
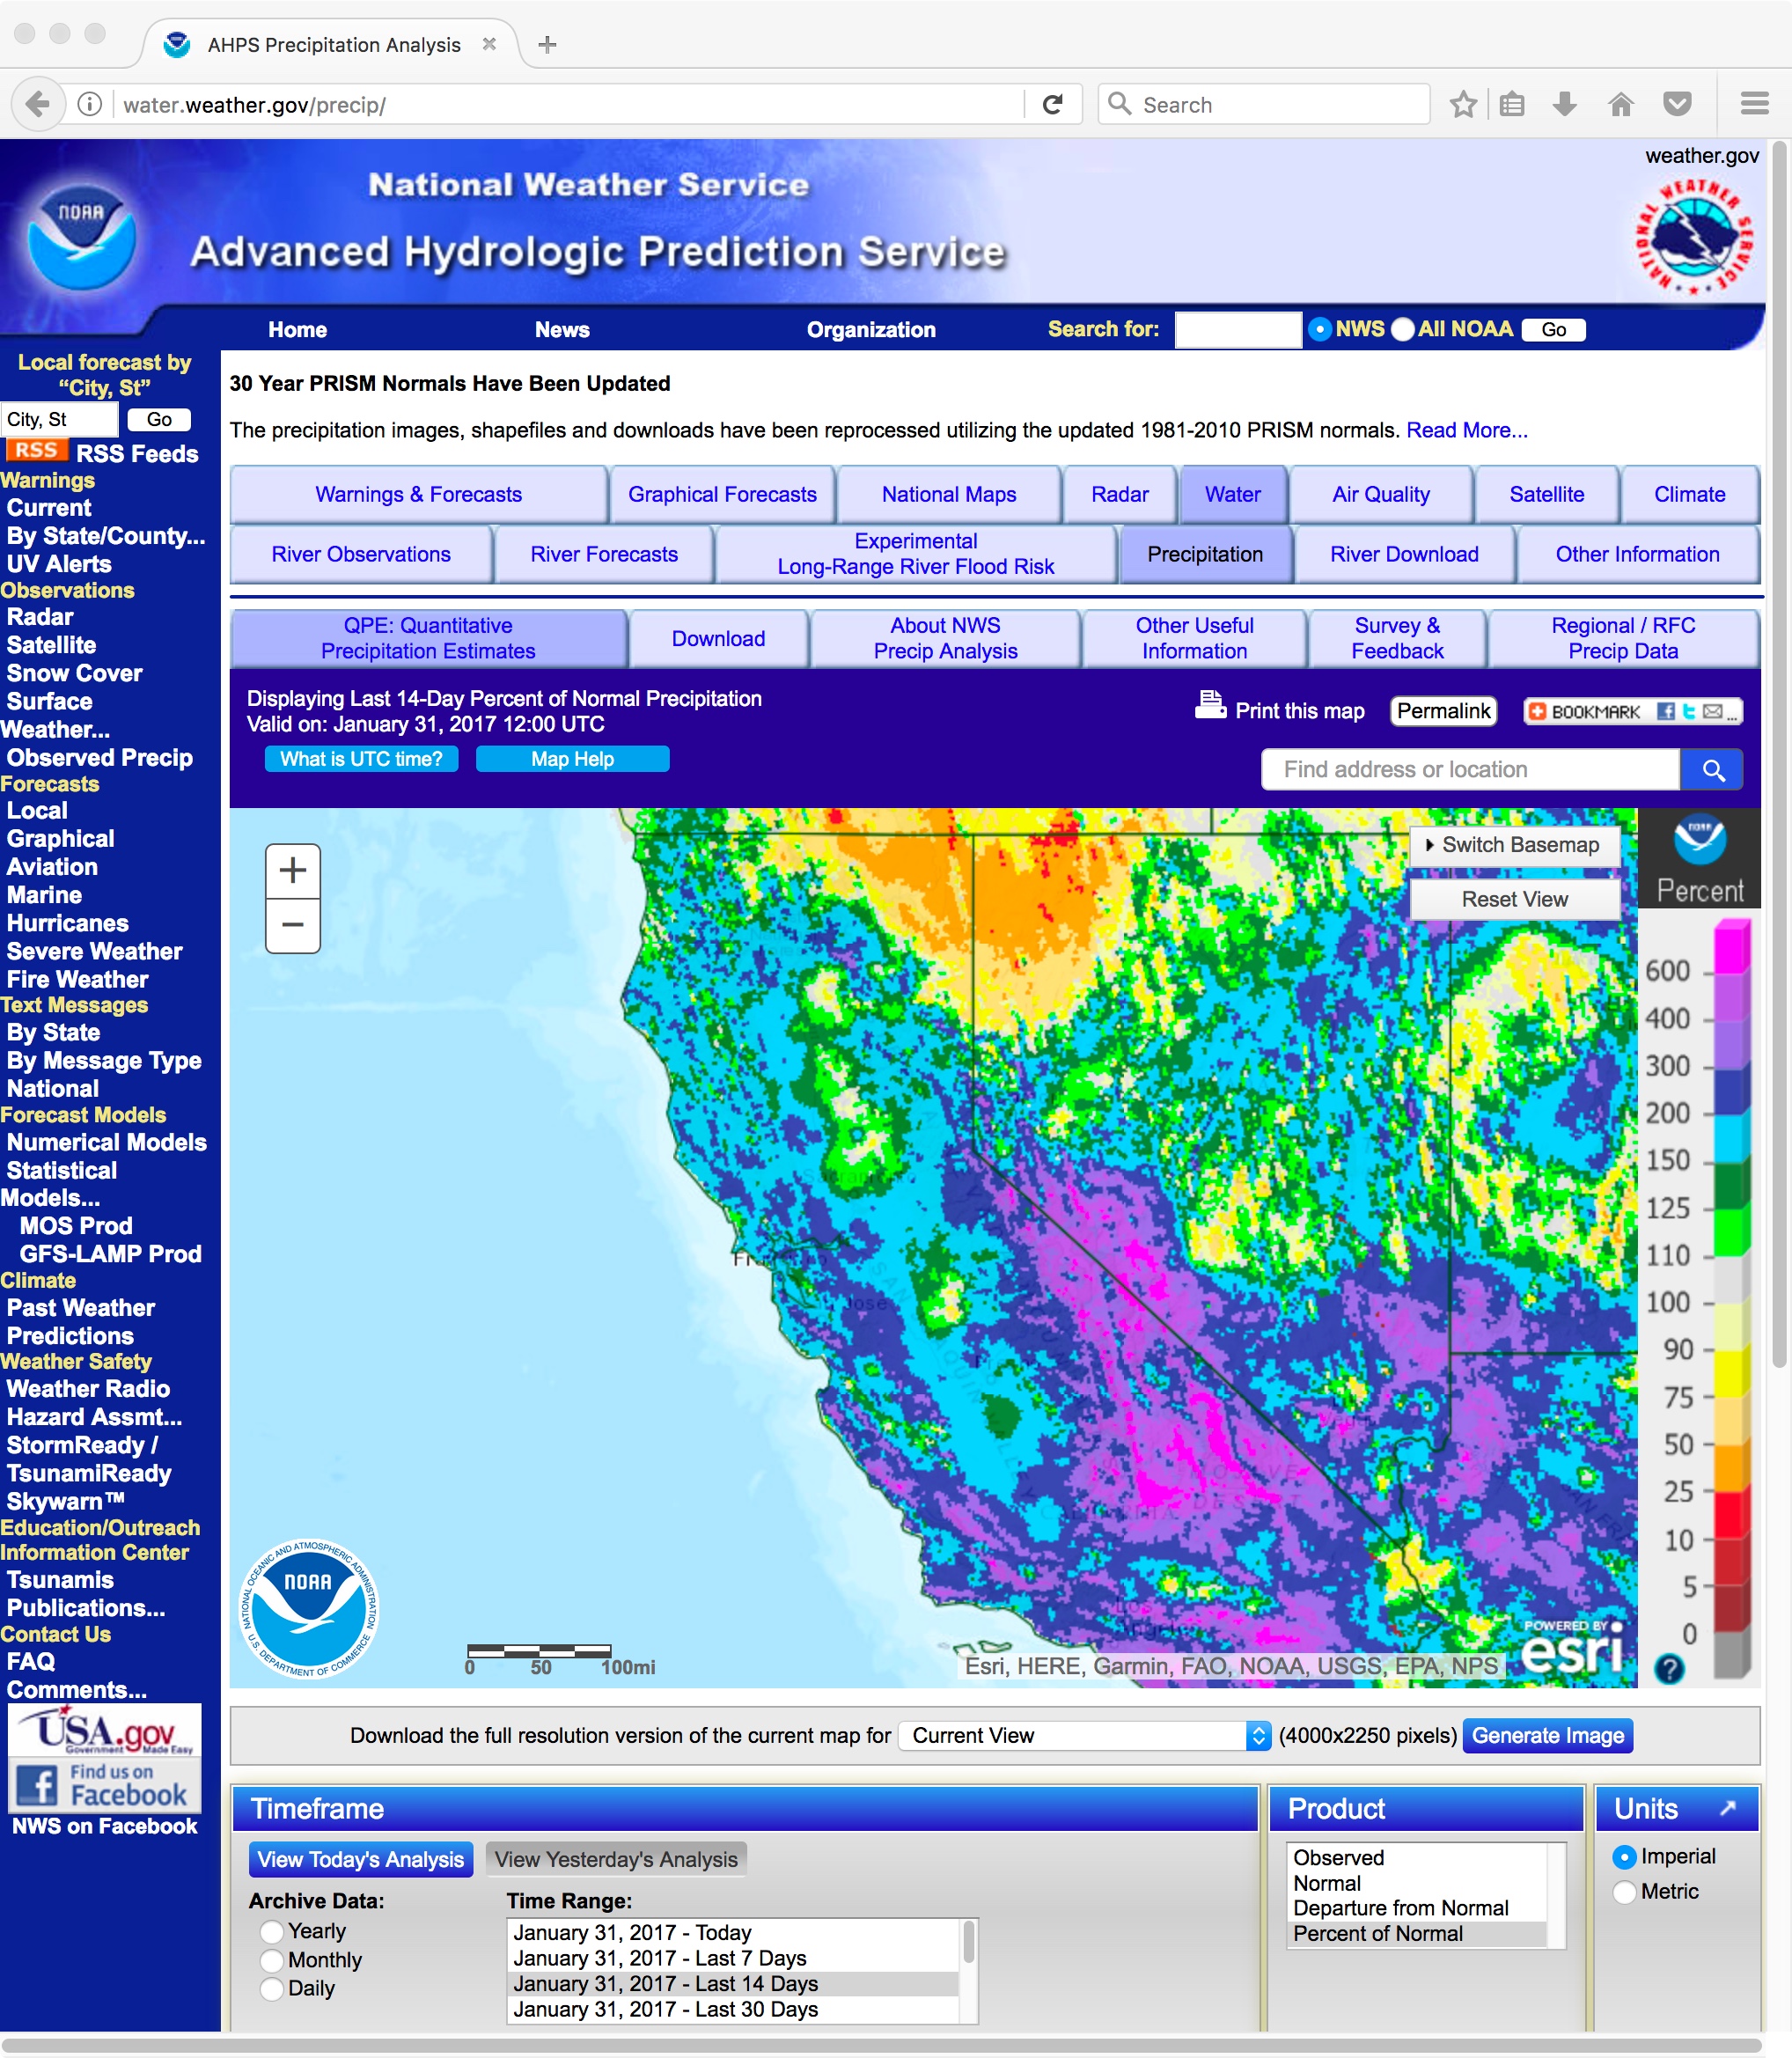
![Total liquid precipitation and Percent of normal precipitation for the 14-day period ending on 31 January 2017 [click to enlarge]](https://cimss.ssec.wisc.edu/satellite-blog/wp-content/uploads/sites/5/2017/01/170131_14day_Precip_Percent-of-normal_CA_anim.gif)
