One of the most popular GOES products is the True Color RGB. There’s a lot to like about it: a constantly updating full color view of the planet, watching clouds swirl above sapphire seas and emerald forests. It can be positively mesmerizing to watch loops of this product, at least until the sun sets, the terminator arrives, and the visible reflectances go away.
There is an important cacceat to remember, though. The GOES true color product isn’t really a true color image of the planet. The GOES ABI instrument is not like a consumer digital camera, in which separate channels record the red, blue, and green reflectance and assemble those into an easily recognizable photograph. Instead, while ABI has a blue channel (Channel 1, 0.47 microns) and a red channel (Channel 2, 0.64 microns), it doesn’t have a green channel. Instead, ground processing does a little trickery. Channel 3, at 0.86 microns, is very sensitive to vegetation. What we can do instead is create an RGB product where red is red, blue is (wait for it…) blue, and green is a channel that is strongly representative of surfaces that are green. Most of the time this works just fine for the majority of users.
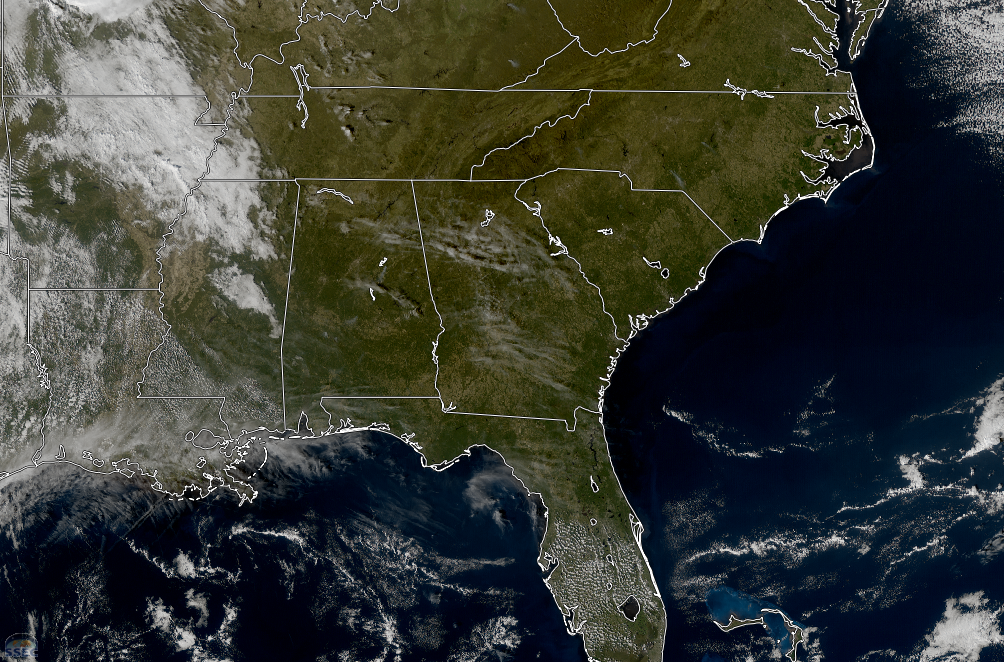
However, this all relies on the assumption that vegetation is green. But what happens if you have a lot of vegetation that isn’t green at all? How would that appear on the GOES True Color RGB? This image, taken on 17 November 2025, shows the southeastern United States as seen from GOES-19. Note how lush the forests in this region look. There’s lots of green throughout the region. If you were looking to identify where fall colors weer at their peak, it might be challenging to do so with this image.
VIIRS tells a different story. This image, obtained via direct broadcast, was taken at approximately the same time from the NOAA-21 satellite. The VIIRS instrument has true red, green, and blue channels, so a true color RGB is much closer to what our eyes would perceive if we were looking down from space. Note how the green areas of this image are much smaller in extent. Florida, southern Alabama, and the coastal regions of Georgia and South Carolina still retain much of their verdant colors as before. However, the hardwood forests of Appalachia, including the dense forests along the Tennessee / North Carolina border, are much browner than before.

The following slider allows you to directly compare the two images to see how they differ. Check out how the colors along the coasts, where trees are still green, are mostly the same between the two images, but they are very different in the forested regions where leaves have already turned.
This slider also does a good job of illustrating parallax and how cloud height exacerbates it. As you slide the bar back and forth, note that there’s very small displacements in the positions of the low clouds, like the popcorn convection throughout the Florida peninsula. However, the high cirrus (likely aged contrails) over Georgia and Alabama show a much greater horizontal displacement due to the very different scanning positions of the two instruments.
This simple example shows that it’s important to remember that the GOES ABI True Color product is really representing an idealized version of what we think the planet is supposed to look like, rather than a direct capture of what it actually looks like right now. Note that this is not as much of an issue with many other geostationary satellites. The Flexible Combined Imager (FCI) on EUMETSAT’s Meteosat-12, the Advanced Himawari Imager (AHI) on the Himawari series operated by Japan, and the Advanced Meteorological Imager (AMI) on South Korea’s GEOKOMPSAT-2a all have the necessary channels to produce full spectrum true color images. Note that this is not true for SEVIRI, still in operational use over the Indian Ocean on Meteosat-9 and in wide use in central and eastern Asia. EUMETSAT’s Natural Color RGB is a combination of 1.6 (red), 0.8 (green), and 0.6 (blue), which has even fewer visible channels than the GOES True Color.
View only this post Read Less