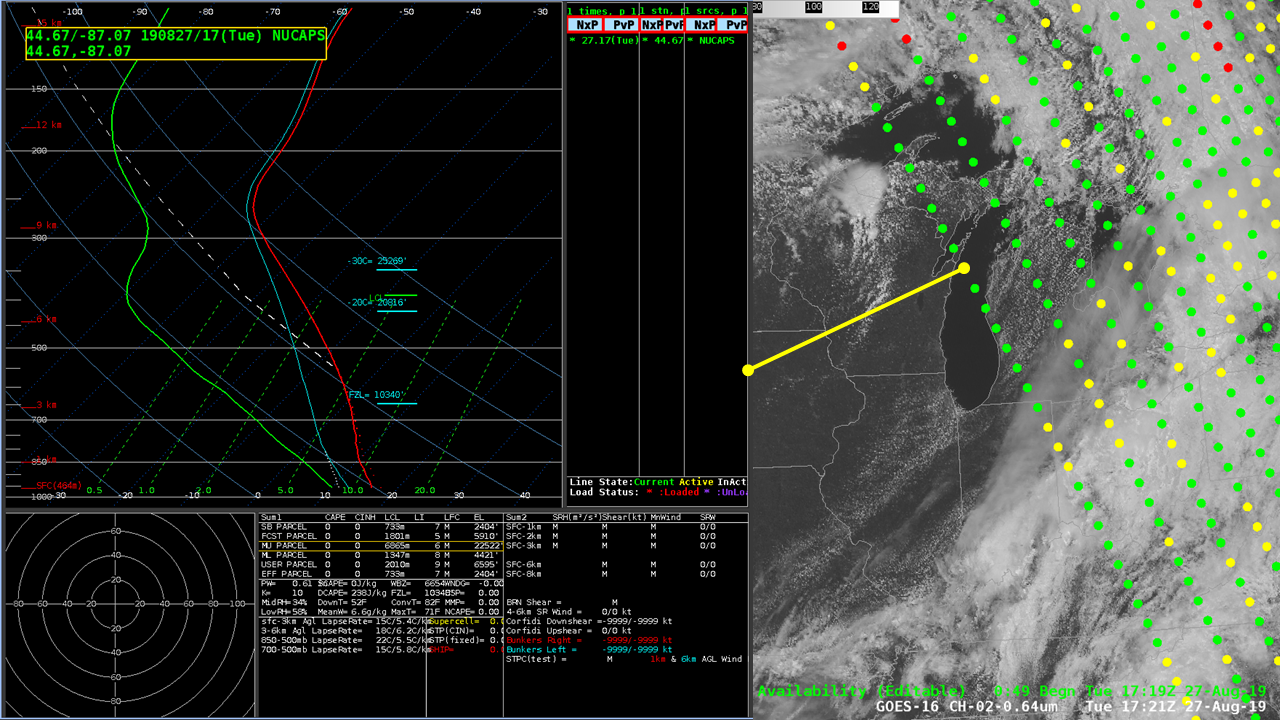
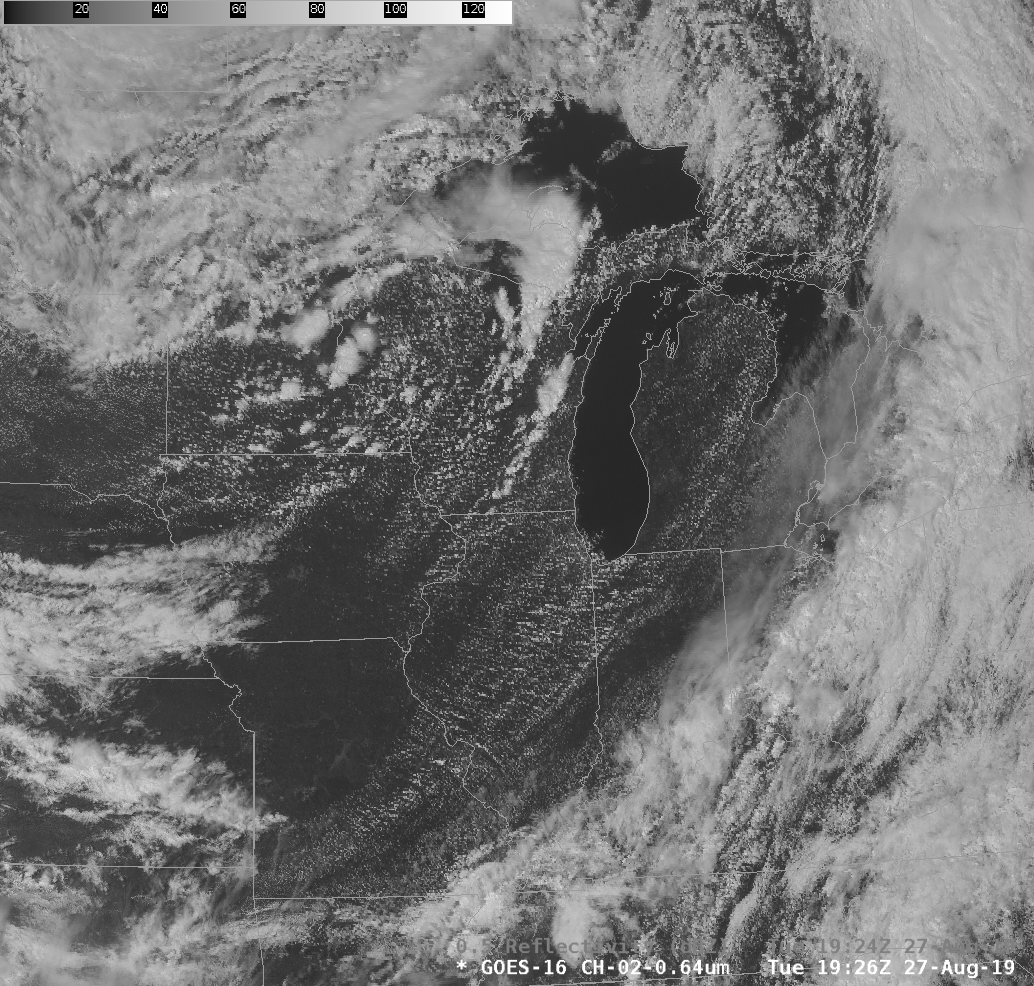
GOES-16 Visible Imagery (0.64 µm) at 1721 UTC on 27 August 2019. A swath of NOAA-20 NUCAPS soundings from 1718 UTC is also shown, and individual profiles from the Upper Peninsula of Michigan southeastward to southwest Lower Michigan are plotted. (Click to enlarge)
The animation above shows the 1721 UTC GOES-16 Visible (0.64 µm) image along with NUCAPS profile locations from a NOAA-20 overpass. Convection is approaching from the west, from central Wisconsin. NUCAPS soundings can give a good estimate for how far south that convective line might develop, and a north-south series of profiles is shown in the imagery above. Note in particular how soundings show increasing mid-level stability; a strong inversion between becomes apparent between the NUCAPS Sounding just south of Door County on the western short of Lake Michigan and over eastern Lake Michigan on the Michigan shoreline. This thermodynamic snapshot would argue that convection should not develop much farther south than central Lake Michigan! the 1926 UTC Visible image, below, toggled with radar, confirms this forecast.

GOES-16 Visible Imagery (0.64 µm) at 1926 UTC on 27 August 2019 — toggled with Base Reflectivity at 1924 UTC (Click to enlarge)
NUCAPS from one satellite will periodically, north of about 40 N, supply profiles on two consecutive passes. That happened on 27 August over Lake Michigan as might be expected given that the 1718 UTC pass had its westernmost swath over Lake Michigan. The animation below shows the swath from 1901 UTC. The strengthening inversion as you move south over Lake Michigan is apparent at 1901 UTC as well.

GOES-16 Visible Imagery (0.64 µm) at 1906 UTC on 27 August 2019. A swath of NOAA-20 NUCAPS soundings from 1901 UTC is also shown, and individual profiles over Lake Michigan Michigan are plotted. (Click to enlarge)
View only this post Read Less
![Suomi NPP VIIRS Visible (0.64 µm), Shortwave Infrared (3.74 µm) and Infrared Window (11.45 µm) images [click to enlarge]](https://cimss.ssec.wisc.edu/satellite-blog/wp-content/uploads/sites/5/2019/08/190822_suomiNPP_viirs_visible_shortwaveInfrared_infraredWindow_North_Pole_anim.gif)
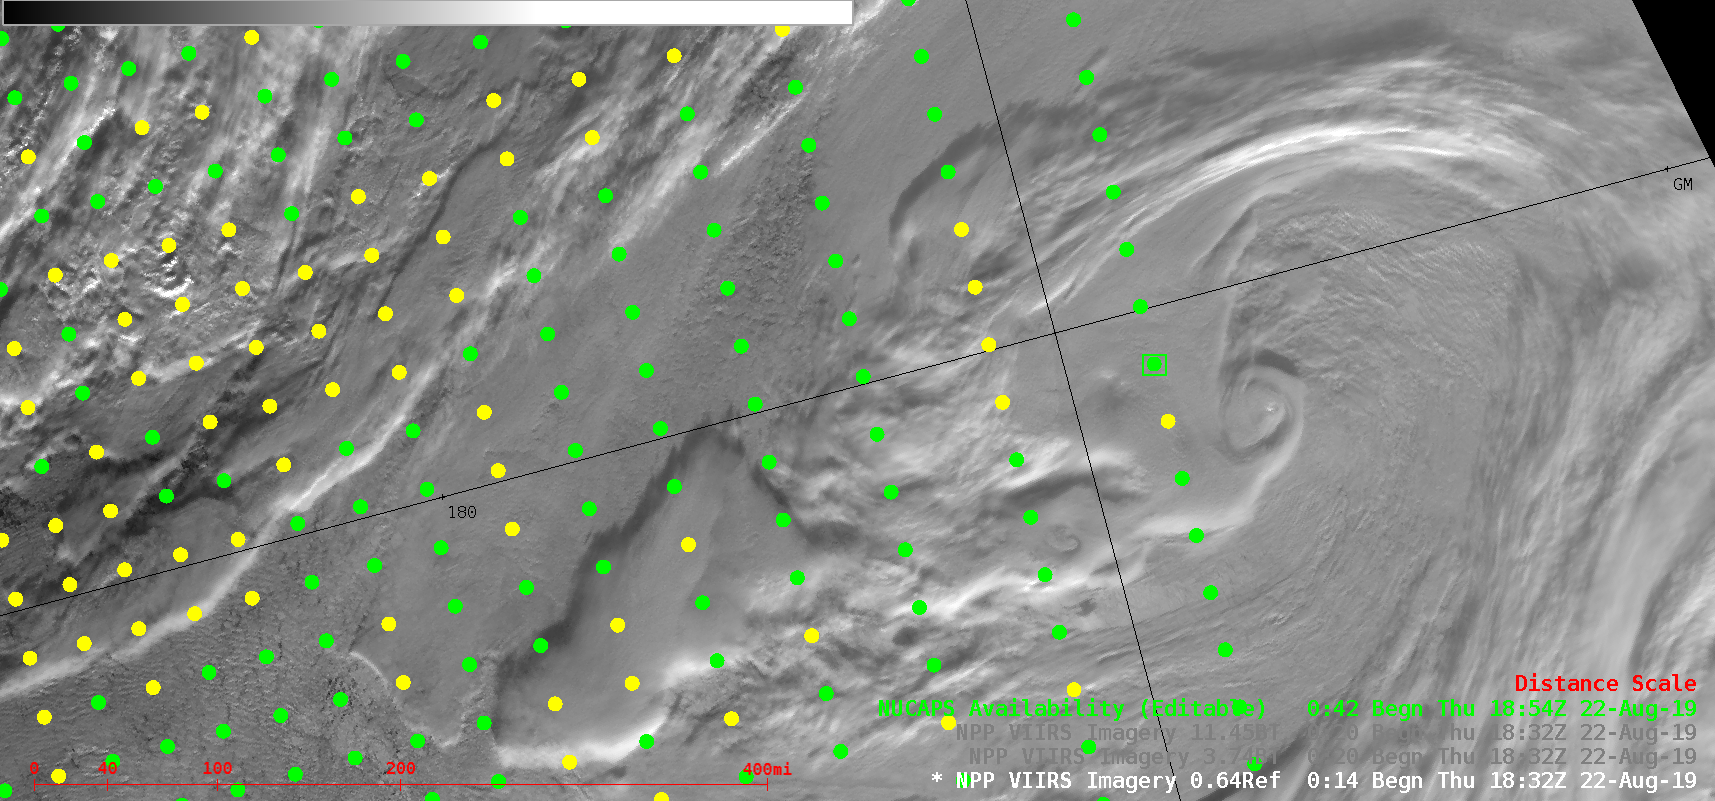
![Suomi NPP VIIRS Visible (0.64 µm) images, with plots of NUCAPS availability [click to enlarge]](https://cimss.ssec.wisc.edu/satellite-blog/wp-content/uploads/sites/5/2019/08/190822_suomiNPP_viirs_visible_noaa20_nucaps_North_Pole_anim.gif)
![NUCAPS temperature (red) and dew point (green) profiles [click to enlarge]](https://cimss.ssec.wisc.edu/satellite-blog/wp-content/uploads/sites/5/2019/08/190822_nucaps_profiles_North_Pole_anim.gif)
![GCOM-W1 AMSR2 sea ice concentration [click to enlarge]](https://cimss.ssec.wisc.edu/satellite-blog/wp-content/uploads/sites/5/2019/08/190822_seaice_NH.png)


![GOES-16 Shortwave Infrared (3.9 µm) images [click to play animation | MP4]](https://cimss.ssec.wisc.edu/satellite-blog/wp-content/uploads/sites/5/2019/08/190817_190818_goes16_shortwaveInfrared_Bolivia_anim.gif)
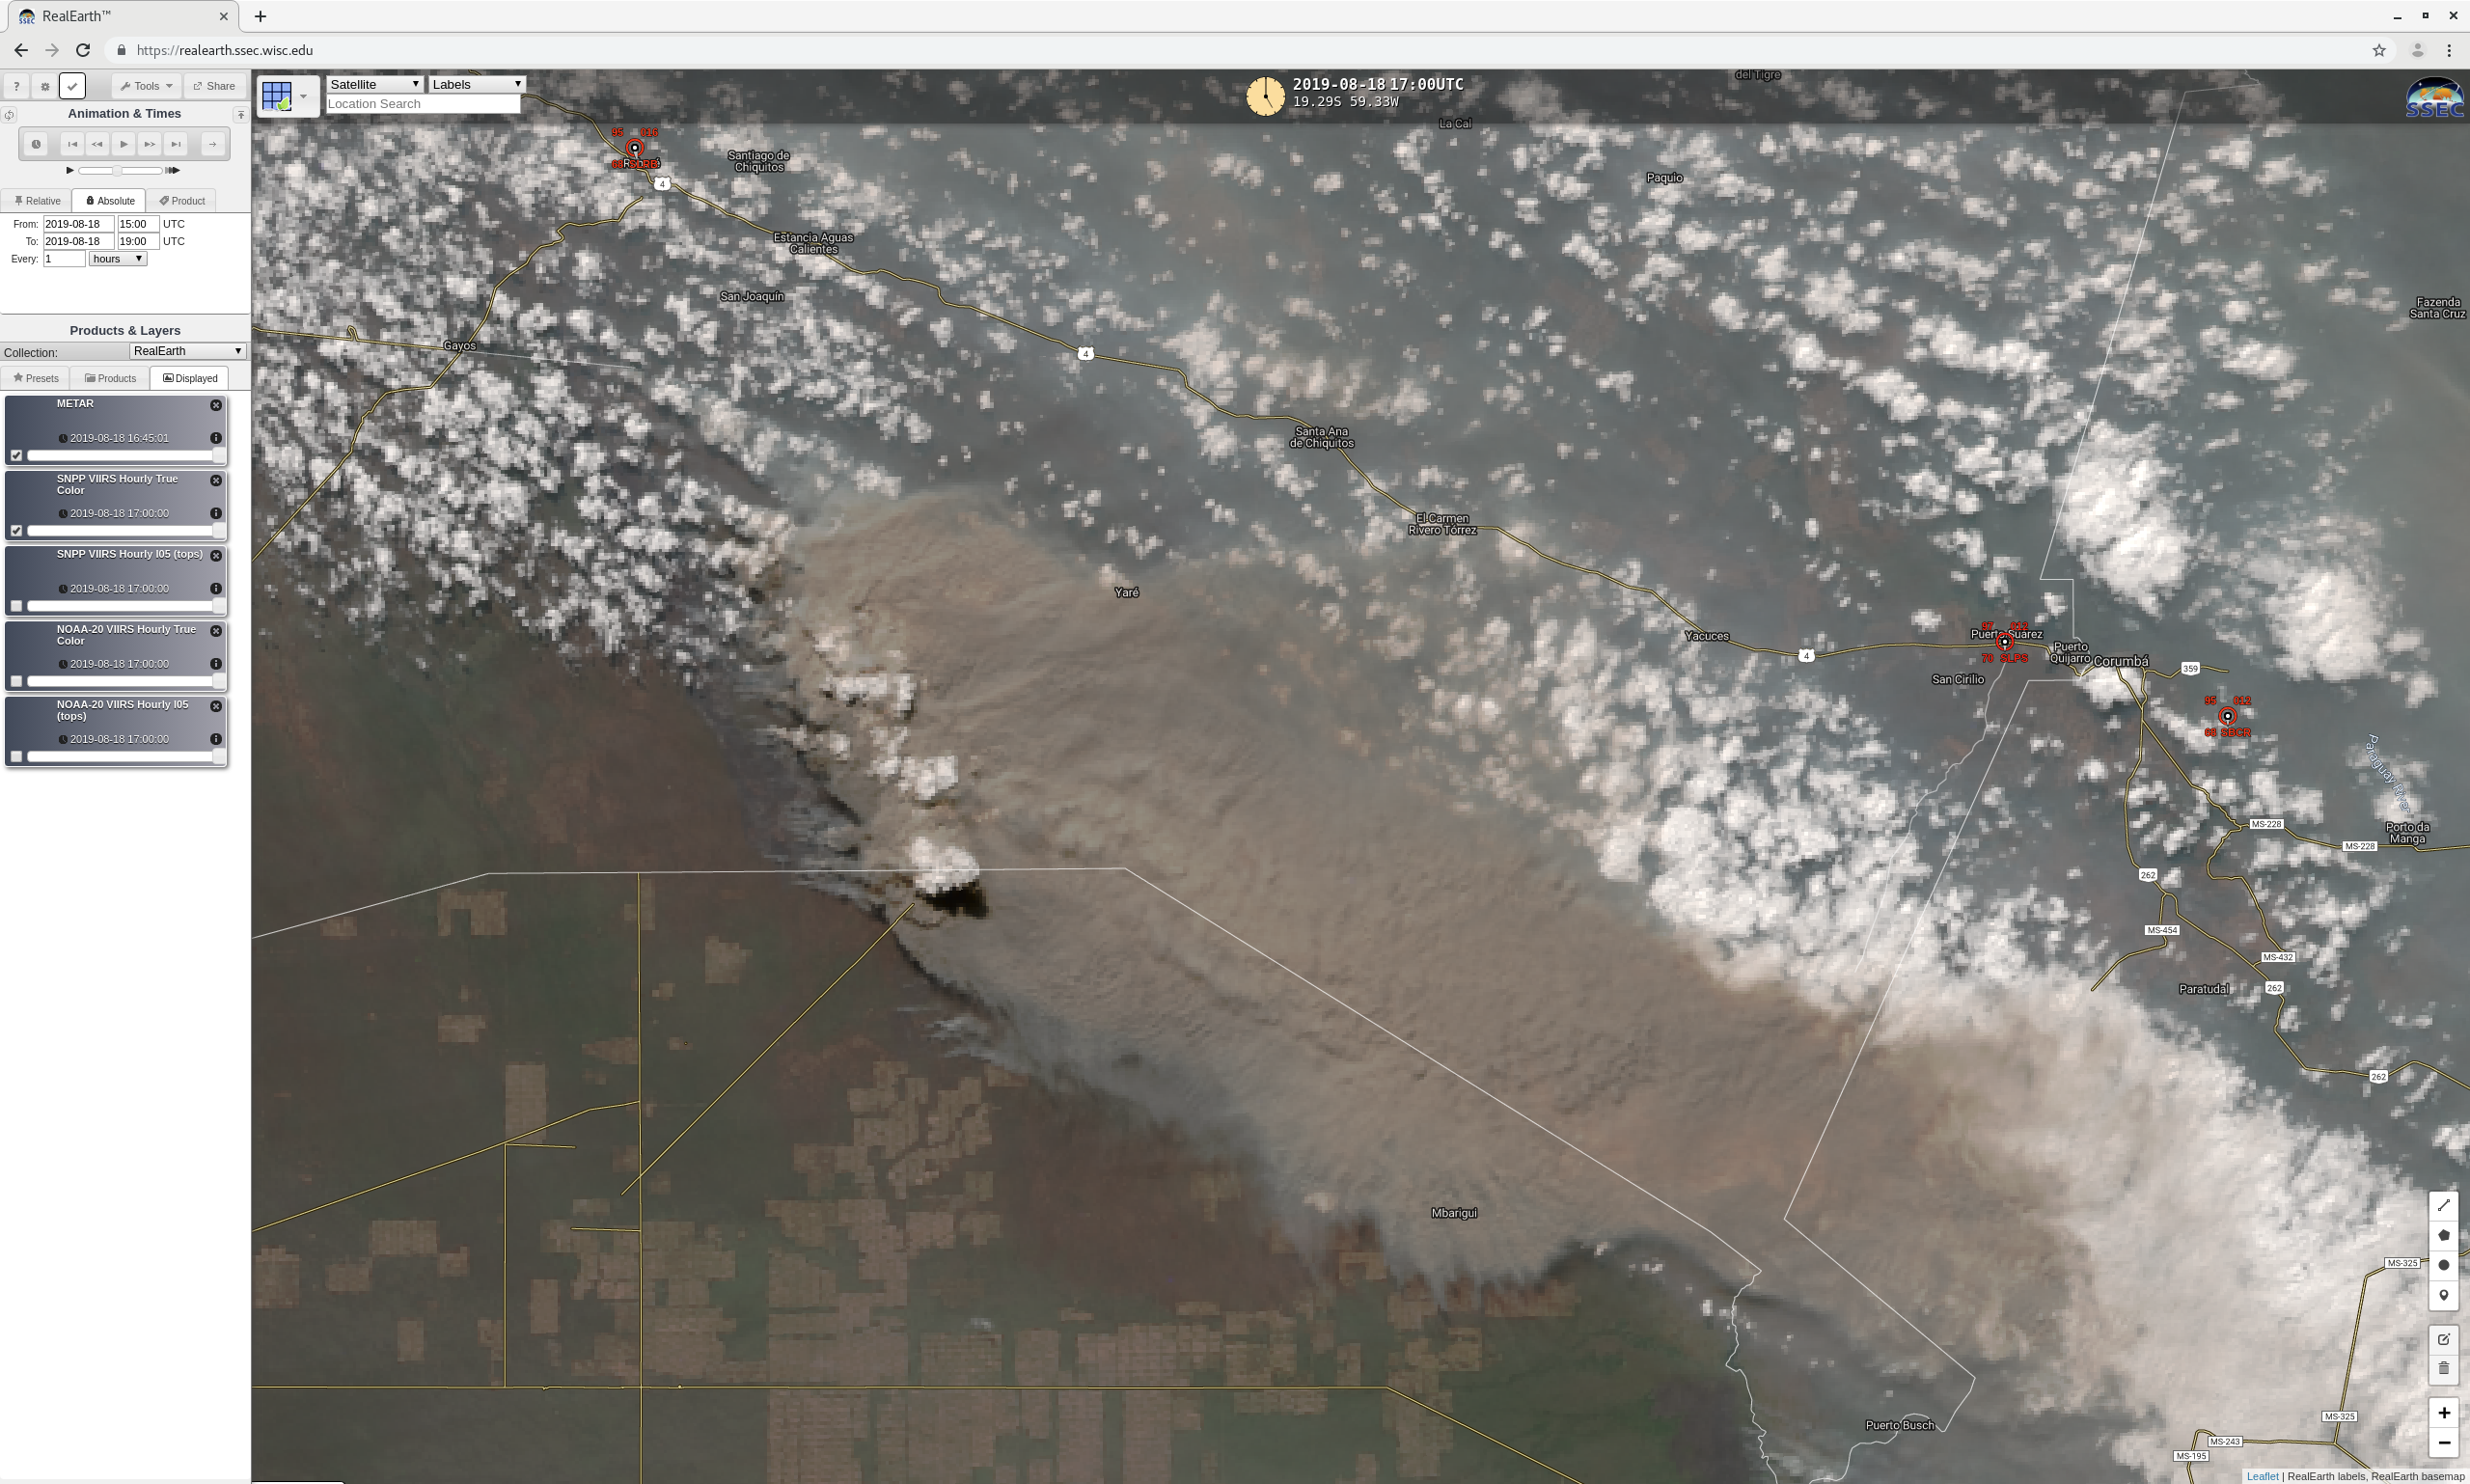
![Suomi NPP VIIRS True Color Red-Green-Blue (RGB) and Infrared Window (11.45 µm) images [click to enlarge]](https://cimss.ssec.wisc.edu/satellite-blog/wp-content/uploads/sites/5/2019/08/190818_17utc_suomiNPP_viirs_trueColor_infraredWindow_Bolivia_pyrocb_anim.gif)
![Time series of surface report data from Robore, Bolivia [click to enlarge]](https://cimss.ssec.wisc.edu/satellite-blog/wp-content/uploads/sites/5/2019/08/190818_SLRB_SFCMG.GIF)
![GOES-16 “Red” Visible (0.64 µm, top), Shortwave Infrared (3.9 µm, middle) and “Clean” Infrared Window (10.35 µm, bottom) images [click to play animation | MP4]](https://cimss.ssec.wisc.edu/satellite-blog/wp-content/uploads/sites/5/2019/08/190825_goes16_visible_shortwaveInfrared_longwaveInfraredWindow_Bolivia_pyrocb_anim.gif)
![Suomi NPP and NOAA-20 VIIRS True Color RGB and Infrared Window (11.45 µm) images [click to enlarge]](https://cimss.ssec.wisc.edu/satellite-blog/wp-content/uploads/sites/5/2019/08/190825_1712utc_suomiNPP_1802utc_noaa20_trueColor_infraredWindow_Bolivia_pyroCb_anim.gif)
