During the course of multiple intrusions of arctic air across the Lower 48 states during early November 2019, a variety of lake-effect, river-effect and bay-effect cloud features were generated — many of which produced varying intensities of snowfall. GOES-16 (GOES-East) “Red” Visible (0.64 µm), “Clean:” Infrared Window (10.35 µm) and... Read More
GOES-16 “Red” Visible (0.64 µm), “Clean” Infrared Window (10.35 µm) and Day Cloud Phase Distinction RGB images on 07 November [click to play animation | MP4]
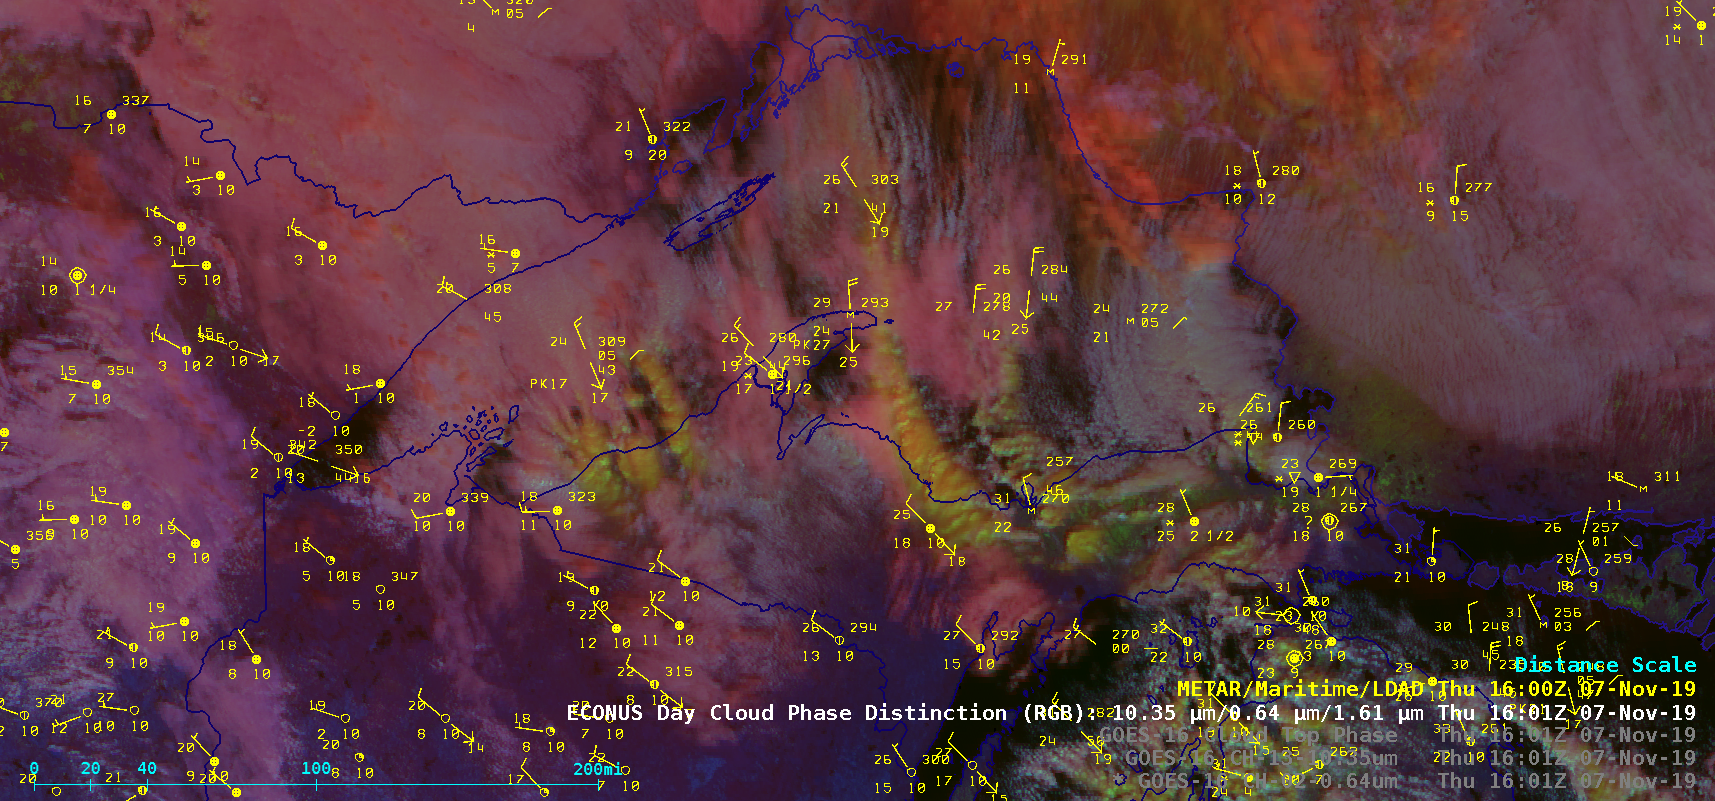
During the course of multiple intrusions of arctic air across the Lower 48 states during early November 2019, a variety of lake-effect, river-effect and bay-effect cloud features were generated — many of which produced varying intensities of snowfall. GOES-16
(GOES-East) “Red” Visible (0.64 µm), “Clean:” Infrared Window (10.35 µm) and Day Cloud Phase Distinction Red-Green-Blue (RGB) images on
07 November (above) showed lake-effect clouds streaming south-southeastward across Lake Superior. The Day Cloud Phase Distinction RGB images (in tandem with the Infrared images) helped to highlight which cloud features had glaciated and were therefore more capable of producing moderate to heavy lake-effect snow; the dominant band yielded
5-10 inches of snowfall in the central part of northern Michigan.
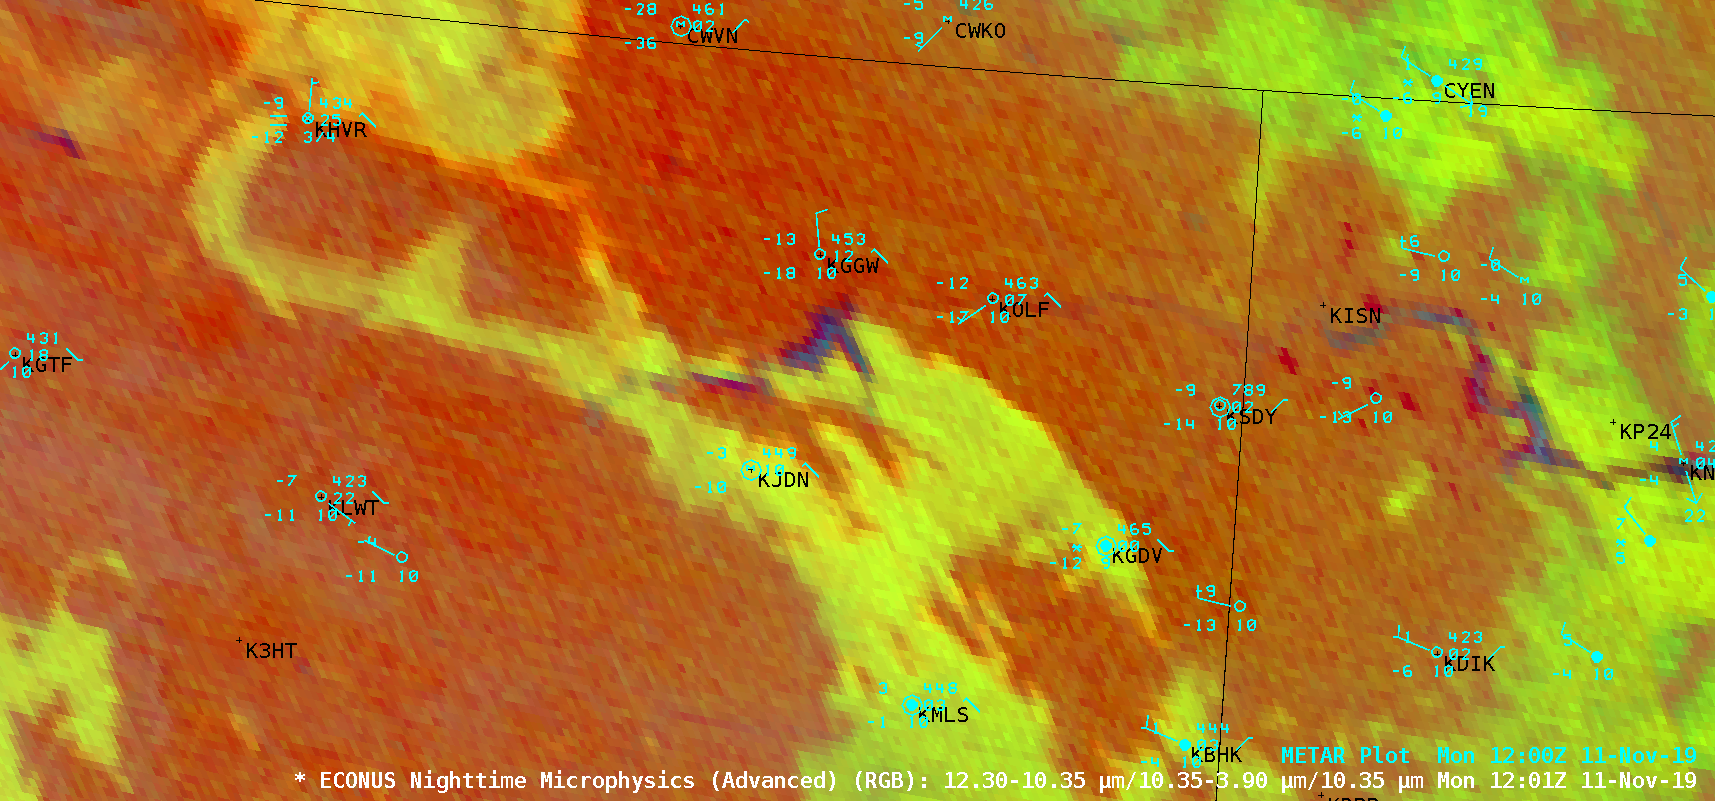
On 11 November, GOES-16 Nighttime Microphysics RGB images (below) displayed lake-effect clouds originating from the still-unfrozen waters of Fort Peck Lake in northeastern Montana — these clouds did produce a brief period of light snowfall downstream at Glendive (KGDV). On this particular morning, the lowest temperature in the US occurred in north-central Montana, with -30ºF reported north of Rudyard.
![GOES-16 Nighttime Cloud Phase Distinction RGB images on 11 November [click to play animation | MP4]](https://cimss.ssec.wisc.edu/satellite-blog/wp-content/uploads/sites/5/2019/11/mt_ntmp-20191111_120122.png)
GOES-16 Nighttime Microphysics RGB images on 11 November [click to play animation | MP4]
On
12 November, cold air moving southward across the Lower Mississippi Valley produced horizontal convective roll clouds which were evident in GOES-16 Nighttime Microphysics RGB and subsequent Visible images after sunrise
(below) — one of these narrow cloud bands was likely enhanced by latent heat fluxes as it passed over the comparatively-warm waters of the Mississippi River, and produced accumulating snowfall in downtown Memphis. Note that since Memphis International Airport KMEM was located just east of the cloud band, no accumulating snow was reported there (only a brief snow flurry
around 1430 UTC).
![GOES-16 Nighttime Microphysics RGB and "Red" Visible (0.64 µm) images on 12 November [click to play animation | MP4]](https://cimss.ssec.wisc.edu/satellite-blog/wp-content/uploads/sites/5/2019/11/mem_vis-20191112_133622.png)
GOES-16 Nighttime Microphysics RGB and “Red” Visible (0.64 µm) images on 12 November [click to play animation | MP4]
Aqua MODIS Sea Surface Temperature values along parts of the Mississippi River were as warm as the mid-40s F
(below).
![MODIS Sea Surface Temperature product at 1848 UTC on 12 November; rivers are plotted in red [click to enlarge]](https://cimss.ssec.wisc.edu/satellite-blog/wp-content/uploads/sites/5/2019/11/mem_modis_sst-20191112_184800.png)
Aqua MODIS Sea Surface Temperature product at 1848 UTC on 12 November; rivers are plotted in red [click to enlarge]
On
13 November, as the cold air was moving off the US East Coast, GOES-16 Infrared images
(below) revealed bay-effect cloud plumes which developed over Chesapeake Bay and Delaware Bay — the Chesapeake Bay plume produced brief periods of light snow at Oceana Naval Air Station in Virginia Beach
KNTU from 06-10 UTC (and possibly contributed to snowfall farther south at Elizabeth City, North Carolina
KECG).
![GOES-16 "Clean" Infrared Window (10.35 µm) images on 12 November [click to play animation | MP4]](https://cimss.ssec.wisc.edu/satellite-blog/wp-content/uploads/sites/5/2019/11/G16_IR_CHESBAY_SNOW_13NOV2019_B13_2019317_090123_GOES-16_0001PANEL_FRAME00073.GIF)
GOES-16 “Clean” Infrared Window (10.35 µm) images on 12 November [click to play animation | MP4]
Terra MODIS Sea Surface Temperature values in Chesapeake Bay and Delaware Bay were in the lower to middle 50s F where the bay-effect cloud plumes were originating
(below).
![Terra MODIS Sea Surface Temperature product and Visible (0.65 µm) image at 1613 UTC [click to enlarge]](https://cimss.ssec.wisc.edu/satellite-blog/wp-content/uploads/sites/5/2019/11/191113_1613utc_terra_modis_seaSurfaceTemperature_visible_Chesapeake_Bay_Delaware_Bay_anim.gif)
Terra MODIS Sea Surface Temperature product and Visible (0.65 µm) image at 1613 UTC [click to enlarge]
View only this post
Read Less

![GOES-16 Nighttime Cloud Phase Distinction RGB images on 11 November [click to play animation | MP4]](https://cimss.ssec.wisc.edu/satellite-blog/wp-content/uploads/sites/5/2019/11/191111_goes16_nighttimeMicrophysics_MT_anim.gif)
![GOES-16 Nighttime Microphysics RGB and "Red" Visible (0.64 µm) images on 12 November [click to play animation | MP4]](https://cimss.ssec.wisc.edu/satellite-blog/wp-content/uploads/sites/5/2019/11/191112_goes16_nighttimeMicrophysics_visible_Memphis_snow_anim.gif)
![GOES-16 "Clean" Infrared Window (10.35 µm) images on 12 November [click to play animation | MP4]](https://cimss.ssec.wisc.edu/satellite-blog/wp-content/uploads/sites/5/2019/11/191112_191113_goes16_infrared_Chesapeake_Bay_effect_snow_anim.gif)
![EUMETSAT Meteosat-11 Visible (0.8 µm) images, with hourly plots of surface reports [click to play animation | MP4]](https://cimss.ssec.wisc.edu/satellite-blog/wp-content/uploads/sites/5/2019/11/191111_meteosat11_visible_Medicane_anim.gif)
![VIIRS True Color RGB and Infrared Window (11.45 µm) images from NOAA-20 and Suomi NPP [click to enlarge]](https://cimss.ssec.wisc.edu/satellite-blog/wp-content/uploads/sites/5/2019/11/191111_noaa20_suomiNPP_viirs_trueColorRGB_infraredWindow_Medicane_Trudy_anim.gif)
![Time series of surface observation data from Menorca, Spain [click to enlarge]](https://cimss.ssec.wisc.edu/satellite-blog/wp-content/uploads/sites/5/2019/11/191111_LEMH_SFCMG.GIF)
![Time series of surface observation data from Jijel, Algeria [click to enlarge]](https://cimss.ssec.wisc.edu/satellite-blog/wp-content/uploads/sites/5/2019/11/191111_DAAV_SFCMG.GIF)
![Himawari-8 Shortwave Infrared (3.9 µm) images, with hourly plots of surface reports [click to play animation | MP4]](https://cimss.ssec.wisc.edu/satellite-blog/wp-content/uploads/sites/5/2019/11/191108_himawari8_shortwaveInfrared_Australia_fires_anim.gif)
![Himawari-8 Longwave Infrared Window (10.4 µm) images, with hourly plots of surface reports [click to play animation | MP4]](https://cimss.ssec.wisc.edu/satellite-blog/wp-content/uploads/sites/5/2019/11/191108_himawari8_longwaveInfraredWindow_Australia_fires_anim.gif)
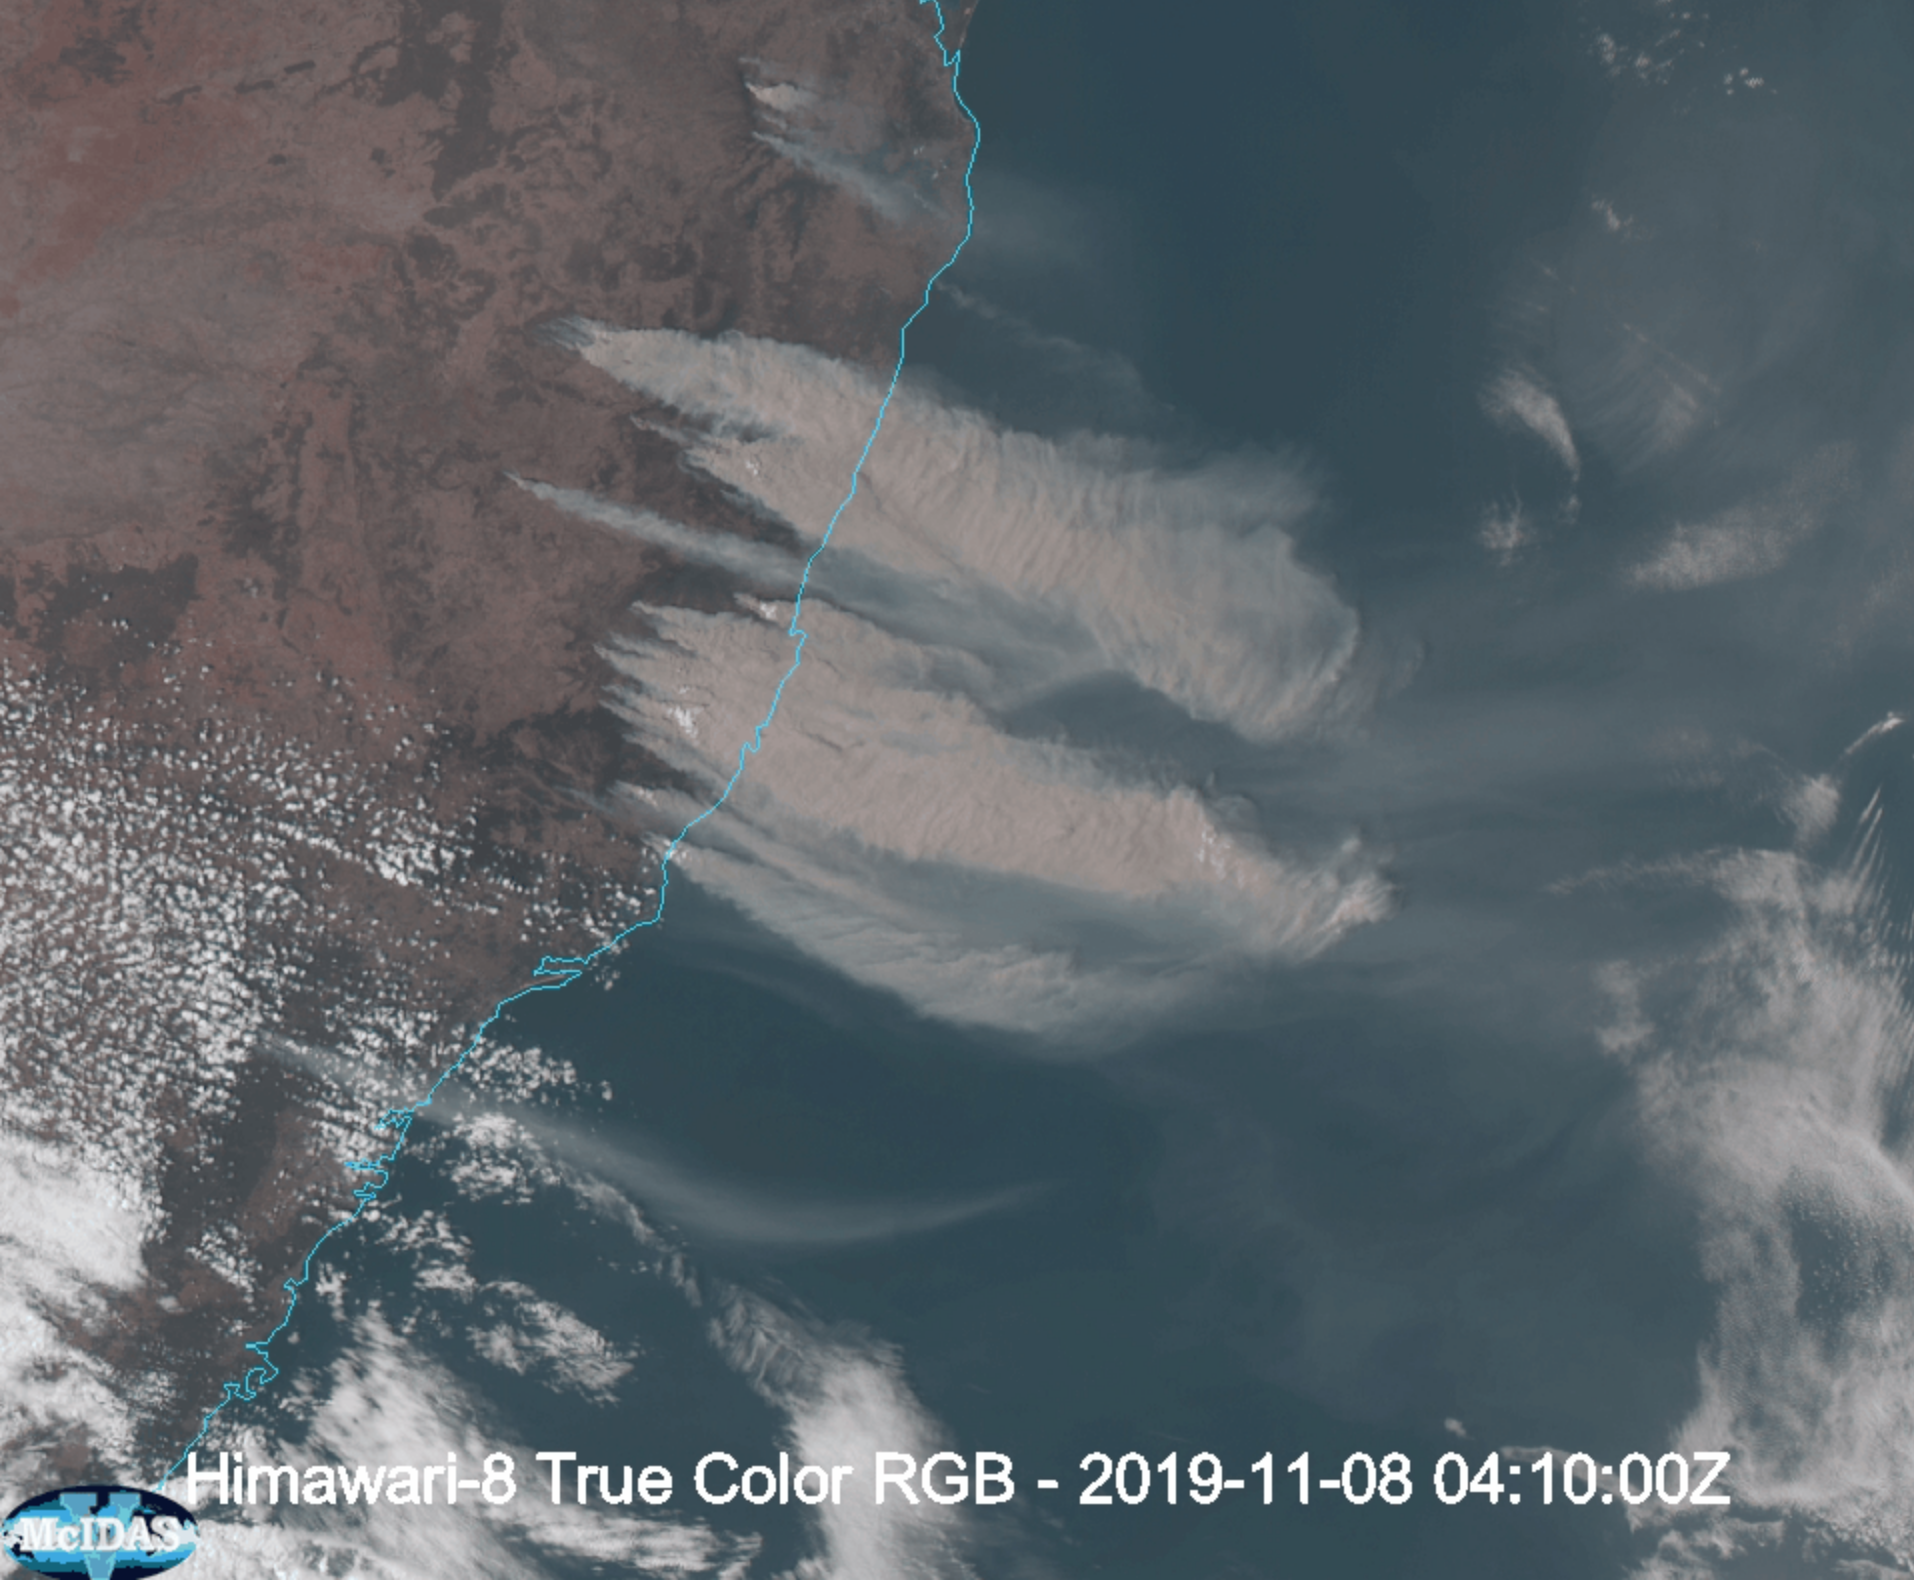
![Himawari-8 True Color RGB images (credit: Bob Carp, SSEC) [click to play animation | MP4]](https://cimss.ssec.wisc.edu/satellite-blog/wp-content/uploads/sites/5/2019/11/191108_himawari8_trueColorRGB_anim.gif)
![Suomi NPP VIIRS True Color RGB + Shortwave Infrared (4.1 µm) imagery at 0328 UTC [click to enlarge]](https://cimss.ssec.wisc.edu/satellite-blog/wp-content/uploads/sites/5/2019/11/191108_0328utc_suomiNPP_viirs_trueColorRGB_shortwaveInfrared.jpg)
![Suomi NPP VIIRS True Color RGB image + TROPOMI Tropospheric Vertical Column NO2 [click to enlarge]](https://cimss.ssec.wisc.edu/satellite-blog/wp-content/uploads/sites/5/2019/11/NPP_TROPOMI_NO2.gif)
![NOAA-20 and Suomi NPP VIIRS True Color RGB images [click to enlarge]](https://cimss.ssec.wisc.edu/satellite-blog/wp-content/uploads/sites/5/2019/11/191108_noaa20_suomiNPP_viirs_trueColorRGB_Australia_brushfires_anim.gif)
![Time series of surface report data from Grafton, New South Wales [click to enlarge]](https://cimss.ssec.wisc.edu/satellite-blog/wp-content/uploads/sites/5/2019/11/191108_YGFN_SFCMG.GIF)
