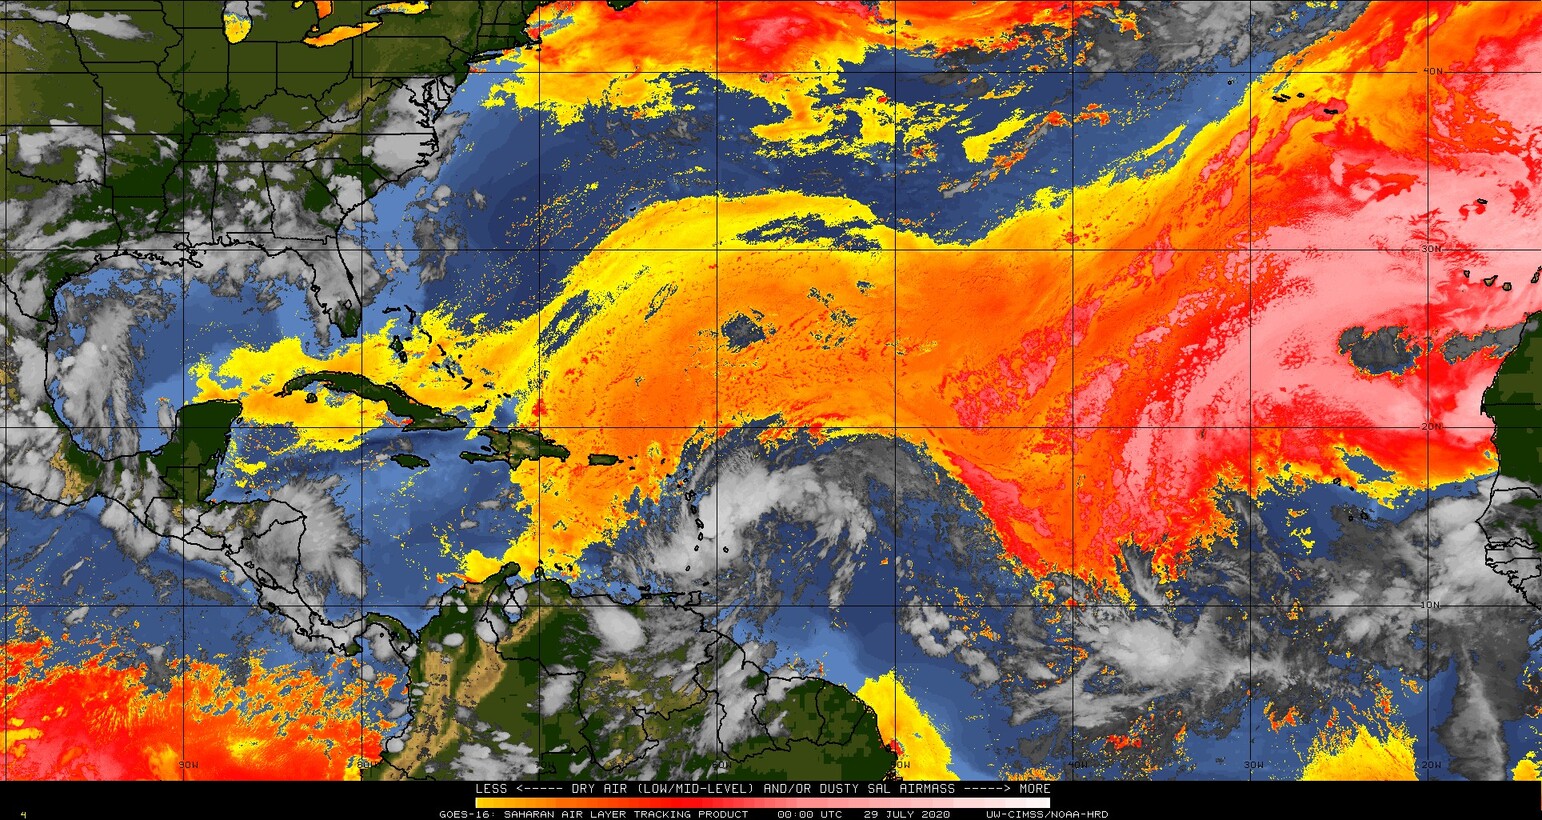

Saharan Air Layer (SAL) analysis at 1500 UTC on 29 July 2020 (Click to enlarge)
An analysis of the Saharan Air Layer, above (from this website), shows dry conditions stretching from Africa to the southwestern Atlantic, wrapping around the clouds associated with a strong tropical disturbance that is forecast to move northwestward over the Lesser and Greater Antilles in the next couple days. (Both the dry air and the presence of high terrain in the Antilles will likely affect the development and structure of this storm).
The Saharan Air Layer is accompanied by an Elevated Mixed Layer (EML) that was apparent in the 0000 UTC Upper-Air sounding from San Juan (TJSJ), as shown below (from this site). (At 0000 UTC, Puerto Rico was entrenched within the SAL air as shown in this analysis). Note the steep lapse rate from 800 to 550 mb and the strong east winds in the layer. By 1200 UTC, moist air moving in from the east had altered the EML.
Skew-T of temperature and pressure, 0000 UTC on 29 July 2020, at station 78526 (TJSJ, San Juan, Puerto Rico) (Click to enlarge)
NOAA-20 overflew this region just after 0600 UTC (orbits, from this website), and its thermodynamic profiles also gave evidence of the EML. NUCAPS profiles in the region were produced by infrared/microwave retrievals that converged to a solution, as shown in the map below. (The region of the tropical disturbance, over the Leeward Islands, shows red sounding dots where rain is likely falling).

NOAA-20 NUCAPS sounding locations in/around Puerto Rico at ~0550 UTC on 29 July 2020 (Click to enlarge)
Two soundings from this overpass are shown below, along 65º W at ~21º N and ~20º N, also show evidence of an Elevated Mixed Layer in the same region of the atmosphere. (It is more apparent at 21.15º N/64.73º W)

NUCAPS Profiles from ~0600 UTC 29 July 2020 at 21.15 N, 65 W (left) and at 19.75 N, 65 W (right) (click to enlarge)
Gridded NUCAPS fields are available in AWIPS, but they are also available outside of AWIPS at this site from NASA SPoRT. 850-500 mb and 700-500 mb Lapse rates, shown below, show a region of steep lapse rates as you might expect from an EML to the north of Puerto Rico (yellow in the color enhancement applied).
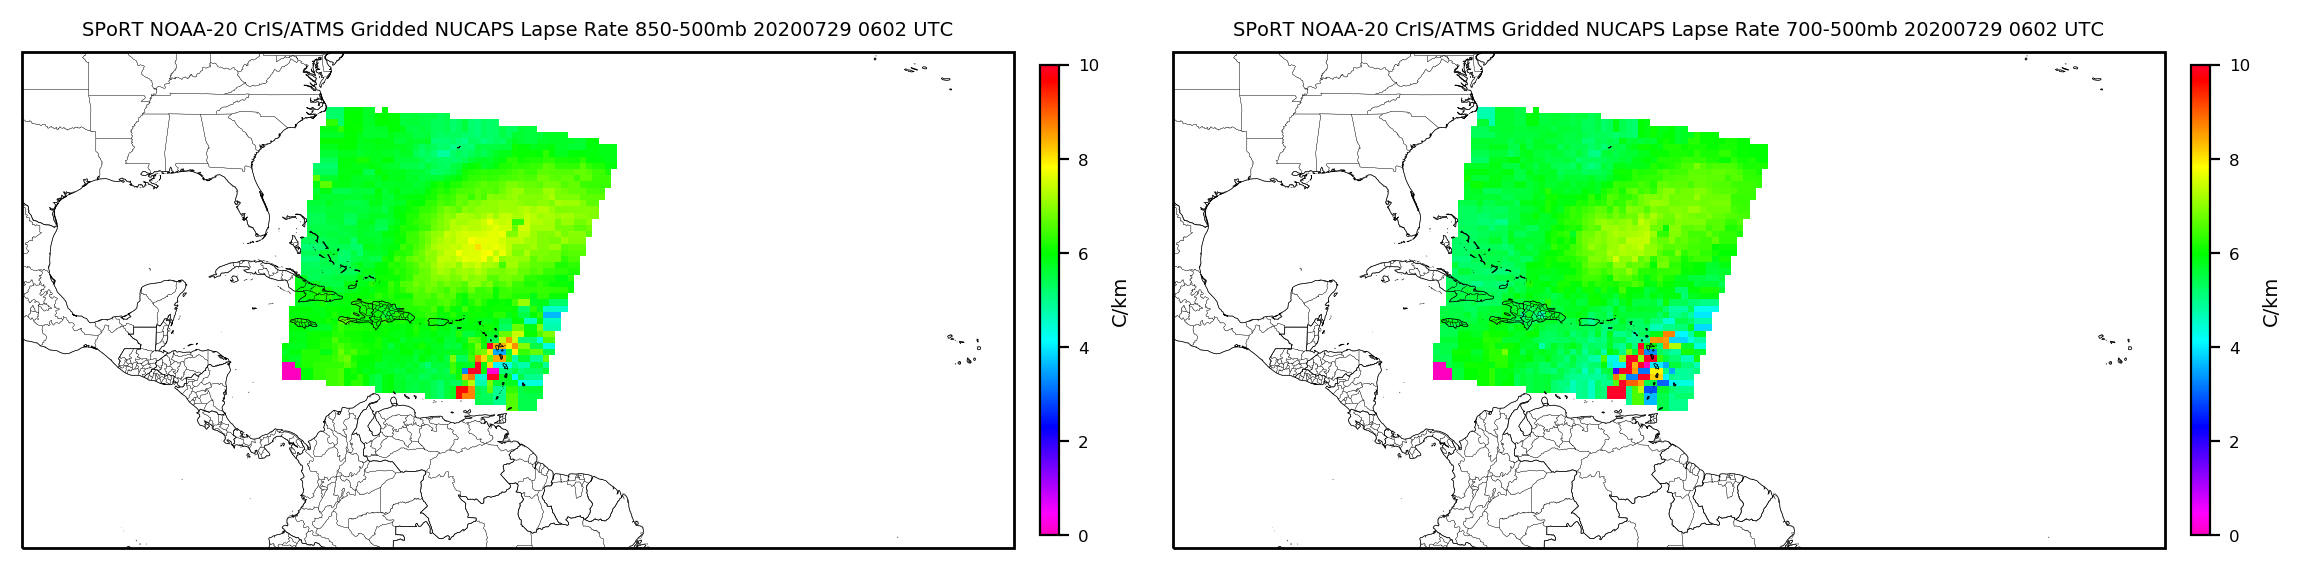
850-500 mb Lapse Rates (left) and 700-500 mb Lapse Rates (right) from the ~0600 UTC NOAA-20 overpass (Click to enlarge)
Gridded NUCAPS fields also confirm the dry air associated with the SAL air that contains the EML. Total Precipitable water is around 30 mm, and 850-mb relative humidity is under 40% in the region where the EML is indicated by lapse rates.
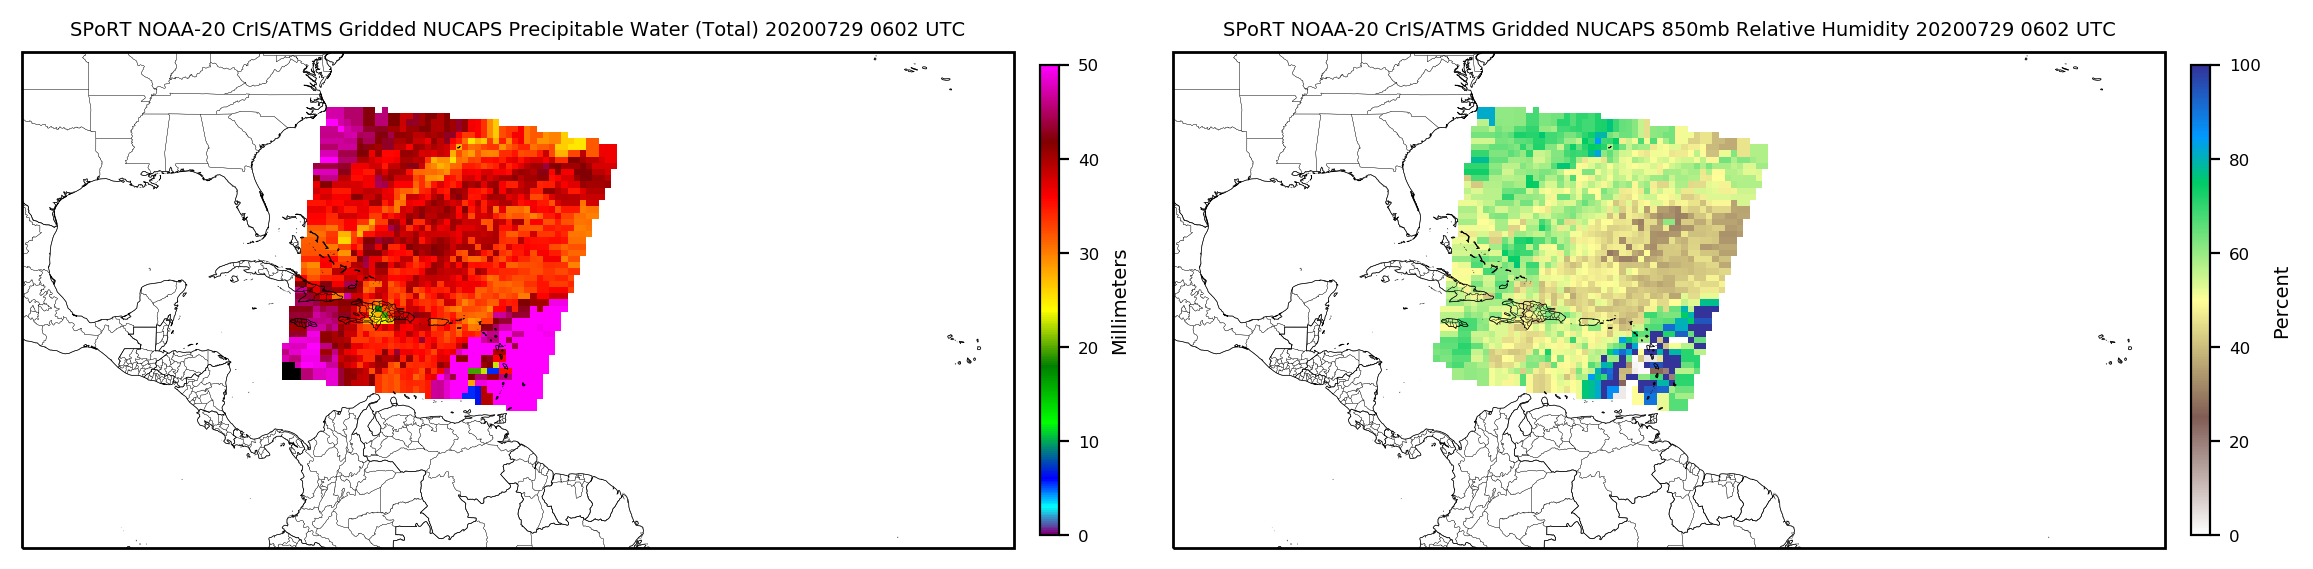
Total Precipitable Water (left) and 850-mb Relative Humidity (right) derived from the NOAA-20 NUCAPS data from the ~0600 UTC overpass on 29 July 2020 (click to enlarge)
For the latest information on Potential Tropical Cyclone #9 (should this system be named, the next name in the Atlantic alphabet is Isaías), refer to the National Hurricane Center website.
View only this post Read Less
![Himawari-8 “Red” Visible (0.64 µm) images [click to play animation | MP4]]( https://cimss.ssec.wisc.edu/satellite-blog/images/2020/07/200728_himawari8_visible_Kuril_Islands_vortices_anim.gif)

![GOES-17 “Red” Visible (0.64 µm) and “Clean” Infrared Window (10.35 µm) images [click to play animation | MP4]](https://cimss.ssec.wisc.edu/satellite-blog/images/2020/07/200726_goes17_infrared_visible_Hurricane_Douglas_anim.gif)
![GOES-17 “Clean” Infrared Window (10.35 µm) images, with analysis of deep layer wind shear at 20 UTC [click to enlarge]](https://cimss.ssec.wisc.edu/satellite-blog/images/2020/07/200726_20utc_goes17_infrared_shear_Douglas.gif)
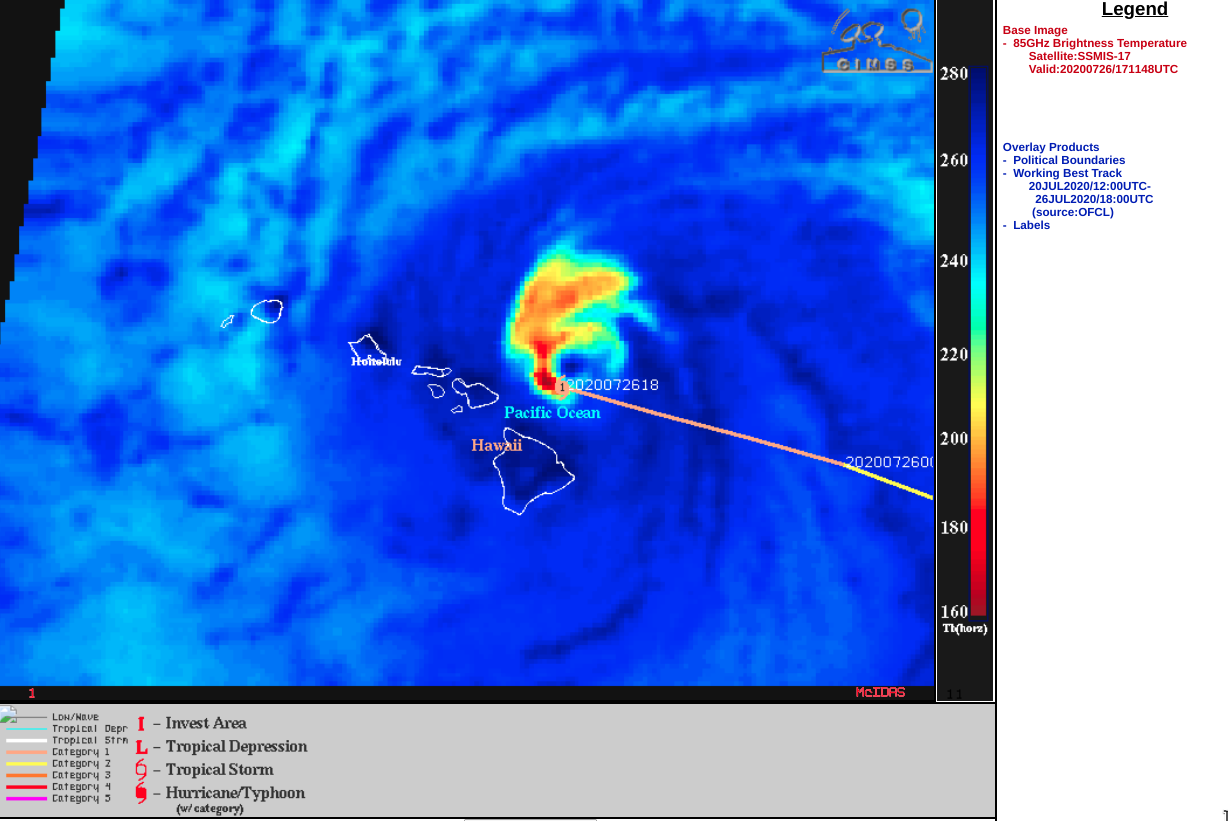
![DMSP-17 SSMIS Microwave (85 GHz) image at 1711 UTC, with the analyzed surface position of Douglas at 1800 UTC [click to enlarge]](https://cimss.ssec.wisc.edu/satellite-blog/images/2020/07/200726_1711utc_dmsp17_ssmis_microwave_Douglas.png)
![GOES-17 “Red” Visible (0.64 µm) and “Clean” Infrared Window (10.35 µm) images [click to play animation | MP4]](https://cimss.ssec.wisc.edu/satellite-blog/images/2020/07/200727_goes17_visible_infrared_Hurricane_Douglas_v2_anim.gif)
![GOES-17 “Red” Visible (0.64 µm) images, with analysis of deep layer wind shear at 22 UTC [click to enlarge]](https://cimss.ssec.wisc.edu/satellite-blog/images/2020/07/200727_visible_23utc_shear_anim.gif)
